
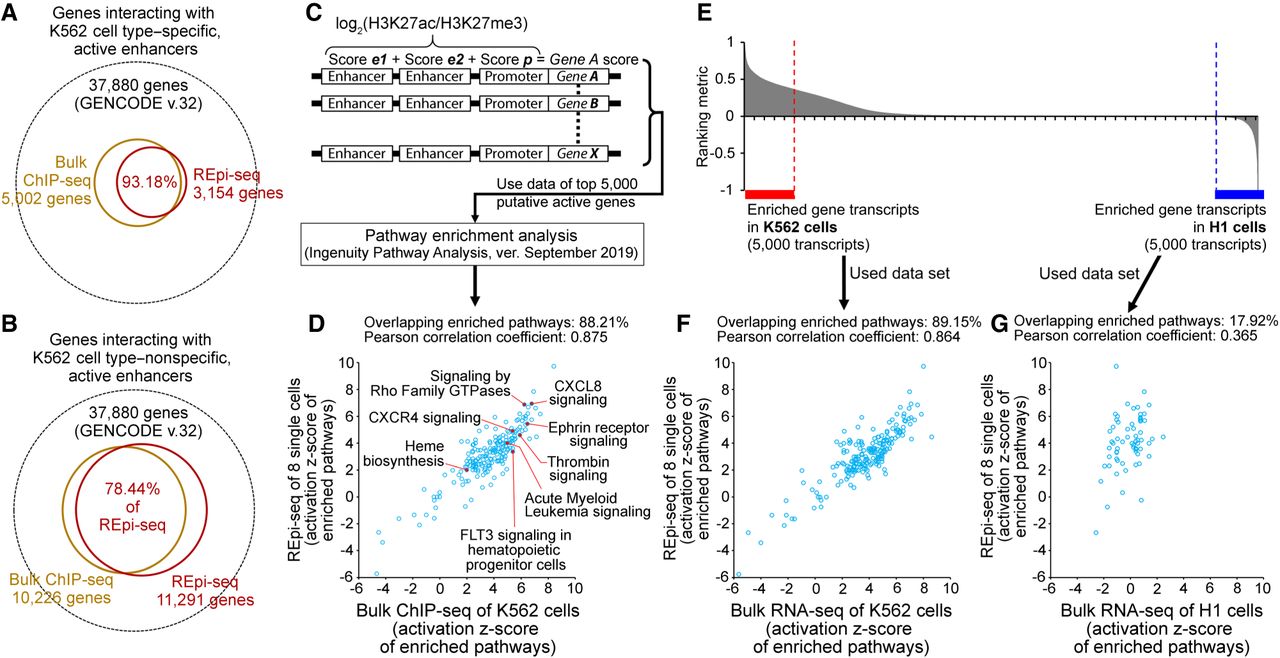
Evaluation of REpi-seq reproduced reads by target genes and target pathways. (A,B) Number of genes interacting with K562 cell type–specific, active enhancers (A) and K562 cell type–nonspecific, active enhancers (B). The activity of enhancers was determined by the relative ratio log2(H3K27ac/H3K27me3) from bulk ChIP-seq and REpi-seq data, as detailed in Methods. The results show the percent interacting genes detected by ChIP-seq of bulk K562 cells that were codetected by single cell REpi-seq. (C) Process for transmission of promoter + enhancers activity to a gene and extrapolating the biological function of active enhancers and promoters. (D) Enriched canonical pathways identified by bulk ChIP-seq and REpi-seq. Activation Z-scores from ChIP-seq (x-axis) and REpi-seq (y-axis) are shown; the Pearson correlation coefficient was calculated. (E) Differential gene expression in bulk K562 and H1 cells by RNA-seq. The top 5000 transcripts in K562 and H1 cells were used as input data in F and G. (F,G) Enriched canonical pathways identified by REpi-seq (eight single K562 cells) and RNA-seq from bulk K562 cells (top 5000 transcripts) (F), and by REpi-seq (eight single K562 cells) and RNA-seq from bulk H1 cells (top 5000 transcripts) (G).


