
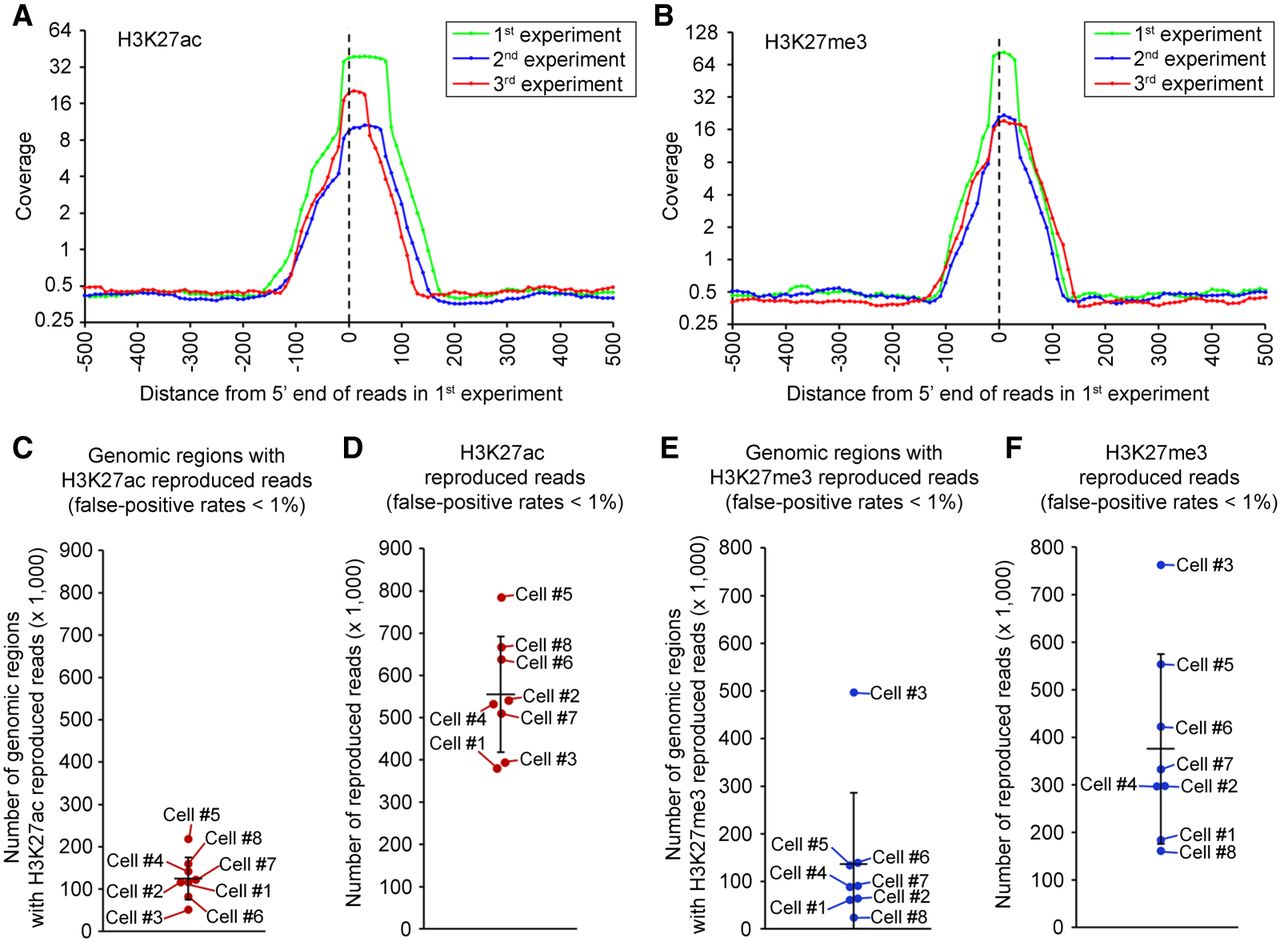
Repeated experiments identify reproduced reads in the same single cells. (A,B) Genomic location of H3K27ac (A) and H3K27me3 (B) marks is preserved over repeated experiments in eight single K562 cells. Genomic regions containing reads in the first experiment were analyzed in the two subsequent experiments. Read distribution in the first (green line), second (blue line), and third (red line) experiment is shown. (C,E) Number of genomic regions (500 bp) with reproduced antibody reads (false-positive rates <1% by the bootstrap procedure compared to IgG and randomized antibody reads) in each single cell (for details, see Supplemental Methods). Data sets from three repeated experiments with the same single cell were combined before identifying the genomic region with reproduced reads. The bootstrap procedure was performed separately in each single cell. Genomic regions with reproduced antibody reads were identified by the bootstrap procedure based on estimated false-positive rates (<1%). (D,F) Number of reproduced reads per cell from antibodies to H3K27ac (D) and H3K27me3 (F) (for details, see Supplemental Methods). Horizontal bars show the mean of eight single cells, and error bars represent standard deviation.


