
Abstract
Eukaryotic gene transcription is regulated by a large cohort of chromatin-associated proteins, and inferring their differential binding sites between cellular contexts requires a rigorous comparison of the corresponding ChIP-seq data. We present MAnorm2, a new computational tool for quantitatively comparing groups of ChIP-seq samples. MAnorm2 uses a hierarchical strategy for normalization of ChIP-seq data and assesses within-group variability of ChIP-seq signals based on an empirical Bayes framework. In this framework, MAnorm2 allows for abundant differential ChIP-seq signals between groups of samples as well as very different global within-group variability between groups. Using a number of real ChIP-seq data sets, we observed that MAnorm2 clearly outperformed existing tools for differential ChIP-seq analysis, especially when the groups of samples being compared had distinct global within-group variability.
Chromatin immunoprecipitation followed by high-throughput sequencing (ChIP-seq) has become the premier technology for profiling genome-wide localization of chromatin-binding proteins, including transcription factors and histones with various modifications (Mardis 2007; Park 2009). A common downstream analysis of ChIP-seq data is to identify the genomic regions associated with differential binding intensities between different biological conditions, which is essential to understanding the underlying mechanisms orchestrating the dynamics of gene expression program during various biological processes, including development and the onset of disease (Gifford et al. 2013; Lara-Astiaso et al. 2014; Koues et al. 2015). With the decrease of sequencing costs, researchers now are inclined to perform differential ChIP-seq analysis between groups of samples. On the one hand, when the samples of each group are biological replicates for the same experiment, differential analysis on the group level can achieve much better specificity and sensitivity than between individual samples (Steinhauser et al. 2016). This improvement is especially vital for comparing ChIP-seq samples from heterogeneous tissues or closely related cell lineages (Leung et al. 2015; Roadmap Epigenomics Consortium et al. 2015; Cejas et al. 2016). On the other hand, with ChIP-seq profiles for tissues/cells obtained from different individuals, researchers may classify them according to the age, sex, health status, or disease subtype of each donor, and then perform differential analysis between groups of profiles to identify the differential binding events associated with the characteristics. This analysis is of particular interest in the study of personal epigenomes, where fluctuations of histone modification levels across humans are often of functional importance and are best understood on the population level (Kasowski et al. 2013; Grubert et al. 2015; Waszak et al. 2015; Ott et al. 2018).
Despite the importance of group-level differential ChIP-seq analysis, it remains a highly challenging computational task owing to the high variability and noisiness intrinsic to ChIP-seq data (Steinhauser et al. 2016; Tu and Shao 2017). In general, a successful differential ChIP-seq analysis on the group level relies on a robust normalization approach as well as a sophisticated statistical model for assessing within-group variability of ChIP-seq signals (Meyer and Liu 2014; Nakato and Shirahige 2017). Here, we present MAnorm2, a new computational tool that has made specific efforts to tackle the two challenges in a manner that accounts for ChIP-seq data-specific characteristics.
In practice, the signal-to-noise (S/N) ratio varies significantly across ChIP-seq samples (Steinhauser et al. 2016; Nakato and Shirahige 2017), which greatly increases the difficulty of normalization. We previously developed MAnorm for normalization of a pair of ChIP-seq samples. It alleviates the problem of S/N ratio by using only common peaks of the two samples to infer a scale relationship between them (Shao et al. 2012). In MAnorm2, we extend MAnorm to normalization of any number of samples and further use a hierarchical strategy that takes advantage of the similarity structure among samples. Specifically, by first normalizing samples separately within each group and then performing a between-group normalization, we can improve both the unbiasedness and robustness of MAnorm2.
As for assessing within-group variability, in the field of differential RNA-seq analysis, the strategy has been adopted by several cutting-edge methods that use an empirical Bayes framework to borrow strength between genes with consideration of mean-variance dependence. For example, limma-trend fits a mean-variance curve (MVC) and squeezes gene-wise variance estimates toward the curve; voom is similar to limma-trend except that it encodes the fitted MVC into the precision weights of different expression measurements; DESeq2 uses the negative binomial distribution to model read counts and aims at fitting a mean-dispersion curve (MDC) (Sartor et al. 2006; Law et al. 2014; Love et al. 2014). In practice, these methods share information between genes to improve variance/dispersion estimation, which can compensate for the lack of sufficient replicates. The same principle applies to ChIP-seq data as well, and many studies have directly applied these methods to differential ChIP-seq analysis (Ross-Innes et al. 2012; Ter Huurne et al. 2017; Ott et al. 2018; Yi et al. 2019). Despite the usefulness of the modeling strategy, no methods exploiting it have been specifically developed for ChIP-seq data. As ChIP-seq data are typically associated with much higher variability and noisiness than RNA-seq data, the statistical models originally designed for differential RNA-seq analysis may not be flexible enough to account for the characteristics of ChIP-seq data.
One problem is that the RNA-seq methods derive the mean expression levels for MVC/MDC fitting by taking the average across all individual samples without considering their group labels. This strategy generally works well for differential RNA-seq analysis since, in most cases, the majority of genes should have nondifferential expression. For differential ChIP-seq analysis, however, the strategy may considerably bias the resulting MVC/MDC owing to the abundance of differential ChIP-seq signals. In practice, differential protein-binding events can be abundant even between very similar cellular contexts (Xu et al. 2012; Kasowski et al. 2013). A primary reason is that the activity of regulatory elements, especially those at distal regions, is much more variable across cellular contexts than is gene expression (Ernst et al. 2011; Kasowski et al. 2013; Heinz et al. 2015). Another problem is that the RNA-seq methods do not explicitly model the difference in global within-group variability between different groups of samples. In practice, however, within-group variability of ChIP-seq signals can vary significantly across groups. For instance, when comparing ChIP-seq profiles between normal individuals and cancer patients, within-group variability in the cancer group is often much higher than that in the normal group owing to the heterogeneity of cancer tissues/cells and the diversity of cancer subtypes and stages.
In MAnorm2, we aim at designing a statistical model that addresses these concerns. Specifically, we resolve the two problems by deriving mean and variance estimates separately within each group of samples, adjusting the variance estimates from different groups based on the global within-group variability of each group, and pooling the resulting mean-variance pairs into a regression process.
Results
Hierarchical normalization for groups of ChIP-seq samples
To facilitate the understanding of the working principle of MAnorm2, we first give a brief description of some basic concepts. An MAnorm2 analysis starts with a count matrix and an occupancy matrix. Rows and columns of both matrices correspond to a predefined list of genomic intervals and a set of ChIP-seq samples, respectively. For each interval in each sample, the count matrix records the number of sequencing reads falling within the interval, and the occupancy matrix uses a binary variable to indicate whether the interval is enriched with reads (or whether it is a peak region). Formally, MAnorm2 refers to a genomic interval as occupied by a ChIP-seq sample if the interval is enriched with reads in the sample.
For each MAnorm2 analysis in this study, we compiled the list of intervals by calling peaks for each related ChIP-seq sample and merging all the resulting peaks. Occupancy states of intervals in each sample were then determined based on their overlaps with the peaks identified for the sample. See Methods for details about the construction of input matrices of MAnorm2, but note that the MAnorm2 machinery is independent of the specific method for obtaining a list of intervals and determining their occupancy states.
We previously developed MAnorm for pairwise comparison of ChIP-seq samples. It normalizes two individual samples by removing the M-A trend at their common peaks (M and A values refer to log2 fold change and average log2 read count, respectively), based on the assumption of no global change of protein binding intensities at these regions (Shao et al. 2012). In MAnorm2, we retain the core assumption of MAnorm and further devise a hierarchical scheme to take advantage of the group structure of samples.
Here, we use the normalization of H3K4me3 ChIP-seq data for two lymphoblastoid cell lines (LCLs) (GM12891 and GM12892) as an example. The two LCLs are derived from different Caucasian individuals, and each of them is associated with three biological replicates (Kasowski et al. 2013). In the hierarchical normalization process, MAnorm2 first separately normalizes the replicates of each LCL and then performs a between-group normalization (Fig. 1A). For the first step, MAnorm2 selects a baseline sample for each group (based on the size factors of samples) (see Methods) and repeatedly normalizes every other sample in the group against the baseline. Technically, to normalize an individual sample against another, MAnorm2 applies a linear transformation to the log2 read counts of the former such that the M-A trend at their common peak regions (i.e., genomic intervals occupied by both samples) is eliminated. For the second step, MAnorm2 creates a reference ChIP-seq profile for each LCL by taking the average across its replicates (using normalized log2 read counts from the first step), and re-applies the above procedure for within-group normalization to the resulting reference profiles (by default, MAnorm2 treats an interval as occupied by a reference profile if it is occupied by any samples in the corresponding group). Then, the linear transformation derived for the nonbaseline reference profile is equally applied to each replicate of the corresponding LCL.
Hierarchical normalization for groups of ChIP-seq samples. (A) Diagram illustrating the hierarchical normalization process applied to the H3K4me3 ChIP-seq samples of GM12891 and GM12892 LCLs. (B) MA scatterplots for each pair of H3K4me3 samples before and after normalization. Only common peak regions of the associated two samples are used to draw each plot, in which the top-right numeric value gives the Pearson correlation coefficient (PCC) between M and A values across these regions. Red lines are fitted by the least squares method. (C) MA scatterplot for normalized reference profiles of GM12891 and GM12892. Here, genomic intervals are classified based on their occupancy states in the two reference profiles.
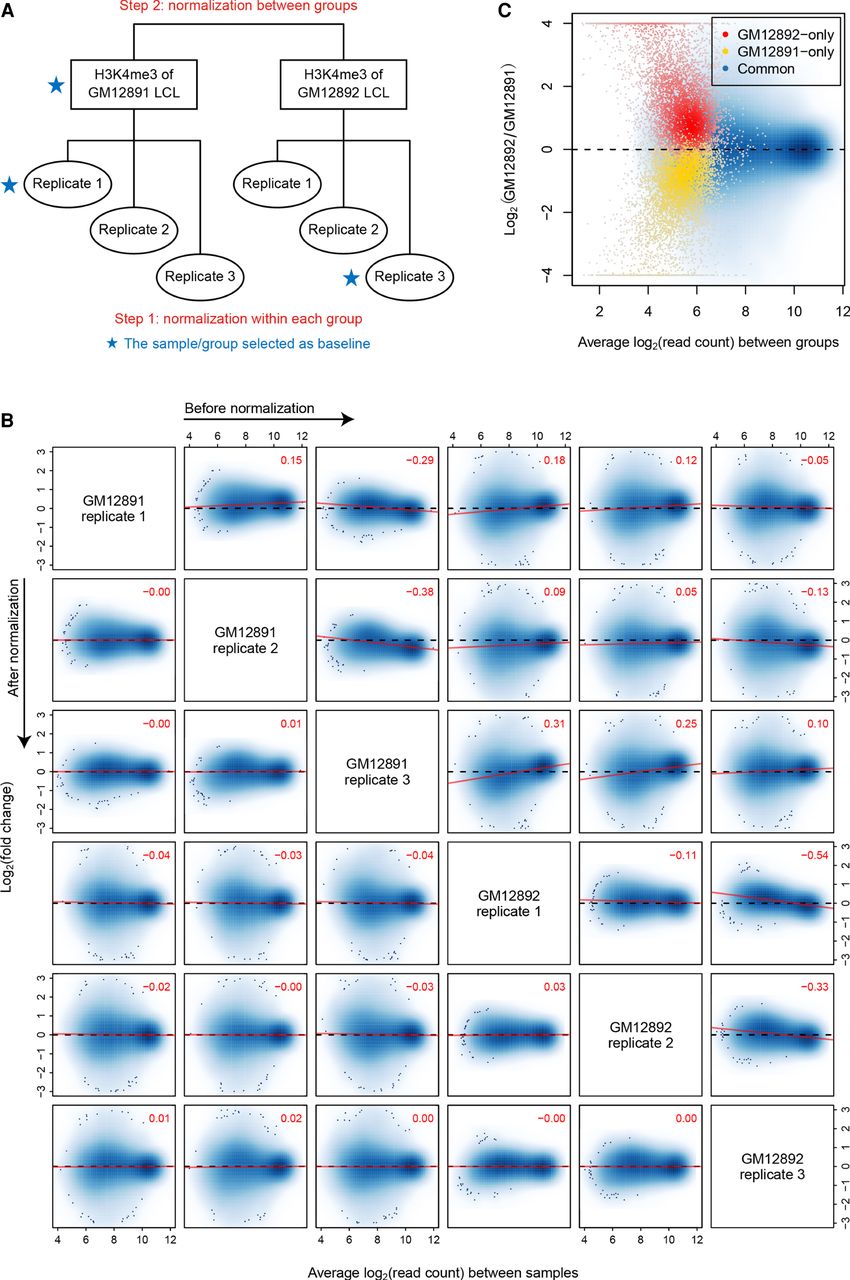
After completing the entire normalization process, we observed that the M-A trend at common peak regions of each pair of samples was largely eliminated, no matter whether the two samples belonged to the same group and whether they had ever been selected as baseline (Fig. 1B). This result indicated that ChIP-seq signal intensities were now comparable across all the samples, and we could then quantify fold changes of H3K4me3 levels between the two LCLs by calculating M values between their (normalized) reference profiles. Of note, the M values for GM12891/GM12892-specific peak regions were systematically biased toward the LCL, while the M values for common peak regions had a roughly symmetric distribution (Fig. 1C). This result supported the necessity of treating only common peak regions as globally invariant across samples when normalizing ChIP-seq data.
Modeling mean-variance trend under an empirical Bayes framework
MAnorm2 next models normalized log2 read counts as following normal distribution. For a differential analysis between two groups of samples, a straightforward method is to apply a t-test to each genomic interval. In practice, however, the number of ChIP-seq samples in a group is often small (typically 2−3 when the group comprises biological replicates), which gives rise to variance estimates with large uncertainty and, thus, compromises the statistical power for identifying differential signals.
To tackle this problem, MAnorm2 borrows strength between genomic intervals with similar signal levels by fitting a smooth MVC (Fig. 2A), which is then incorporated into the differential analysis under an empirical Bayes framework for achieving shrinkage of variance estimates (see Methods and Supplemental Note S1). Similar to limma-trend (Sartor et al. 2006; Law et al. 2014), MAnorm2 specifies an inverse-gamma distribution as the prior distribution of the variance of each interval, with the associated parameters determined by the MVC and a hyperparameter denoted by d0, which is referred to as the number of prior degrees of freedom and amounts to the number of additional samples acquired by sharing information between intervals. In effect, the final variance estimate for each individual interval is a weighted average of its prior and observed variances (the former is obtained from the MVC), with the weights being proportional to their respective numbers of degrees of freedom.
Modeling the mean-variance trend to improve variance estimation. (A) Scatterplot showing the mean-variance trend associated with the H3K4me3 ChIP-seq samples of GM12891 and GM12892. Red line depicts the fitted MVC, and d0 gives the estimated number of prior degrees of freedom. (B) In the identification of differential H3K4me3 levels between GM12891 and GM12892, the proportion of true discoveries among top-ranked promoter intervals is plotted against the number of top-ranked promoter intervals. DEGs were identified by applying DESeq2 to the corresponding RNA-seq data with a P-value cutoff of 0.01. MAnorm has been applied to all possible comparisons of two individual samples of GM12891 and GM12892, respectively, and we show here the median as well as the first and third quartiles of the true discovery proportions achieved in the total nine comparisons. (C) Box plots for z-statistic equivalents of the P-values assigned to promoter regions of DEGs and non-DEGs. Dotted lines correspond to a two-tailed P-value of 0.05. Non-DEGs were defined as the genes with a DESeq2 P-value larger than 0.5 and a fold change less than 2.
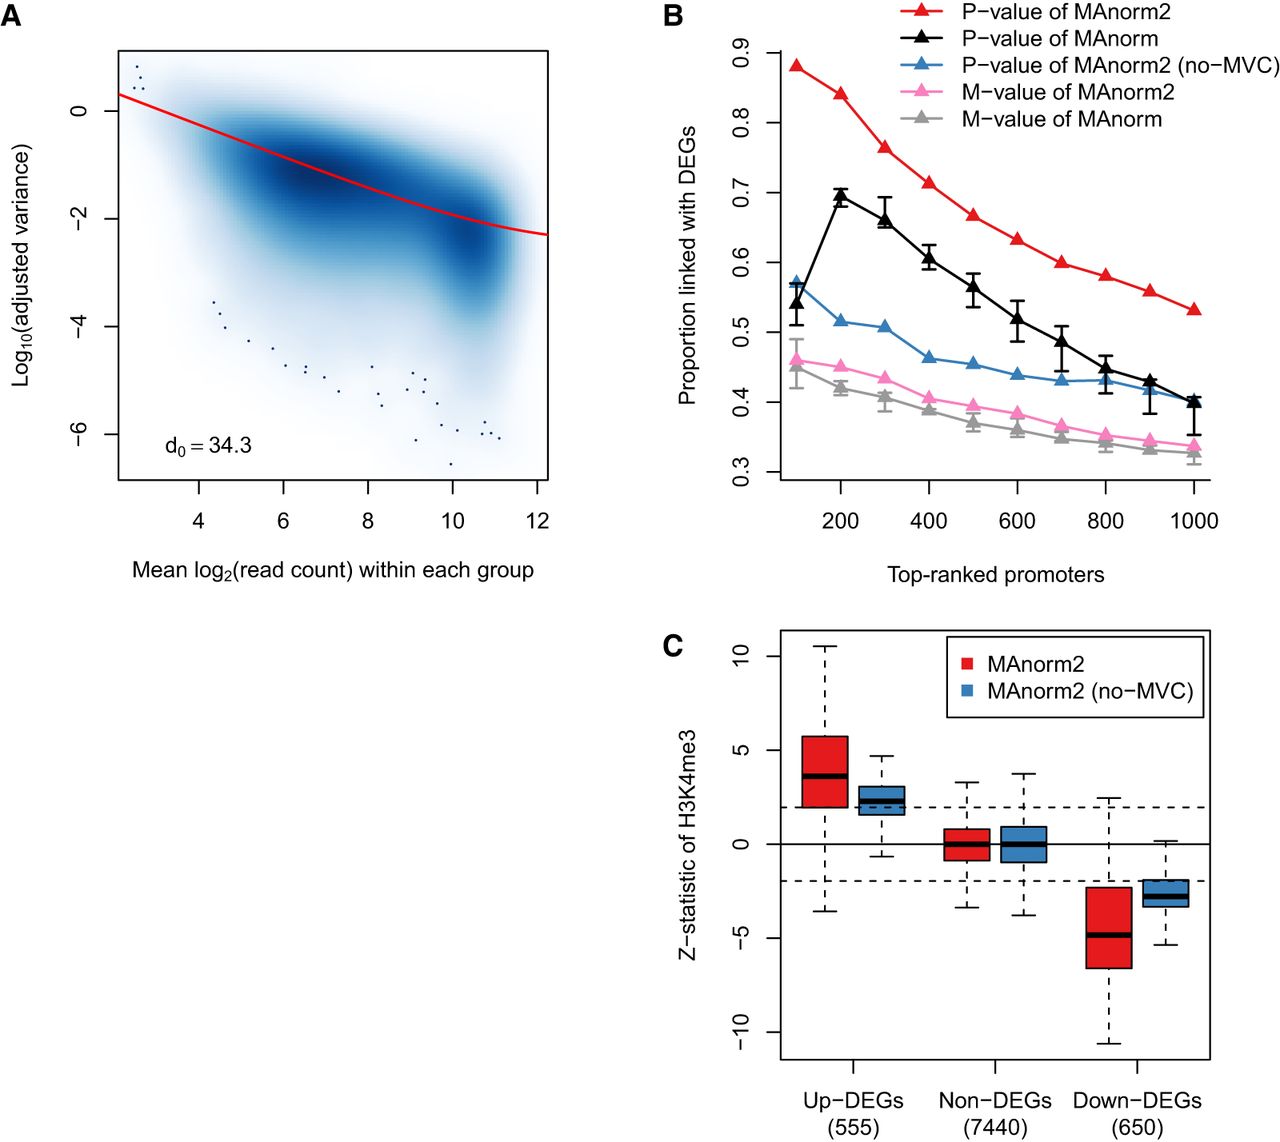
By performing a differential analysis of the H3K4me3 ChIP-seq data between GM12891 and GM12892 LCLs, we compared the performance of several statistics for calling differential genomic intervals. These statistics included the M values and P-values of MAnorm and MAnorm2 as well as the P-value of a variant of MAnorm2 (referred to as no-MVC). Technically, no-MVC uses only observed variances to derive final variance estimates and is intrinsically equivalent to an ordinary t-test. Since H3K4me3 levels at gene promoters are strongly correlated with gene expression levels, we defined, for the intervals located at promoter regions, true differential ones as those that were linked with differentially expressed genes (DEGs). Using each of the statistics, we ranked promoter intervals in order of evidence of differential H3K4me3 levels between the two LCLs and calculated the proportions of true discoveries among the top-ranked ones (Fig. 2B). We found that MAnorm2 led to clearly higher true discovery proportions than MAnorm, with respect to both the M value and P-value. Besides, a substantial improvement in method performance was observed from no-MVC to MAnorm2, which illustrated the power of empirical Bayes shrinkage for variance estimation. We also examined the exact P-values assigned to the intervals located at promoter regions of DEGs and non-DEGs (for better presentation, shown in Figure 2C are actually z-statistics, which were obtained by mapping two-tailed P-values along with the signs of M values to the standard normal distribution) (Fig. 2C). It can be seen that, benefiting from modeling the mean-variance relationship to reduce the uncertainty of variance estimates, MAnorm2 considerably increases the sensitivity for identifying differential intervals without sacrificing its specificity.
Empirical Bayes shrinkage for variance/dispersion estimation has been exploited by several existing tools for differential RNA-seq analysis (Law et al. 2014; Love et al. 2014). Technically, these tools improve the adaptivity to data sets of various characteristics by empirically determining the shrinkage strength. Similarly, the hyperparameter d0 in MAnorm2 effectively controls the degree to which observed variances are squeezed toward MVC, and d0 is estimated from the data set under analysis. Despite the wide use of this strategy, few studies have used concrete examples to demonstrate specifically how it contributes to the adaptivity of a method. In particular, the advantage of empirical Bayes shrinkage over using directly prior variances/dispersions is of much interest. Here, we applied MAnorm2 in two scenarios with which the associated variance structures were of distinct complexity. In the first scenario, samples in the same group were biological replicates, while in the second one each group consisted of profiles for different individuals. For this analysis, we incorporated H3K4me3 ChIP-seq data for two additional Caucasian LCLs (GM12890 and SNYDER, each associated with two biological replicates). We performed a comparison of H3K4me3 levels between GM12890 and SNYDER for the first scenario. For the second one, we classified the total four LCLs into two males (GM12891 and SNYDER) and two females (GM12890 and GM12892) and performed a between-sex comparison (note that we created a reference profile for each LCL and conducted a two-versus-two comparison as in the first scenario). Variance structure in the second scenario should be much more complicated than in the first one, as within-group variability in the second scenario was additionally influenced by epigenetic variation across humans (Kasowski et al. 2013). This difference was also indicated by distinct d0 estimates for the two comparisons, which were 14.6 and 4.2, respectively (Supplemental Fig. S1A,B). We then used the corresponding gene expression data to evaluate the performance of MAnorm2 and another variant of it (referred to as MVC-only), which directly uses prior variances as final variance estimates. While the performance of MVC-only was comparable with MAnorm2 in the first scenario, it was significantly outperformed by MAnorm2 in the second one (Supplemental Fig. S1C,D). These results explicitly demonstrated how empirical Bayes shrinkage for variance estimation improves the adaptivity of a method (see Supplemental Note S2 for a more detailed discussion of this topic).
Comparing MAnorm2 with other empirical Bayes methods that account for the mean-variance/dispersion relationship
The strategy of modeling the mean-variance/dispersion trend under an empirical Bayes framework has been used by several methods for differential RNA-seq analysis, including limma-trend, voom, and DESeq2 (Sartor et al. 2006; Law et al. 2014; Love et al. 2014). The primary differences between MAnorm2 and these RNA-seq methods relate to two considerations of MAnorm2: (1) MAnorm2 calculates observed means and variances separately within each group of samples to render the unbiasedness of MVC fitting resistant to the abundance of differential signals between groups; and (2) MAnorm2 adjusts the observed variances from different groups to make them comparable across groups. For the latter, MAnorm2 introduces γj (termed variance ratio factor) to parameterize the global within-group variability of group j. For a comparison between group 1 and 2, MAnorm2 derives an estimate of γ2/γ1 and uses this ratio to adjust the observed variances from group 2.
To investigate the practical utility of the two considerations, we made a systematic comparison of MAnorm2 with limma-trend, voom, and DESeq2 in differential analysis of real ChIP-seq data. We first compared their performance in identifying differential H3K4me3 levels between GM12891 and GM12892. This analysis can serve as a good example to illustrate the utility of the first consideration alone, as there was only a small difference in global within-group variability between the two groups (the estimated γGM12892/γGM12891 was 0.802). Based on the corresponding gene expression data, we found that MAnorm2 provided better rankings of promoter intervals compared to the other methods (Fig. 3A).
Comparison among empirical Bayes methods that take the mean-variance/dispersion relationship into account. (A) Comparing the performance of MAnorm2 with limma-trend, voom, and DESeq2 in the differential analysis of H3K4me3 ChIP-seq data between GM12891 and GM12892. (B) Comparing the four methods in all pairwise comparisons of H3K4me3 levels among GM12890, GM12891, GM12892, and SNYDER LCLs. Each line corresponds to an individual comparison between two LCLs, and the methods are sorted by the average true discovery proportion (among 500 top-ranked promoter intervals) across all the six comparisons. (C,D) Comparing the four methods with unifying their normalization methods to hierarchical MA normalization. (E,F) Comparing the performance of MAnorm2 coupled with different normalization methods. Note that methods in D and F have been sorted as well.
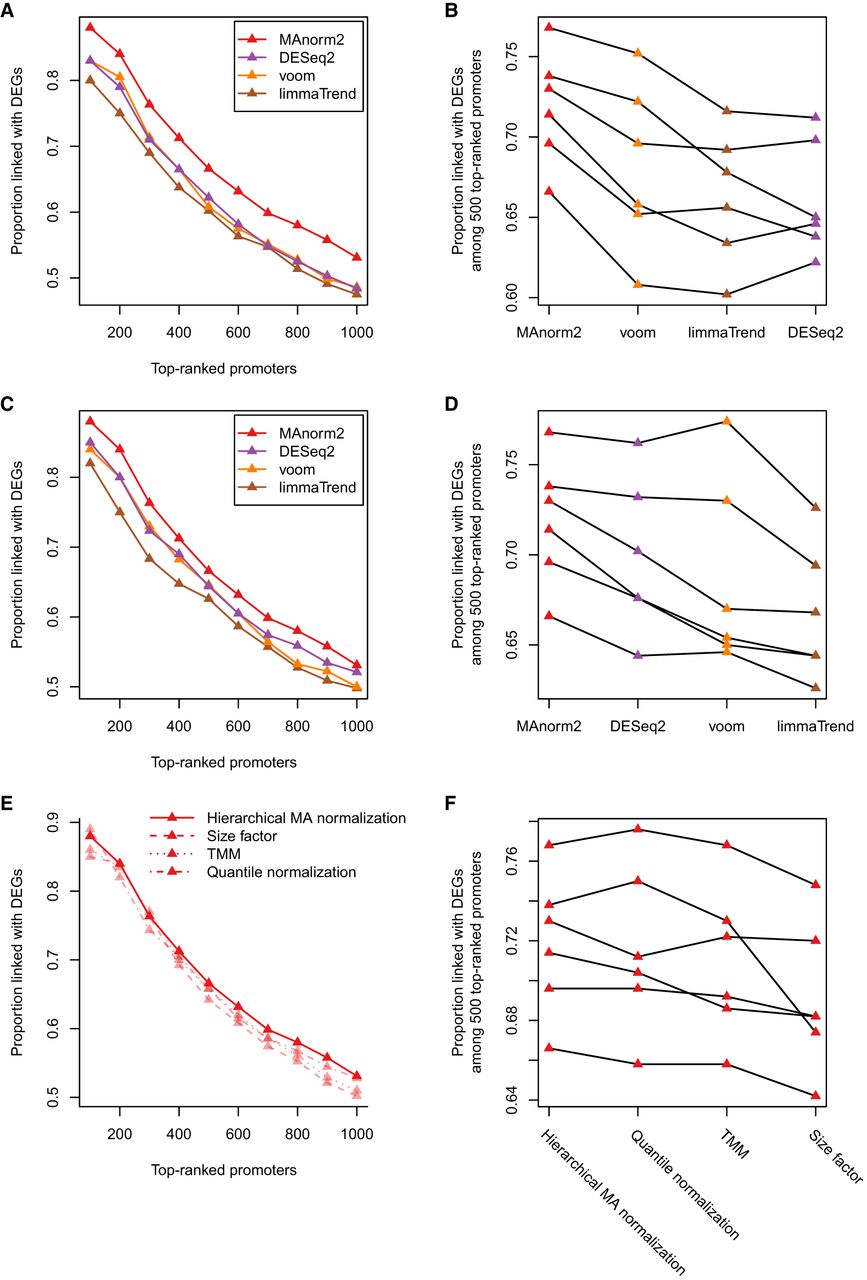
We further performed all pairwise comparisons of H3K4me3 levels among the four LCLs (GM12890, GM12891, GM12892, and SNYDER), which resulted in six comparisons in total. In each comparison, we calculated true discovery proportions among top-ranked promoter intervals for each method (Fig. 3B; Supplemental Fig. S2). In summary, each method was associated with 60 true discovery proportions, and MAnorm2 provided the best performance in 51 cases (including two ties with voom). We also repeated these analyses with different peak-calling cutoffs and observed very similar results (Supplemental Figs. S3, S4).
We next controlled for the specific normalization method when comparing the differential analysis methods, which had been applied to the same count matrix with their respective normalization methods in each of the previous differential analyses. By default, we applied limma-trend and voom in this study with the TMM (weighted trimmed mean of M values) normalization method (Robinson and Oshlack 2010) and applied DESeq2 with size factors derived by the median-ratio strategy (Anders and Huber 2010). Both TMM and size factor methods normalize read counts by applying a linear scaling factor to each sample. They cannot remove the M-A trend among samples, nor do they exploit the group structure of samples. For a fairer method comparison, we applied limma-trend, voom, and DESeq2 to the normalization results derived by hierarchical MA normalization (i.e., the normalization method of MAnorm2). In this way, their performance has been improved, but the overall performance of MAnorm2 was still superior to them (Fig. 3C,D). This relative performance was also observed when applying all four methods separately with size factor, TMM, and quantile normalization methods (Supplemental Fig. S5). We also compared the performance of MAnorm2 coupled with different normalization methods and found the best overall performance of MAnorm2 was achieved by hierarchical MA normalization (Fig. 3E,F).
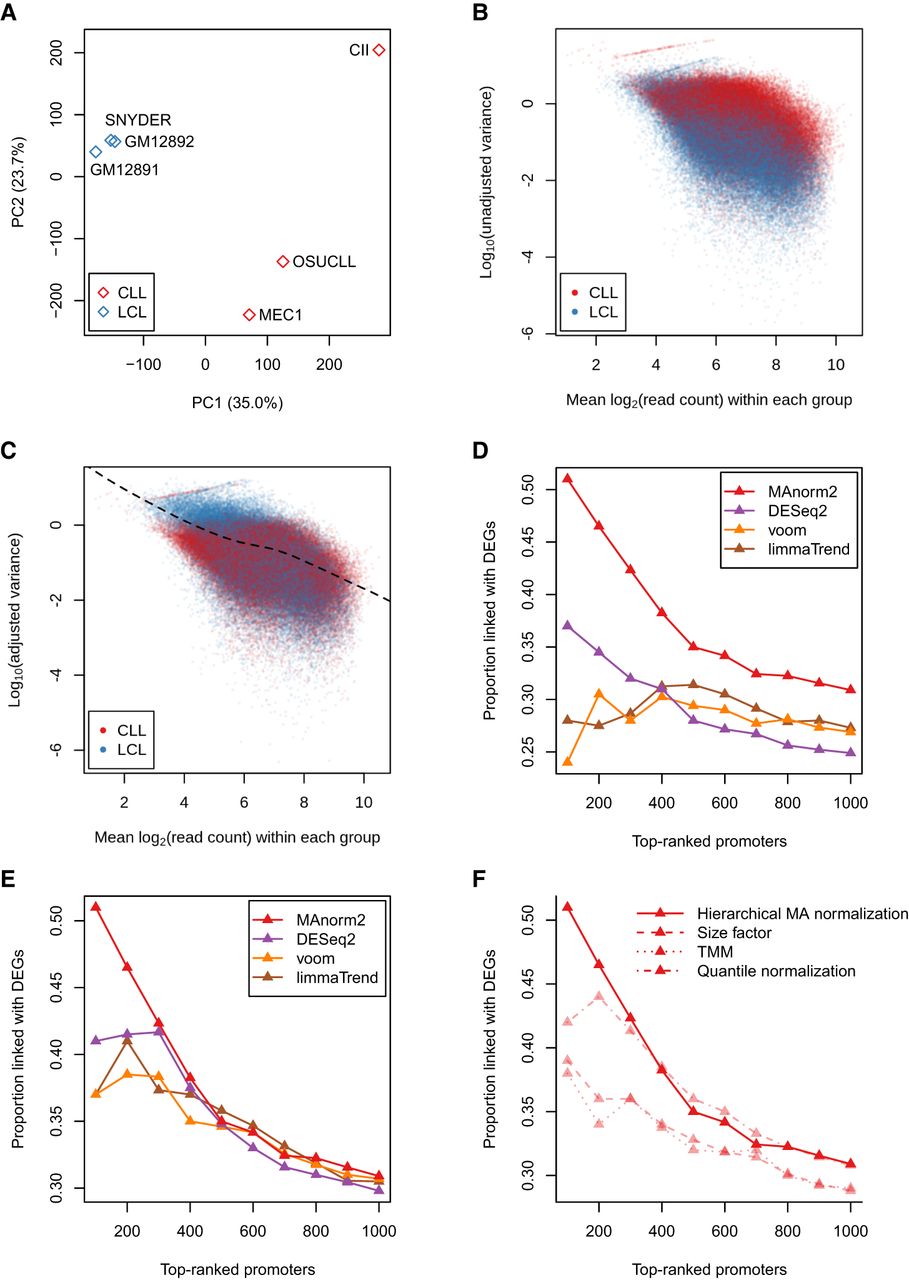
For the second consideration of MAnorm2, we performed a differential analysis between normal individuals and cancer patients. We first collected H3K27ac ChIP-seq data for three chronic lymphocytic leukemia (CLL) cell lines (MEC1, OSU-CLL, and CII) derived from different patients (Ott et al. 2018). For the normal counterparts, we selected GM12891, GM12892, and SNYDER LCLs to match the sex composition of the CLL group. Note that all these LCLs and CLL cell lines are derived from primary B cells harvested from donors.
After normalizing the H3K27ac ChIP-seq data by using hierarchical MA normalization, we performed a principle component analysis (PCA) and found the global within-group variability of the CLL group was much higher than that of the LCL group (Fig. 4A). This difference is also indicated by the scatterplot of (unadjusted) observed mean-variance pairs from different groups (Fig. 4B). Consistently, MAnorm2 derived an estimate of γCLL/γLCL of about 3.66. This ratio was then used to adjust the observed variances from the CLL group, and an MVC was fitted on the resulting mean-variance pairs from both groups (Fig. 4C). The whole process is essentially to normalize observed variances across groups, and MAnorm2 manages to integrate this normalization into a statistical model for the following differential tests. We made a comparison between the LCL and CLL groups and found that MAnorm2 clearly outperformed the other three methods in this analysis (Fig. 4D; Supplemental Fig. S6). Again, this relative performance remained basically unchanged when we controlled for the specific normalization method (Fig. 4E; Supplemental Fig. S7). We also compared the performance of MAnorm2 across different normalization methods and found that MAnorm2 performed best when coupled with hierarchical MA normalization (Fig. 4F).
Explicitly modeling the difference in global within-group variability between groups. (A) PCA results on normalized H3K27ac ChIP-seq signal intensities of three LCLs and three CLL cell lines. (B) Scatterplot of log10 observed variances against observed mean signal intensities from different groups of samples. (C) Scatterplot of log10 adjusted variances against observed mean signal intensities. (D) Comparing the performance of MAnorm2 with limma-trend, voom, and DESeq2 in the differential analysis of H3K27ac ChIP-seq data between LCLs and CLL cell lines. (E) Comparing the four methods with unifying their normalization methods to hierarchical MA normalization. (F) Comparing the performance of MAnorm2 across different normalization methods.
In this LCL-CLL comparison, the advantage of hierarchical MA normalization over the linear scaling methods was even more significant than in the GM12891-GM12892 comparison. A primary reason was the serious M-A trend between the LCL and CLL groups, which resulted in very unbalanced statistical power for identifying up-regulated signals in different groups when we applied limma-trend, voom, and DESeq2 with their default normalization methods (Supplemental Fig. S8A–D). Specifically, the three methods tended to rank up-regulated intervals in the CLL group lower than those in the LCL group, while MAnorm2, applied with hierarchical MA normalization, did not (Supplemental Fig. S8E). This tendency of the three methods was clear even after they were equipped with hierarchical MA normalization, though the unbalanced statistical power for the two groups was indeed alleviated (Supplemental Fig. S9). In particular, among the promoter intervals linked with DEGs, there were 13 that were ranked in the top 100 promoter intervals by MAnorm2 but not by the three methods, and 11 of them were up-regulated in the CLL group. Supplemental Figure S10 gives several examples of the 13 intervals, and it can be seen that H3K27ac ChIP-seq signal in each of them is clearly more variable in the CLL group than in the LCL group. Together, these observations suggested that properly handling the difference in global within-group variability between groups can contribute to balancing the statistical power for identifying up-regulated signals in different groups.
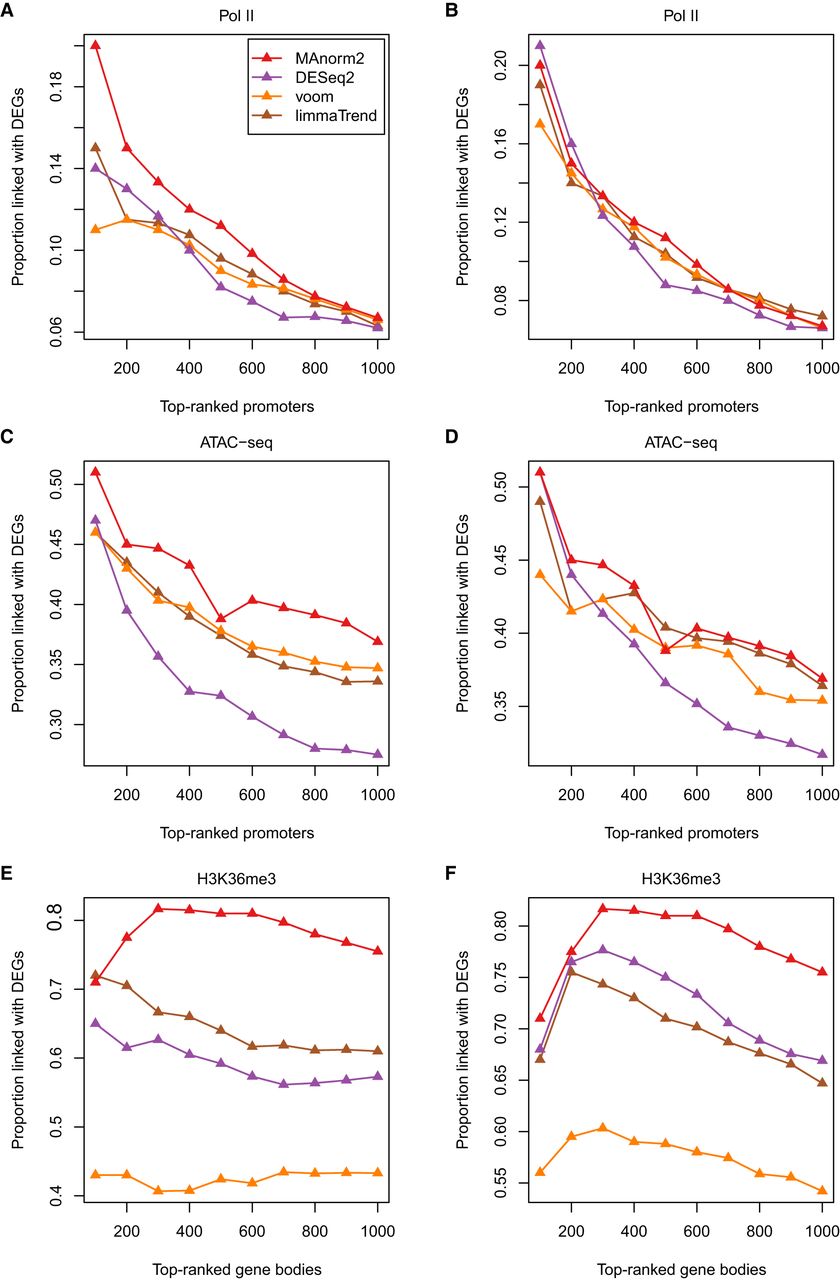
We next performed additional differential analyses for more comprehensively comparing the methods. We first compared their performance on ChIP-seq data for transcription factors by conducting a differential analysis of Pol II ChIP-seq data between seven Japanese and seven non-Japanese lung adenocarcinoma (LUAD) cell lines (Suzuki et al. 2014). Then, we performed a differential ATAC-seq (assay for transposase-accessible chromatin using sequencing) analysis between 27 LUAD and nine lung squamous cell carcinoma (LUSC) patients, corresponding to two common subtypes of non-small cell lung carcinoma (Wang et al. 2019). This analysis illustrated the applicability of MAnorm2 to other types of sequencing data. Finally, to evaluate the performance of MAnorm2 on ChIP-seq data for histone modifications with broad peaks, we compared H3K36me3 levels between H1, an embryonic stem cell line, and GM12891, each associated with two biological replicates. In each of these differential analyses, MAnorm2 clearly outperformed limma-trend, voom, and DESeq2 when they were applied with their default normalization methods, and MAnorm2 performed as well or better than them when they were applied with hierarchical MA normalization (Fig. 5A–F). For reference, the γ2/γ1 estimates for these differential analyses were 1.75, 1.80, and 3.24, respectively. Note that the last differential analysis indicated that distinct global within-group variability between different groups of samples does not necessarily result from biological reasons (one of the two replicates of GM12891 had an effective library size less than two million, which resulted in high variability of ChIP-seq signals).
Method comparison on additional data sets. (A,B) Differential analysis of Pol II ChIP-seq data between seven Japanese and seven non-Japanese LUAD cell lines. (C,D) Differential ATAC-seq analysis between 27 LUAD and nine LUSC patients. (E,F) Differential analysis of H3K36me3 ChIP-seq data between H1 and GM12891, each associated with two biological replicates. In this analysis, we selected for each gene the widest genomic interval overlapping its body. These intervals were then ranked separately by each method. In A, C, and E, methods are applied with their respective default normalization methods. In B, D, and F, methods are applied with hierarchical MA normalization.
Comparing MAnorm2 with other tools for group-level differential ChIP-seq analysis
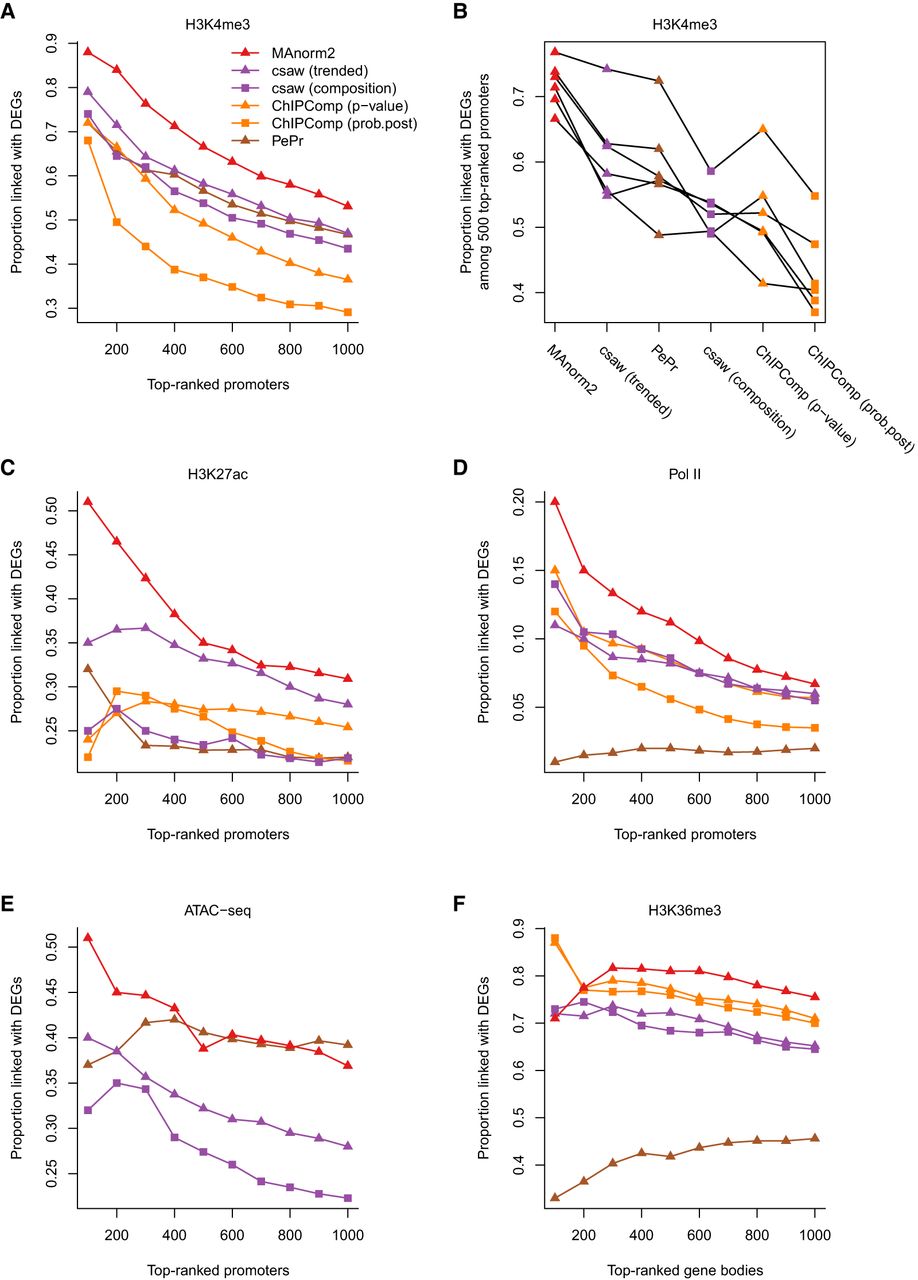
There are two broad classes of computational tools for differential ChIP-seq analysis (Steinhauser et al. 2016; Tu and Shao 2017). The first class requires users to provide predefined peaks for related samples, while the second class has no such requirement. We selected three representative tools to compare with MAnorm2, including ChIPComp from the first class as well as PePr and csaw from the second one (Zhang et al. 2014; Chen et al. 2015; Lun and Smyth 2016). For ChIPComp, we separately used each of two statistics to rank genomic intervals, which were P-value and the posterior probability that the fold change is greater than 2. For csaw, we tried two normalization methods provided by it. The first one removes trended biases (i.e., M-A trend among samples) by using abundance-dependent offsets, and the second one normalizes for composition biases by applying the TMM method. We applied these tools to the previous differential analyses and found that they were outperformed by MAnorm2 in the vast majority of cases (Fig. 6A–F; Supplemental Fig. S11).
Comparing MAnorm2 with other tools for group-level differential ChIP-seq analysis. (A) Differential analysis of H3K4me3 ChIP-seq data between GM12891 and GM12892. (B) Pairwise comparisons of H3K4me3 levels among GM12890, GM12891, GM12892, and SNYDER. Methods are sorted by the average true discovery proportion (among 500 top-ranked promoter intervals) across all the comparisons. (C) Differential analysis of H3K27ac ChIP-seq data between LCLs and CLL cell lines. (D) Differential analysis of Pol II ChIP-seq data between Japanese and non-Japanese LUAD cell lines. (E) Differential ATAC-seq analysis between LUAD and LUSC patients. ChIPComp is not applicable in this analysis as it requires input samples to model background noise. (F) Differential analysis of H3K36me3 ChIP-seq data between H1 and GM12891.
Discussion
In the study, we developed MAnorm2 for quantitatively comparing groups of ChIP-seq samples. MAnorm2 comprises a hierarchical MA normalization approach and an empirical Bayes model that exploits the mean-variance relationship to improve variance estimation.
For the normalization part, the hierarchical approach takes advantage of the similarity structure among samples to reduce normalization biases. It also reduces the variability of normalization results by avoiding selecting a single baseline from many samples. Here, we extensively evaluate the techniques used in hierarchical MA normalization, using the pairwise comparisons among LCLs and the LCL-CLL comparison as examples. We first compared hierarchical and nonhierarchical MA normalization methods by applying the statistical model part of MAnorm2 to normalization results derived by each of them. While the nonhierarchical method performed as well as the hierarchical one in the pairwise comparisons among LCLs, the former was clearly outperformed by the latter in the LCL-CLL comparison (Supplemental Fig. S12). This was natural since, in the LCL-CLL comparison, the cellular contexts being compared were more distinct from each other, in which case it can bring more improvement to account for the similarity structure among samples. We next tried deducing the linear transformation for normalizing a pair of samples (or reference profiles) based on all genomic intervals rather than common peak regions. Similarly, the advantage of the original method over the modified one was slight in the pairwise comparisons among LCLs but was considerable in the LCL-CLL comparison (Supplemental Fig. S13). When applying the modified method, we also observed consistently increased uncertainty associated with the coefficient estimates for linear transformation, suggesting ChIP-seq signals at common peak regions are of higher regularity and that focusing on these regions can make the coefficient estimates more reliable (here, the uncertainty of coefficient estimates was assessed by bootstrapping) (Supplemental Fig. S14). Finally, inspired by the principle of bias-variance tradeoff (Hastie et al. 2009), we tried two additional transformation methods for removing the M-A trend that were, respectively, more and less flexible than the original linear transformation. Specifically, the more flexible method used local polynomial regression (LOESS) to fit the M-A trend, while the less flexible one used robust linear regression (Supplemental Note S3). Overall, the original linear transformation performed better than these two methods in both the scenarios of differential ChIP-seq analysis (Supplemental Fig. S15).
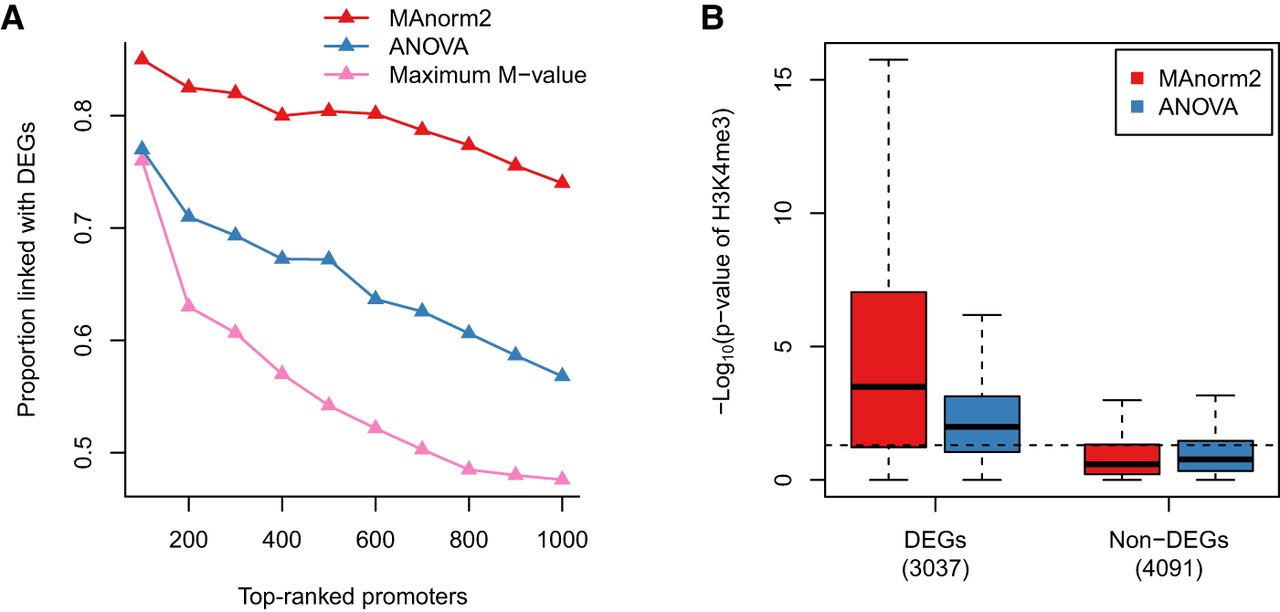
As for the statistical model part of MAnorm2, it uses a multivariate normal (MVN) distribution to model normalized log2 read counts of each interval in each group of samples. Technically, the covariance matrix of the MVN distribution is formulated as a symmetric matrix (termed structure matrix) times a scalar that quantifies the within-group variability (see Methods). Although all structure matrices involved in the study were simply identity matrices, they can be used to model the precision weights of signal measurements from different samples and the correlations among them (Smyth et al. 2005; Law et al. 2014), which, for example, may help to deal with ChIP-seq samples associated with distinct quality and/or batch effects. Another extension of the MAnorm2 model regards comparison of more than two groups of samples. Under the MVN framework, the model can be readily extended to simultaneous comparison of any number of groups (Supplemental Note S4). Here, we performed a simultaneous comparison of H3K4me3 levels among the four LCLs. We separately used the extended MAnorm2 model, one-way analysis of variance (ANOVA), and the maximum fold change between a pair of LCLs to select differential intervals. It was found that MAnorm2 provided much better rankings of promoter intervals than the other two methods (Fig. 7A). In addition, compared to ANOVA, MAnorm2 considerably increased the sensitivity for identifying differential intervals without sacrificing its specificity (Fig. 7B).
Simultaneously comparing multiple groups of ChIP-seq samples. (A) In the simultaneous comparison of H3K4me3 levels among GM12890, GM12891, GM12892, and SNYDER, the proportion of true discoveries among top-ranked promoter intervals is plotted against the number of top-ranked promoter intervals. DEGs were identified by applying the likelihood ratio test provided by DESeq2 to the corresponding four groups of RNA-seq samples, with a P-value cutoff of 0.01. (B) Box plots for the −log10 P-values assigned to promoter regions of DEGs and non-DEGs. Dotted line corresponds to a P-value of 0.05. Non-DEGs were defined as the genes with a DESeq2 P-value larger than 0.5 and a maximum fold change among the four groups less than 2.
The two parts of MAnorm2 are relatively independent of each other, and they both operate on continuous variables. These properties make it easy to incorporate existing tools into an MAnorm2 analysis for correcting for various confounding factors, including batch effects (Johnson et al. 2007; Nueda et al. 2012) and background signals measured by input samples. For all MAnorm2 analyses in the study, input samples were only used for peak calling. Here, we tried the strategy of directly subtracting input read counts from ChIP-seq read counts for each genomic interval (Ross-Innes et al. 2012). We noticed, however, clearly increased uncertainty associated with the coefficient estimates for normalization, suggesting the regularity of ChIP-seq signals had been significantly weakened even for those at occupied intervals (Supplemental Fig. S16). A primary reason was that the subtraction decreased the abundance of ChIP-seq reads and, thus, made the resulting log2 read counts more dispersed. The unreliable coefficient estimates have given rise to serious normalization biases in some cases (Supplemental Fig. S17A,B). Even in the other cases, subtracting input reads brought only a slight increase in specificity at the expense of a considerable decrease in sensitivity (Supplemental Fig. S17C,D). As a result, there were only a few cases in which subtracting input reads has led to improved true discovery proportion (Supplemental Fig. S18). Together, these observations indicated that background signals measured by input samples must be corrected for in a sophisticated manner (e.g., by first performing a normalization between ChIP-seq and input samples [Zhang et al. 2014] or integrating the correction into the following statistical procedures [Chen et al. 2015]). For future studies, we may also try revising occupancy states of genomic intervals after correcting for background signals.
Methods
All sequencing reads used in this study were aligned to the hg19 genome for consistency with existing alignment results and application of existing annotations and computational tools. However, our MAnorm2 method and the conclusions made in this paper are not specific to a genome version.
Data sets
RNA-seq and ChIP-seq data used in this study for GM12890, GM12891, GM12892, and SNYDER were obtained from Kasowski et al. (2013). RNA-seq and H3K27ac ChIP-seq data for MEC1, OSU-CLL, and CII were obtained from Ott et al. (2018). RNA-seq and Pol II ChIP-seq data for 14 LUAD cell lines (RERF-LC-Ad2, RERF-LC-KJ, LC2/ad, RERF-LC-MS, II-18, PC-9, RERF-LC-Ad1, H322, H1819, H1299, A427, H1703, A549, and H1648) were obtained from Suzuki et al. (2014). RNA-seq and ATAC-seq data for 27 LUAD and nine LUSC patients were obtained from Wang et al. (2019). RNA-seq and H3K36me3 ChIP-seq data for H1 were obtained from the ENCODE Consortium (The ENCODE Project Consortium 2012), with the accession numbers ENCFF590KVU, ENCFF929REJ, ENCFF589VNC, and ENCFF402HNS.
Accompanying input sample measuring background signals was available for each ChIP-seq sample used in this study and was obtained from the same study (ENCODE accession numbers for the H1 input samples were ENCFF422GYG and ENCFF202IDR).
Data preprocessing
Processing of all RNA-seq, ChIP-seq, and input samples started with sequencing reads. We first used Trim Galore (Martin 2011) to trim 3′ ends of reads. Resulting RNA-seq and ChIP-seq/input reads were then aligned to hg19 by STAR (Dobin et al. 2013) and Bowtie (Langmead et al. 2009), respectively. To avoid artifacts from PCR amplification, we kept for each sample at most one read or read pair at each genomic location. The remaining reads or read pairs of each RNA-seq sample were then assigned to UCSC annotated genes (Karolchik et al. 2004) by using htseq-count (Anders et al. 2015). For the ATAC-seq samples, only alignment results for hg19 (BAM-formatted files) were available. Trimming of reads and removal of duplicates had already been done for these BAM files.
We next processed the read alignments of ChIP-seq/input samples as follows. For paired-end samples, we converted each read pair into a single read whose 5′ end lay upstream of the associated DNA fragment center by 100 bp, with the center inferred as the midpoint between the two 5′ ends of the read pair. For each single-end sample for which we knew the fragment size used in DNA size selection, we shifted each read such that its 5′ end lay upstream of the associated DNA fragment center by 100 bp as well. For the ATAC-seq samples, which were all single-end, we shifted upstream each read by 100 bp. All this processing was for making the 5′ ends of all reads of different samples lie upstream of the presumed protein binding sites with a fixed distance. For clarification, all downstream analyses of these samples were based on the processed read alignments.
Peak calling
Peak calling for each ChIP-seq sample was performed against the corresponding input sample. Specifically, for each H3K36me3 ChIP-seq sample, MACS2 was applied with the parameters ‘‐‐broad ‐‐broad-cutoff=0.01 ‐‐nomodel ‐‐shift=100 ‐‐keep-dup=all’; for each other ChIP-seq sample, MACS 1.4 was applied with the parameters ‘‐‐nomodel ‐‐shiftsize=100 ‐‐keep-dup=all’ (Zhang et al. 2008). As for the ATAC-seq samples, we used MACS 1.4 with the same parameters, only that no input samples were provided.
Input matrices of MAnorm2
MAnorm2 takes a count matrix and an occupancy matrix as input. Rows and columns of both matrices correspond to a predefined list of genomic intervals and a set of ChIP-seq samples, respectively.
MAnorm2_utils has been specifically developed for constructing input matrices of MAnorm2. For each MAnorm2 analysis in the study, MAnorm2_utils was applied to read alignments and identified peaks of related samples, with the parameters ‘‐‐typical-bin-size=X ‐‐shiftsize=100 ‐‐keep-dup=all ‐‐filter=blacklist’. Here, we briefly describe how MAnorm2_utils works under the parameters (see https://github.com/tushiqi/MAnorm2_utils/tree/master/docs for a full documentation of MAnorm2_utils). First, it merges all provided peaks from different samples. It then divides up each broad merged peak into consecutive bins of X bp and leaves narrow merged peaks as they are (in the study, X was set to 1000 for ATAC-seq and Pol II ChIP-seq samples; for H3K4me3 and H3K27ac ChIP-seq samples, X was set to 2000; for H3K36me3 ChIP-seq samples, X was set to a number large enough to effectively suppress the division procedure). MAnorm2_utils next filters out the genomic intervals overlapping with blacklisted regions (Amemiya et al. 2019) and, thus, determines the final list of intervals. Finally, the count matrix is determined by shifting downstream the 5′ end of each read by 100 bp and assigning the resulting loci to the intervals, and the occupancy matrix is determined based on the overlaps between the intervals and the identified peaks.
Within-group normalization of ChIP-seq samples
To normalize a group of ChIP-seq samples, MAnorm2 selects one of them as the baseline and repeatedly normalizes each other sample against it. MAnorm2 allows users to specify the baseline sample by themselves. By default, it uses the median-ratio strategy (Anders and Huber 2010) to derive size factors of samples and selects the sample whose log2 size factor is closest to 0 as a baseline. To reduce biases, only genomic intervals that are occupied by all the samples are used to derive size factors. We next detail the procedure for normalizing a ChIP-seq sample against another.
Suppose X and Y are two vectors of log2 read counts (we used an offset of 0.5 in the study) representing raw signal intensities of two ChIP-seq samples in a list of genomic intervals. We normalize Y against X by applying a linear transformation to Y. Let Y* = α + βY be normalized signal intensities, where α and β are scalar coefficients to be determined. We define normalized M and A values by M* = Y* − X and A* = 1/2(X + Y*), respectively, and we determine the two coefficients by imposing the following two constraints:
Modeling a group of normalized ChIP-seq samples and between-group normalization
MAnorm2 models a group of normalized ChIP-seq samples by using the MVN distribution. Suppose X is an n × m matrix recording normalized signal intensities (i.e., normalized log2 read counts) in n genomic intervals for m ChIP-seq samples belonging to the same biological condition. Let Xi be the transpose of the i-th row of X. We assume
For normalizing multiple groups of ChIP-seq samples, of which each has been internally normalized, MAnorm2 first derives the reference profiles of the groups and determines the occupancy states of genomic intervals in each of them. By default, MAnorm2 treats an interval as occupied by a reference profile if it is occupied by any individual samples in the corresponding group. It then applies the procedure for within-group normalization to the reference profiles. Finally, the linear transformation derived for each nonbaseline reference profile is equally applied to each sample in the corresponding group. Note that, since the transformation applied to each group is linear, the original structure matrices remain valid for transformed signal intensities. For all MAnorm2 analyses in the study but the differential analysis of H3K36me3 ChIP-seq data, we used the default behavior to determine occupancy states of intervals in reference profiles. For the H3K36me3 ChIP-seq data set, we observed a very low between-replicate consistency in occupancy states of intervals (for the two replicates of H1, only 8.7% and 60.7% of occupied intervals were also occupied by the other; for GM12891, the proportions were 38.4% and 5.0%). We therefore treated only those intervals as occupied by H1/GM12891 that were occupied by both replicates of the cell line.
Modeling the mean-variance trend and identifying differential ChIP-seq signals between two groups of samples
We here describe how MAnorm2 compares two groups of ChIP-seq samples, assuming all related samples have been normalized to be comparable with each other.
For j = 1, 2, suppose Xj is an n × mj matrix recording normalized ChIP-seq signal intensities in n genomic intervals for mj samples belonging to condition j. Let Xi,j be the transpose of the i-th row of Xj. Note that Equations 3 and 4 are still valid once we add a subscript j to each related variable to indicate its group label. We assume the MVCs associated with the two groups of samples have the same shape and differ from each other only by a scaling factor. Formally, we define , where γj, termed variance ratio factor, parameterizes the global within-group variability of group j. Then, the complete Bayesian model that takes advantage of the mean-variance trend is given by
We then test the null hypothesis H0:μi,1 = μi,2 for each interval i by using the following key statistic:
As for parameter estimation, MAnorm2 uses an empirical Bayes approach in which f, d0, γ1, and γ2 are estimated from the data. Supplemental Note S1 includes a complete description of the parameter estimation framework as well as extensive statistical simulation for evaluating the framework. Here, we stress that, for fitting f, MAnorm2 derives an estimate of γ2/γ1 and pools the mean-variance pairs of the form or into a weighted gamma-family regression process, with (m1 − 1) and (m2 − 1) as the weights of observations from group 1 and 2, respectively.
Using size factor, TMM, and quantile normalization methods to derive normalized log2 read counts
For the size factor method, we used the estimateSizeFactors function of the DESeq2 package (Love et al. 2014; R Core Team 2018) to derive size factors of samples, which implemented the median-ratio strategy. The size factors were then used to scale raw read counts, and a log2 transformation was subsequently applied. For the TMM method, normalization factors for scaling library sizes were calculated by the calcNormFactors function of the edgeR package (Robinson et al. 2010), and the voom function of the limma package (Smyth 2004) was then used to convert raw counts into log2-count per million (log2-CPM) values. For the quantile normalization method, the normalizeBetweenArrays function of the limma package was applied to log2 raw counts.
Applying limma-trend, voom, and DESeq2 to raw read counts
For limma-trend, we first derived log2-CPM values by using the calcNormFactors and cpm functions of the edgeR package, with log = TRUE for the latter. Then, the standard pipeline of limma was applied to the log2-CPM values, with trend = TRUE for the eBayes function. For the voom method, the calcNormFactors and voom functions were sequentially called, and the standard limma pipeline was then applied to the returned object. DESeq2 was applied with its standard pipeline as recommended in the documentation.
Applying limma-trend, voom, and DESeq2 to normalized log2 read counts
For controlling for the specific normalization approach when comparing these methods with MAnorm2, we have also applied them directly to normalized log2 read counts. Suppose X is a count matrix whose rows and columns correspond to genomic intervals and ChIP-seq/ATAC-seq samples, respectively. Let xij be the element of X corresponding to interval i and sample j. Let Y = (yij) be the corresponding matrix of normalized log2 read counts. For limma-trend, the standard limma pipeline was directly applied to Y, with trend = TRUE for the eBayes function. For the voom method, the function call voom(2^Y – 0.5) with lib.size = rep(1e6 – 1, ncol(Y)) guaranteed that normalized signal intensities contained in the returned object were exactly the same as Y. The returned object was then passed to the standard limma pipeline. For DESeq2, its statistical procedures were still applied to X, only that we first designed a matrix of normalization factors, denoted by S = (sij). sij was defined as if xij > 0. If xij = 0, sij was defined as the geometric mean of those with xi′j > 0. We used the normalizationFactors function of the DESeq2 package to assign S to the core object of DESeq2, which was then passed to the standard DESeq2 pipeline.
Applying PePr, ChIPComp, and csaw to differential ChIP-seq/ATAC-seq analysis
PePr was applied to BED-formatted files recording read alignments of ChIP-seq and input samples (or ATAC-seq samples alone), with the parameters ‘-s 100 -w X ‐‐diff ‐‐peaktype=Y ‐‐normalization= inter-group’. For ATAC-seq and Pol II ChIP-seq samples, X and Y were set to 500 and sharp, respectively; for H3K4me3 and H3K27ac ChIP-seq samples, X and Y were set to 1000 and sharp; for H3K36me3 ChIP-seq samples, X and Y were set to 1000 and broad.
ChIPComp was applied to BED-formatted files recording read alignments of ChIP-seq and input samples as well as identified peaks. We first called the makeCountSet function of the ChIPComp package (Chen et al. 2015), with species = “hg19”. The returned object was then passed to the ChIPComp function with default parameters. We have not applied ChIPComp to the differential ATAC-seq analysis as it treated input samples as mandatory.
csaw was applied to BAM-formatted files recording read alignments of ChIP-seq/ATAC-seq samples. We applied csaw with recommended workflows in the chipseqDB package (Lun and Smyth 2015). A wrapper program for invoking csaw has been included in Supplemental Code. Specifically, we used the TF, narrow, and broad modes of the program for ATAC-seq/Pol II ChIP-seq samples, H3K4me3/H3K27ac ChIP-seq samples, and H3K36me3 ChIP-seq samples, respectively.
Software availability
We used MAnorm2_utils 1.0.0 and MAnorm2 1.0.0 in this study, which are provided as Python and R packages in Supplemental Code, respectively. The latest versions of MAnorm2 and MAnorm2_utils can be found at GitHub (https://github.com/tushiqi/MAnorm2_utils) and have also been uploaded to the PyPI repository (https://pypi.org/project/MAnorm2-utils). Also included in Supplemental Code is R source code for performing statistical simulation, using various methods to derive normalized log2 read counts, and applying MAnorm2, csaw, DESeq2, voom, and limma-trend to differential ChIP-seq analysis. The source code can be found at GitHub (https://github.com/tushiqi/MAnorm2/tree/master/utility/code-MAnorm2Paper) as well.
Competing interest statement
The authors declare no competing interests.
Acknowledgments
We thank Dr. Guo-Cheng Yuan and Dr. Stuart H. Orkin at the Dana Farber Cancer Institute for helpful suggestions. This work was supported by the National Basic Research Program of China (973 Program: 2018YFA0107602 and 2018YFA0800203), the National Natural Science Foundation of China (31871280 and 31701140), the “100-Talent Program” of the Chinese Academy of Science (Y516C11851 to Z.S.), and the U.S. National Institutes of Health (NIH grant DK121998 to D.J.W.).
Author contributions: S.T. and Z.S. conceived the study; S.T. and M.L. developed the algorithms; S.T. analyzed the data with help from M.L., H.C., and F.T.; Z.S. supervised the study; S.T. and Z.S. wrote the manuscript with contributions from all the other authors.
Notes
[1] Supplementary material [Supplemental material is available for this article.]
[2] Article published online before print. Article, supplemental material, and publication date are at http://www.genome.org/cgi/doi/10.1101/gr.262675.120.
References
- ↵Amemiya HM, Kundaje A, Boyle AP. 2019. The ENCODE blacklist: identification of problematic regions of the genome. Sci Rep 9: 9354. 10.1038/s41598-019-45839-z
- ↵Anders S, Huber W. 2010. Differential expression analysis for sequence count data. Genome Biol 11: R106. 10.1186/gb-2010-11-10-r106
- ↵Anders S, Pyl PT, Huber W. 2015. HTSeq—a Python framework to work with high-throughput sequencing data. Bioinformatics 31: 166–169. 10.1093/bioinformatics/btu638
- ↵Cejas P, Li L, O'Neill NK, Duarte M, Rao P, Bowden M, Zhou CW, Mendiola M, Burgos E, Feliu J, 2016. Chromatin immunoprecipitation from fixed clinical tissues reveals tumor-specific enhancer profiles. Nat Med 22: 685–691. 10.1038/nm.4085
- ↵Chen L, Wang C, Qin ZS, Wu H. 2015. A novel statistical method for quantitative comparison of multiple ChIP-seq datasets. Bioinformatics 31: 1889–1896. 10.1093/bioinformatics/btv094
- ↵Dobin A, Davis CA, Schlesinger F, Drenkow J, Zaleski C, Jha S, Batut P, Chaisson M, Gingeras TR. 2013. STAR: ultrafast universal RNA-seq aligner. Bioinformatics 29: 15–21. 10.1093/bioinformatics/bts635
- ↵The ENCODE Project Consortium. 2012. An integrated encyclopedia of DNA elements in the human genome. Nature 489: 57–74. 10.1038/nature11247
- ↵Ernst J, Kheradpour P, Mikkelsen TS, Shoresh N, Ward LD, Epstein CB, Zhang X, Wang L, Issner R, Coyne M, 2011. Mapping and analysis of chromatin state dynamics in nine human cell types. Nature 473: 43–49. 10.1038/nature09906
- ↵Gifford CA, Ziller MJ, Gu H, Trapnell C, Donaghey J, Tsankov A, Shalek AK, Kelley DR, Shishkin AA, Issner R, 2013. Transcriptional and epigenetic dynamics during specification of human embryonic stem cells. Cell 153: 1149–1163. 10.1016/j.cell.2013.04.037
- ↵Grubert F, Zaugg JB, Kasowski M, Ursu O, Spacek DV, Martin AR, Greenside P, Srivas R, Phanstiel DH, Pekowska A, 2015. Genetic control of chromatin states in humans involves local and distal chromosomal interactions. Cell 162: 1051–1065. 10.1016/j.cell.2015.07.048
- ↵Hastie T, Tibshirani R, Friedman J. 2009. The elements of statistical learning: data mining, inference, and prediction, 2nd ed. Springer Science & Business Media, New York.
- ↵Heinz S, Romanoski CE, Benner C, Glass CK. 2015. The selection and function of cell type-specific enhancers. Nat Rev Mol Cell Biol 16: 144–154. 10.1038/nrm3949
- ↵Johnson WE, Li C, Rabinovic A. 2007. Adjusting batch effects in microarray expression data using empirical Bayes methods. Biostatistics 8: 118–127. 10.1093/biostatistics/kxj037
- ↵Karolchik D, Hinrichs AS, Furey TS, Roskin KM, Sugnet CW, Haussler D, Kent WJ. 2004. The UCSC Table Browser data retrieval tool. Nucleic Acids Res 32(Database issue): D493–D496. 10.1093/nar/gkh103
- ↵Kasowski M, Kyriazopoulou-Panagiotopoulou S, Grubert F, Zaugg JB, Kundaje A, Liu Y, Boyle AP, Zhang QC, Zakharia F, Spacek DV, 2013. Extensive variation in chromatin states across humans. Science 342: 750–752. 10.1126/science.1242510
- ↵Koues OI, Kowalewski RA, Chang LW, Pyfrom SC, Schmidt JA, Luo H, Sandoval LE, Hughes TB, Bednarski JJ, Cashen AF, 2015. Enhancer sequence variants and transcription-factor deregulation synergize to construct pathogenic regulatory circuits in B-cell lymphoma. Immunity 42: 186–198. 10.1016/j.immuni.2014.12.021
- ↵Langmead B, Trapnell C, Pop M, Salzberg SL. 2009. Ultrafast and memory-efficient alignment of short DNA sequences to the human genome. Genome Biol 10: R25. 10.1186/gb-2009-10-3-r25
- ↵Lara-Astiaso D, Weiner A, Lorenzo-Vivas E, Zaretsky I, Jaitin DA, David E, Keren-Shaul H, Mildner A, Winter D, Jung S, 2014. Chromatin state dynamics during blood formation. Science 345: 943–949. 10.1126/science.1256271
- ↵Law CW, Chen Y, Shi W, Smyth GK. 2014. voom: precision weights unlock linear model analysis tools for RNA-seq read counts. Genome Biol 15: R29. 10.1186/gb-2014-15-2-r29
- ↵Leung D, Jung I, Rajagopal N, Schmitt A, Selvaraj S, Lee AY, Yen CA, Lin S, Lin Y, Qiu Y, 2015. Integrative analysis of haplotype-resolved epigenomes across human tissues. Nature 518: 350–354. 10.1038/nature14217
- ↵Love MI, Huber W, Anders S. 2014. Moderated estimation of fold change and dispersion for RNA-seq data with DESeq2. Genome Biol 15: 550. 10.1186/s13059-014-0550-8
- ↵Lun AT, Smyth GK. 2015. From reads to regions: a bioconductor workflow to detect differential binding in ChIP-seq data. F1000Res 4: 1080. 10.12688/f1000research.7016.1
- ↵Lun AT, Smyth GK. 2016. csaw: a bioconductor package for differential binding analysis of ChIP-seq data using sliding windows. Nucleic Acids Res 44: e45. 10.1093/nar/gkv1191
- ↵Mardis ER. 2007. ChIP-seq: welcome to the new frontier. Nat Methods 4: 613–614. 10.1038/nmeth0807-613
- ↵Martin M. 2011. Cutadapt removes adapter sequences from high-throughput sequencing reads. EMBnet journal 17: 10–12. 10.14806/ej.17.1.200
- ↵Meyer CA, Liu XS. 2014. Identifying and mitigating bias in next-generation sequencing methods for chromatin biology. Nat Rev Genet 15: 709–721. 10.1038/nrg3788
- ↵Nakato R, Shirahige K. 2017. Recent advances in ChIP-seq analysis: from quality management to whole-genome annotation. Brief Bioinformatics 18: 279–290. 10.1093/bib/bbw023
- ↵Nueda MJ, Ferrer A, Conesa A. 2012. ARSyn: a method for the identification and removal of systematic noise in multifactorial time course microarray experiments. Biostatistics 13: 553–566. 10.1093/biostatistics/kxr042
- ↵Ott CJ, Federation AJ, Schwartz LS, Kasar S, Klitgaard JL, Lenci R, Li Q, Lawlor M, Fernandes SM, Souza A, 2018. Enhancer architecture and essential core regulatory circuitry of chronic lymphocytic leukemia. Cancer Cell 34: 982–995.e7. 10.1016/j.ccell.2018.11.001
- ↵Park PJ. 2009. ChIP-seq: advantages and challenges of a maturing technology. Nat Rev Genet 10: 669–680. 10.1038/nrg2641
- ↵R Core Team. 2018. R: a language and environment for statistical computing. R Foundation for Statistical Computing, Vienna. https://www.R-project.org/.
- ↵Roadmap Epigenomics Consortium, Kundaje A, Meuleman W, Ernst J, Bilenky M, Yen A, Heravi-Moussavi A, Kheradpour P, Zhang Z, Wang J, 2015. Integrative analysis of 111 reference human epigenomes. Nature 518: 317–330. 10.1038/nature14248
- ↵Robinson MD, Oshlack A. 2010. A scaling normalization method for differential expression analysis of RNA-seq data. Genome Biol 11: R25. 10.1186/gb-2010-11-3-r25
- ↵Robinson MD, McCarthy DJ, Smyth GK. 2010. edgeR: a bioconductor package for differential expression analysis of digital gene expression data. Bioinformatics 26: 139–140. 10.1093/bioinformatics/btp616
- ↵Ross-Innes CS, Stark R, Teschendorff AE, Holmes KA, Ali HR, Dunning MJ, Brown GD, Gojis O, Ellis IO, Green AR, 2012. Differential oestrogen receptor binding is associated with clinical outcome in breast cancer. Nature 481: 389–393. 10.1038/nature10730
- ↵Sartor MA, Tomlinson CR, Wesselkamper SC, Sivaganesan S, Leikauf GD, Medvedovic M. 2006. Intensity-based hierarchical Bayes method improves testing for differentially expressed genes in microarray experiments. BMC Bioinformatics 7: 538. 10.1186/1471-2105-7-538
- ↵Shao Z, Zhang Y, Yuan GC, Orkin SH, Waxman DJ. 2012. MAnorm: a robust model for quantitative comparison of ChIP-Seq data sets. Genome Biol 13: R16. 10.1186/gb-2012-13-3-r16
- ↵Smyth GK. 2004. Linear models and empirical Bayes methods for assessing differential expression in microarray experiments. Stat Appl Genet Mol Biol 3: Article3. 10.2202/1544-6115.1027
- ↵Smyth GK, Michaud J, Scott HS. 2005. Use of within-array replicate spots for assessing differential expression in microarray experiments. Bioinformatics 21: 2067–2075. 10.1093/bioinformatics/bti270
- ↵Steinhauser S, Kurzawa N, Eils R, Herrmann C. 2016. A comprehensive comparison of tools for differential ChIP-seq analysis. Brief Bioinformatics 17: 953–966. 10.1093/bib/bbv110
- ↵Suzuki A, Makinoshima H, Wakaguri H, Esumi H, Sugano S, Kohno T, Tsuchihara K, Suzuki Y. 2014. Aberrant transcriptional regulations in cancers: genome, transcriptome and epigenome analysis of lung adenocarcinoma cell lines. Nucleic Acids Res 42: 13557–13572. 10.1093/nar/gku885
- ↵Ter Huurne M, Chappell J, Dalton S, Stunnenberg HG. 2017. Distinct cell-cycle control in two different states of mouse pluripotency. Cell Stem Cell 21: 449–455.e4. 10.1016/j.stem.2017.09.004
- ↵Tu S, Shao Z. 2017. An introduction to computational tools for differential binding analysis with ChIP-seq data. Quantitative Biology 5: 226–235. 10.1007/s40484-017-0111-8
- ↵Wang Z, Tu K, Xia L, Luo K, Luo W, Tang J, Lu K, Hu X, He Y, Qiao W, 2019. The open chromatin landscape of non-small cell lung carcinoma. Cancer Res 79: 4840–4854. 10.1158/0008-5472.CAN-18-3663
- ↵Waszak SM, Delaneau O, Gschwind AR, Kilpinen H, Raghav SK, Witwicki RM, Orioli A, Wiederkehr M, Panousis NI, Yurovsky A, 2015. Population variation and genetic control of modular chromatin architecture in humans. Cell 162: 1039–1050. 10.1016/j.cell.2015.08.001
- ↵Xu J, Shao Z, Glass K, Bauer DE, Pinello L, Van Handel B, Hou S, Stamatoyannopoulos JA, Mikkola HK, Yuan GC, 2012. Combinatorial assembly of developmental stage-specific enhancers controls gene expression programs during human erythropoiesis. Dev Cell 23: 796–811. 10.1016/j.devcel.2012.09.003
- ↵Yi G, Wierenga ATJ, Petraglia F, Narang P, Janssen-Megens EM, Mandoli A, Merkel A, Berentsen K, Kim B, Matarese F, 2019. Chromatin-based classification of genetically heterogeneous AMLs into two distinct subtypes with diverse stemness phenotypes. Cell Rep 26: 1059–1069.e6. 10.1016/j.celrep.2018.12.098
- ↵Zhang Y, Liu T, Meyer CA, Eeckhoute J, Johnson DS, Bernstein BE, Nusbaum C, Myers RM, Brown M, Li W, 2008. Model-based Analysis of ChIP-Seq (MACS). Genome Biol 9: R137. 10.1186/gb-2008-9-9-r137
- ↵Zhang Y, Lin YH, Johnson TD, Rozek LS, Sartor MA. 2014. PePr: a peak-calling prioritization pipeline to identify consistent or differential peaks from replicated ChIP-Seq data. Bioinformatics 30: 2568–2575. 10.1093/bioinformatics/btu372