
Benchmark and integration of resources for the estimation of human transcription factor activities
- Luz Garcia-Alonso1,2,
- Christian H. Holland3,4,
- Mahmoud M. Ibrahim3,5,
- Denes Turei3,4 and
- Julio Saez-Rodriguez1,2,3,4
- 1European Molecular Biology Laboratory–European Bioinformatics Institute (EMBL-EBI), Wellcome Genome Campus, CB10 1SD Cambridge, United Kingdom;
- 2Open Targets, Wellcome Genome Campus, CB10 1SD Cambridge, United Kingdom;
- 3Joint Research Centre for Computational Biomedicine (JRC-COMBINE), RWTH Aachen University, Faculty of Medicine, 52074 Aachen, Germany;
- 4Institute of Computational Biomedicine, Heidelberg University, Faculty of Medicine, 69120 Heidelberg, Germany;
- 5Department of Nephrology, RWTH Aachen University, Faculty of Medicine, 52074 Aachen, Germany
Abstract
The prediction of transcription factor (TF) activities from the gene expression of their targets (i.e., TF regulon) is becoming a widely used approach to characterize the functional status of transcriptional regulatory circuits. Several strategies and data sets have been proposed to link the target genes likely regulated by a TF, each one providing a different level of evidence. The most established ones are (1) manually curated repositories, (2) interactions derived from ChIP-seq binding data, (3) in silico prediction of TF binding on gene promoters, and (4) reverse-engineered regulons from large gene expression data sets. However, it is not known how these different sources of regulons affect the TF activity estimations and, thereby, downstream analysis and interpretation. Here we compared the accuracy and biases of these strategies to define human TF regulons by means of their ability to predict changes in TF activities in three reference benchmark data sets. We assembled a collection of TF–target interactions for 1541 human TFs and evaluated how different molecular and regulatory properties of the TFs, such as the DNA-binding domain, specificities, or mode of interaction with the chromatin, affect the predictions of TF activity. We assessed their coverage and found little overlap on the regulons derived from each strategy and better performance by literature-curated information followed by ChIP-seq data. We provide an integrated resource of all TF–target interactions derived through these strategies, with confidence scores, as a resource for enhanced prediction of TF activities.
The regulation of gene expression programs is fundamental for cell development, differentiation, and tissue homeostasis. Dysregulation of such programs is responsible for most aberrant cell phenotypes, including cancer and other complex diseases. Because of their ability to interact with specific DNA regulatory regions, transcription factors (TFs) are key proteins in linking signaling transduction networks to gene-specific transcriptional regulation. Consequently, TFs have been proposed as downstream readouts of pathway activities, and the assessment of their activity status has gained much attention in the last years. Noteworthy examples are their use in the characterization of driver somatic mutations, the identification of new markers of drug response in cancer (Alvarez et al. 2016; Gonzalez-Perez 2016; Osmanbeyoglu et al. 2017; Garcia-Alonso et al. 2018), and the reconstruction of the regulatory processes dictating cell differentiation (Carro et al. 2010; Schacht et al. 2014; van de Peppel et al. 2017).
Because high-throughput measurements of TF activities are not available, a common practice is to estimate them computationally from the gene expression levels of their direct targets (the so-called TF regulon). Multiple in silico methods exist to infer TF activity, with limited overlap in the results (Trescher et al. 2017). The general assumption behind those methods is that the level of protein activity of a TF is reflected on the transcript levels of its target genes (Essaghir et al. 2010). Accurate TF activity quantifications will, therefore, depend on the availability of high-confidence sets of functional targets, in which the TF has a direct regulatory effect on the transcription of the target gene, and the specificity of the TF–target interaction, so that the regulation of the target's transcription can be unambiguously assigned to the TF. Moreover, if the TF activity quantification approach is intended to be generally applicable to any cell type, context-independent TF–target interactions are preferred so that the predictions are consistent and comparable across cell types (Ding et al. 2018; Garcia-Alonso et al. 2018). This context-independence is key for systematic studies using heterogeneous populations of cell types, such as cell line panels spanning different tumor types or differentiation stages.
Several strategies and resources have been proposed to define the set of target genes directly regulated by a TF. These can be grouped according to the strength of evidence supporting a TF–target interaction. The first types are resources collecting manually curated interactions from peer-reviewed literature. Literature-curated resources are expected to contain high-quality TF–target regulatory interactions with experimental evidence. To our knowledge, there are around a dozen literature-curated databases collecting interactions for humans (Kolchanov et al. 2002; Jiang et al. 2007; Portales-Casamar et al. 2009; Essaghir et al. 2010; Gronostajski et al. 2011; Kawaji et al. 2011; Bovolenta et al. 2012; Kanehisa et al. 2012; Yusuf et al. 2012; Orchard et al. 2014; Lesurf et al. 2016; Han et al. 2018). However, these databases differ in their curation protocols, literature selection criteria, and quality controls (Tripathi et al. 2016). Consequently, there is a small overlap between resources, which generates uncertainty about which ones should be used (Han et al. 2018). In addition, literature-curated resources have a biased coverage toward well-studied TFs, in particular those involved in diseases. Another strategy is high-throughput measurements of TF-DNA binding such as chromatin immunoprecipitation (ChIP) (Johnson et al. 2007; Lachmann et al. 2010) or DNase I hypersensitivity (DNase) (Crawford et al. 2006) assays coupled to DNA sequencing (ChIP-seq or DNase-seq). These provide high-resolution maps of in vivo DNA-binding regions. Still, most binding events represent nonfunctional interactions, meaning that TF binding does not always correspond with changes in the expression levels of the targeted gene (Li et al. 2008; Fisher et al. 2012). As for the literature-curated resources, TF binding peaks derived through these in vivo methodologies are relative to the experimental conditions and cell types used and are biased toward well-studied TFs. To overcome part of the limitations inherent to the mentioned experimental conditions, a third strategy is to computationally predict TF–target interactions using models of TF binding sites (TFBSs). In silico identification of TFBSs on gene regulatory regions relies on the assumption that TFs have binding preferences to specific DNA sequences, referred to as “binding motifs” (Stormo 2000; Khan et al. 2018; Kulakovskiy et al. 2018). TF binding motifs, generally modeled as position weight matrices (PWMs), are then used to scan the regulatory sequences in a genome to identify candidate target genes (Sinha 2006). Consequently, predictions are restricted to TFs for which binding motifs are known. Additionally, these methods suffer from a significant number of false positives because the binding never occurs in vivo or is nonfunctional, or because of the uncertainty in which site is regulating which gene. Finally, TF–target interactions can also be reverse-engineered in silico from large-scale gene expression profiles derived from a condition of interest (Rice et al. 2005; Margolin et al. 2006). The assumption is that the transcript levels of a TF are informative for the expression levels of their targeted genes. This approach overcomes several limitations of the previous TFBS prediction method such as the cell type specificities (i.e., predictions are tailored toward the underlying expression profile) and the TF coverage (i.e., regulons can be inferred for any TF whose expression varies sufficiently in the corresponding gene expression data set). Still, the approach may fail to infer TF–target interactions for TFs regulated at a molecular level other than transcription (such as posttranslational modification and protein–protein interactions) (Tootle and Rebay 2005), and their power to distinguish direct and indirect regulation is controversial (Margolin and Califano 2007; Marbach et al. 2010, 2012). Taken together, currently there is no universal strategy to identify all bona fide targets of the full collection of TFs across all possible cell conditions.
Despite their broad use, there is no systematic evaluation of the impact of the evidence supporting the TF–target interactions on the estimation of TF activities. However, the evidence used can substantially affect the results and, thereby, downstream analysis and interpretation. To address this problem, we performed a comprehensive evaluation. First, we retrieved human TF–target interactions for 1541 TFs using the most established strategies: (1) literature-curated resources, (2) ChIP-seq binding data, (3) TFBS predictions on human promoters, and (4) reverse-engineered regulons inferred from normal tissue gene expression profiles from the Genotype-Tissue Expression (GTEx) (Carithers et al. 2015) project (hereafter inferred regulons). We then evaluated to what extent the evidence supporting the TF–target interactions affects TF activity estimations in three different benchmark data sets: two involving gene expression measurements after TF perturbations and one derived from cell-specific essentiality profiles in cancer cell lines. We also investigated the limitations and benefits of the different TF–target data sets and how these relate to several TF properties such as the mode of regulation (MoR) or regulatory effects on their targets, the mode of interaction with the chromatin, the DNA-binding domains, and specificity, dimerization, or tissue of expression. Finally, we provide general guidelines for the quantification of TF activities across heterogeneous populations of samples together with the retrieved TF regulons as a resource for the community.
Results
TF–target data sets description and overview
First, we retrieved putative direct transcriptional targets for 1541 human TFs, as defined by TFClass (Supplemental Table S1; Wingender et al. 2013), using different strategies that we grouped according to the evidence type: (1) literature-curated collections from publicly available databases (Kolchanov et al. 2002; Jiang et al. 2007; Portales-Casamar et al. 2009; Essaghir et al. 2010; Gronostajski et al. 2011; Kawaji et al. 2011; Bovolenta et al. 2012; Kanehisa et al. 2012; Yusuf et al. 2012; Orchard et al. 2014; Lesurf et al. 2016; Han et al. 2018), (2) ChIP-seq interactions from ReMap (Chèneby et al. 2018), (3) TFBS predictions on gene promoters using TF binding motifs from HOCOMOCO (Kulakovskiy et al. 2018) and JASPAR (Khan et al. 2018), and (4) transcriptional regulatory interactions across normal human GTEx tissues (Carithers et al. 2015) and The Cancer Genome Atlas (TCGA) cancer types inferred from expression data (Alvarez et al. 2016) using ARACNE (Fig. 1A; Margolin et al. 2006). From the literature-curated resources, we directly retrieved all the TF–target interactions as indicated in the corresponding databases. For ChIP-seq, we downloaded the binding peaks from ReMap and scored the interactions between each TF and each gene according to the distance between the TFBSs and the genes’ transcription start sites. We evaluated different filtering strategies that consisted of selecting only the top-scoring 100, 200, 500, and 1000 target genes for each TF. For TF binding predictions on promoters, we used the FIMO scanning tool (Grant et al. 2011) with TF motifs from HOCOMOCO and JASPAR, identifying 16 and 13 million binding events (P-value < 0.0001), respectively. Again, we studied different filtering strategies to select the top 100, 200, 500, or 1000 unique hits and filter these according to the conservation of the promoter binding sequence or chromatin accessibility annotations from Ensembl. Finally, for the inference of transcriptional interactions, we ran ARACNE and VIPER on each GTEx tissue independently to build tissue-specific regulatory networks. Similarity between tissue-specific regulons was generally low (Supplemental Fig. S1A). Cancer-specific inferred networks were directly downloaded from the aracne.networks R package (https://bioconductor.org/packages/release/data/experiment/html/aracne.networks.html). Interactions identified in at least two, three, five, or 10 tissues or cancer types were aggregated to derive normal and cancer consensus-inferred TF regulons, respectively. Normal consensus regulons were larger than pancancer consensus regulons owing to the larger number of tissues considered (27 from GTEx versus 14 cancer types from TCGA aracne.networks) (Supplemental Fig. S2). See the Methods section for more details.
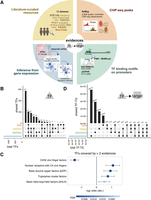
TF–target resources overview. (A) Summary of the resources and strategies used to derive human TF–target interactions classified according to the evidence level: manually curated resources (yellow), ChIP-seq binding experimental data (orange), prediction of TF binding motifs based on gene promoter sequences (green), or inference from GTEx data (blue). All the resources were used in the benchmark, except NFIRegulomeDB, which has too low coverage. (B) TF coverage and overlaps across the different evidence classes, represented via UpSet plots (Lex and Gehlenborg 2014). Left bar plot represents the total number of TF per evidence class. Top bar plot represents the number of overlapping TFs in the intersection. Dark circles in the matrix indicate the evidence class that is part of the intersection. (C) TF classes (from TFClass) enriched in the TFs covered by more than two lines of evidence. Dots indicate the log odds ratio; error bars, the confidence interval. Colors indicate the FDR. (D) UpSet plot representing the TF–target's coverage and overlaps across the different evidence classes (similar as in B). Note that for regulons inferred from GTEx, only TF–targets or three or more tissues are shown. For TFBSs and ChIP-seq, only top 500 unique hits are shown; P < 0.0001.
Collectively, our data set contains 1.5 million interactions between 1399 TFs and 27,976 target genes (Supplemental Table S2). For 101 TFs (6.7%), we retrieved no targets using the mentioned strategies. Comparison of the TFs covered per evidence type (Fig. 1B) revealed that 638 TFs (42.4%) were covered by a single strategy, with most of these single-evidence TFs reported by transcriptionally inferred regulons alone (578 TFs, 38.4%). On the opposite side, for 462 TFs (30.7%), we were able to identify targets via three or more lines of evidence. Overlap between curated resources was highly variable, with 26% of the TFs being covered by the TRRUST database alone (Supplemental Fig. S3A).
Enrichment analysis revealed that the TFs covered by at least three strategies were expressed across the majority of human tissues (>90% GTEx tissues; Fisher's exact test, FDR = 1.77 × 10⁻⁶) (Supplemental Fig. S4A) and enriched in Cancer Pathways (KEGG; Fisher's exact test, FDR = 2.41 × 10⁻¹⁸) (Supplemental Fig. S4B). Moreover, these TFs were enriched in well-known DNA-binding domain families such as (1) basic helix–loop–helix factors (bHLHs), including MYC and E2F TF families; (2) basic leucine zipper factors (bZIP), including JUN-, FOS-, and ATF-related AP1 TFs; (3) nuclear receptors with C4 zinc fingers; and (4) tryptophan cluster factors (Fisher's exact test, FDR < 0.05). Conversely, C2H2 zinc finger factors were underrepresented (Fig. 1C) and only covered by the GTEx-inferred regulons (Fisher's exact test, FDR = 1.91 × 10⁻¹²) (Supplemental Fig. S4C). When we zoomed into the different evidence types, manually curated, ChIP-seq, and also interactions predicted from TFBS models suffer from the same bias toward disease-related pathways and prominent TFs.
We subsequently compared the TF–targets covered across the different strategies (Fig. 1D). The majority of TF–target interactions (96.3%) were supported by a single line of evidence (51.7%, in which the evidence was a computational prediction); 37,220 (3.4%) are supported by two, 1933 (0.2%) by three, and only 56 by all four lines of evidence. The same sparsity at the TF–target level is observed between curated resources, where, again, most of the interactions are reported by a single resource (Supplemental Fig. S3B).
TF–target data sets’ benchmark
Next, we attempted to evaluate the strategies to define TF–target regulons according to their ability to predict changes in TF activities. We reasoned that if the set of targets retrieved for a TF is reliable (i.e., their expression is directly regulated by the TF), the collective expression level of the regulon should be informative of the transcriptional activity of the TF. To determine whether a TF–target data set provides accurate TF regulons for activity inference, we evaluated the changes in TF activities in three benchmark data sets. First, we manually curated gene expression experiments from the Gene Expression Omnibus (GEO), including TF knockouts, TF overexpression, or TF modulation using a targeted compound. We argued that these experiments are expected to lead to the perturbation of TF activities and, therefore, could be used as benchmark data sets. In total, we collected 189 low-throughput (benchmark data set B1) and two high-throughput (benchmark data set B2) perturbation experiments (Fig. 2A). Because perturbation experiments are likely to be biased toward well-studied TFs, which may have been thoroughly evaluated in the curated resources, we decided to include a third benchmark data set (which we called B3) in which the positive controls are defined in a data-driven way from a genome-wide analysis. Specifically, for B3 we used two recently published high-throughput gene essentiality screens in cancer cell lines (for which basal gene expression data is available) (McDonald et al. 2017; Tsherniak et al. 2017) to identify putatively active TFs. The benchmarks covered 222 unique TFs, with 94, 33, and 135 TFs in B1, B2, and B3, respectively. Thirty-two of these TFs are covered by two benchmarks and only six by all three benchmarks (Supplemental Fig. S5). No TF is covered by all the benchmark and all the regulon data sets.
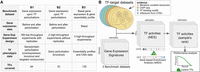
Benchmark data sets. (A) Description of the three benchmark data sets. (B) Benchmark analysis scheme.
With the data in hand, the first step in our benchmark strategy (Fig. 2B) consisted of estimating TF regulon activities from the gene expression signatures (i.e., expression-level statistic). These gene expression signatures are derived differently across the benchmark data sets because of their differences in the experimental design. For the B1 data set, because it contains replicates for control and perturbed samples (knockout, overexpression, etc.), we defined the gene expression signature of the perturbation as the differential expression between the positive (with expected higher TF activity) and the negative samples (with expected lower TF activity). In contrast, the B2 data set does not contain perturbation replicates. Here, we normalized the gene expression profiles using z-score transformation to derive the expression-level statistic, which quantifies whether a gene in a sample is more or less expressed in the context of the B2 population distribution. B3 does not contain perturbation data, only basal gene expression from unperturbed samples. Here, the gene expression signatures are derived as for B2. With the gene expression signatures in hand, our second step applied the analytic rank-based enrichment analysis (aREA) method to infer the TF regulon normalized enrichment scores (NESs) that we used as estimates of TF activities. Finally, NES values were used to rank, for each TF regulon, the experiments or samples within each benchmark data set. The estimated TF activities were then evaluated against our benchmarks using a precision-recall analysis (see Methods); we compared the ranked TF activities estimated for our positive samples (i.e., the perturbed TF–sample pairs in B1 and B2 and the essential TF–sample pairs in B3) against the negative samples (i.e., samples with a different perturbed TF in B1 and B2 and the inactive TF–sample pairs in B3) and quantified the AUPRC and AUROC for each TF–target data set.
The predicted TF activities derived from most of the resources performed better than random (AUPRC > 0.5, AUROC > 0.5) (Fig. 3A; Supplemental Figs. S6, S7). Overall, there is an inverse relationship between the coverage and the accuracy across regulon data sets (Fig. 3A). TF regulons manually reviewed by experts, such as those listed in TF-centric review papers or in the TFe resource, reached the highest accuracy levels. In contrast, TF regulons determined in silico from TF binding motifs or inferred from data reached higher TFs coverage but lower accuracy. ChIP-seq–derived regulons display intermediate performances and coverage. Better accuracy for curated and ChIP-seq regulons was also observed on the overlapping TFs covered by all four types of evidences (Fig. 3B).
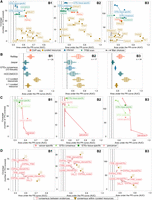
Comparison of TF activity prediction performances by TF–target resource for each benchmark data set. (A) Performance comparison of the regulon data sets, in terms of TF activity prediction, against the three benchmark data sets. Confidence versus coverage plots in which the x-axis represents the average AUPRC from the activity rank's position of the perturbed/essential TF with respect to the negative controls; y-axis represents the number of TFs (with five or more targets) in the benchmark covered by each regulon data set. Dot colors indicate the evidence type (single data sets/evidence). Linked dots represent different filtering strategies in the generation of transcriptionally inferred and TFBS-derived regulons. (B) Performance comparison of the regulon data sets on the overlapping TFs. The x-axis indicates the AUPRC from the activity rank's position of the perturbed/essential TF against the same number of randomly selected negatives; y-axis represents the regulon data set. The number of overlapping TFs is indicated at the top right corner. (C) Similar to A but comparing GTEx-inferred (green) versus TCGA-inferred (red) regulons. Results for both tissue/cancer-specific (dark color) and the respective normal and pancancer consensus regulons (light) are shown. (D) Similar to A but here the regulons are built as a combination of the initial regulon data sets (i.e., TF–target supported by an agreement of two (or three) of any of the four mentioned strategies). Dot colors indicate the nature of the combination (combined evidence). The label accompanying the “consensus within curated resources” dots indicates the number of resources supporting the TF–target interaction.
We observed a high variability for most of the curated resources that cover few TFs, such as Fantom4, ORegAnno, PAZAR, or TFact (Supplemental Fig. S6, S7). PAZAR seems to be a special case (Supplemental Fig. S3) because it is the largest curated resource in terms of number of interactions (n = 174,439) but not in terms of number of TFs covered (n = 77). Looking at the regulon sizes, PAZAR is the only database containing regulons with more than 1000 targets (n = 24). This is likely because of the way PAZAR incorporates TF–target interactions, with some of them extracted from binding experiments. In contrast, the performance of TRRUST, the resource with the highest TF coverage, is robust across all three benchmark data sets. Finally, TF–target interactions manually curated by experts in TFe or in specific reviews consistently displayed the highest performances.
We also explored how the use of different filters and/or parameters in the generation of the ChIP-seq and in silico data sets would impact their performance. Comparisons across the three different benchmarks revealed distinct performances (for AUPRC and AUROC, see, respectively, Supplemental Figs. S6, S7). We reasoned that these divergences may likely be owing to either the different cell models and conditions used or to the differences in number and type of TFs covered in each experiment. Still, we observed a global tendency when comparing some filtering features. For example, for the regulons inferred from ChIP-seq and TF promoter binding, we evaluated different size cutoffs (top 100, 200, 500, and 1000 targets) and observed that intermediate cutoffs reached higher AUC values overall (Supplemental Figs. S6A,B, S7A,B). The use of chromatin accessibility information to further filter TF binding hits on promoters decreased their performance, whereas the inclusion of sequence-based conservation reached similar or better performances (Supplemental Figs. S6C, S7C). TF binding motifs from HOCOMOCO performed generally better than the ones from JASPAR, considering only TFs covered by both resources (Supplemental Figs. S6B,C, S7B,C), likely because the former is based on human experiments whereas the latter also includes data from other vertebrates. Regarding the TF regulons inferred from GTEx transcriptomics data, tissue-specific regulons (i.e., derived from the GTEx tissue matching the tissue lineage of the perturbed samples) performed similarly to tissue-consensus regulons (i.e., interactions detected in more than one GTEx tissue), where the performance increased for consensus TF–target interactions observed in more GTEx tissues (Supplemental Figs. S6D, S7D). No relationship was observed between the number of samples per tissue type used to infer the tissue-specific regulons and the accuracy of the benchmarking (Supplemental Fig. S8).
Because some of the samples used in the benchmark are cancer cell lines, we asked whether networks inferred from TCGA rather than GTEx normal gene expression data could improve the performance of this type of regulon. For this purpose, we downloaded 14 cancer-type-specific networks constructed with ARACNE from Alvarez et al. (2016) and tested these cancer specific regulons against our benchmark data sets. Our results suggest a slightly better performance of the TCGA regulons for the B1 and B3 (Fig. 3C). Cancer-specific networks covered fewer TFs from the benchmarks, either because the samples used in the benchmark are noncancerous (such as the case of B1) or because the cancer type is not covered in the TCGA. When the comparison is restricted to the overlapping TFs (five overlapping TFs in B1 and B3; results for B2 not shown because of the lack of data) (Supplemental Fig. S9), the consensus pancancer regulons including TF–target interactions found in at least five cancer types performed better than the corresponding GTEx in both B1 and B3. However, when we used regulatory networks matching either the underlying normal tissue (GTEx) or cancerous tissue (TCGA), we observed opposite results: Whereas in B3 cancer-type-specific regulons performed better than the normal ones, the opposite was observed in B1. We hypothesize that the differences may arise from the different cancer types and TFs included in B1 and B3.
We also asked whether the inclusion of the MoR provided for some TF–target interactions in some literature-curated databases had an impact on the prediction of the TF activities. The comparison of signed and unsigned versions of the same regulons revealed similar performances, with the exception of TRRUST database (Supplemental Figs. S6E, S7E). The signed version of TRRUST regulons significantly improved the TF activity predictions (Wilcoxon test; P < 0.05) for all three benchmark data sets.
Finally, we selected the TF–target interactions supported by more than one line of evidence and recomputed the activities for the resulting TF regulons across the benchmark data sets (Fig. 3D). Globally, regulons containing TF–targets supported by at least two literature-curated resources displayed the best performances across the three benchmark data sets. In contrast, regulons built by intersecting in silico predictions performed poorly, with no improvement compared with the use of regulons uniquely derived from each single strategy alone. Interactions supported by at least one literature-curated resource and ChIP-seq, or supported by any three lines of evidence, showed an intermediate performance.
TF properties affecting inference of regulon activities
Not all of the TFs function in the same way nor are they regulated by the same mechanisms. TFs may differ in their MoR, the way in which they interact with the chromatin, the conditions upon which they are expressed, the regulation by posttranslational modification, or the interaction with cofactors. To characterize if any of these properties affect the power to infer accurate TF activities, we annotated, when possible, our list of human TFs according to their global regulatory effect on the targets (i.e., activators, repressors, or dual) in UniProt (The UniProt Consortium 2017), whether these operate as complexes (i.e., heteromers or homomers) according to UniProt or the method of Lambert et al. (2018), the DNA-binding specificity (Lambert et al. 2018), the mode of interaction with the chromatin (pioneers, settlers, and migrants) (Ehsani et al. 2016), and their classification based on their DNA-binding domains from TFClass (Fig. 4A). Additionally, we classified the TFs as tissue-specific or widely expressed if their transcripts were detected in <10% or >90% of the tissues in GTEx (for details, see Methods) (Supplemental Table S1).
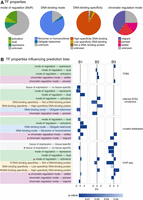
TF properties biasing the inference of TF activities across the TF regulon data sets. (A) Overview of the TF properties annotated for the 1541 human TFs under study. (B) TF properties enriched (FDR < 0.01) in the benchmark results B1, B2, and B3. Bar length is proportional to the enrichment score (ES), whereas color represents the significance strength (P-value). Properties enriched in more than one benchmark data set are labeled with an asterisk.
To evaluate any potential bias in the accuracy of TF activity estimations in each regulon data set, we ranked the perturbed TFs in the benchmark according to their NES and ran a gene set enrichment analysis (Subramanian et al. 2005). Our results revealed that, indeed, certain TF properties associate with better and worse TF activity predictions in the context of certain benchmarks and TF regulon data sets (Fig. 4B). For example, when evaluating the DNA-binding specificity of the TFs, those classified as having low specificity are worse predicted than those with higher DNA-binding specificity, using ChIP-seq and expression-inferred regulons. Focusing on the MoR of their targets, TFs that are expected to act only as activators or repressors are better predicted than TFs with dual MoR, using regulons from ChIP-seq, TFBS, and literature-curated sources. This is probably caused by the incomplete knowledge on the MoR of TF–target interactions in these data sets. In contrast, TFs with a dual MoR are better predicted using consensus regulons inferred from GTEx, likely because of the inference of the TF–target interaction sign from the gene expression patterns. Also, we observed that the properties related to the regulation of the TF function strongly impact the performance of the predictions. For example, TFs binding the DNA as heteromers were poorly predicted using regulons inferred from expression data, likely because the inference approach does not consider interactions between TFs in their model. Similarly, when studying the impact of DNA accessibility, our results showed that “settler TFs,” which bind to all the accessible DNA sites matching their DNA-binding motifs, display better predictions across all regulon types except for those inferred from gene expression. In contrast, TFs with more complex interactions with the chromatin and cofactors, called “migrant TFs” (binding only to part of the accessible DNA sites matching their DNA-binding motifs), are worse predicted using ChIP-seq and literature-curated regulons. Finally, TFs ubiquitously expressed across GTEx tissues are likely involved in a wider range of processes and intricate regulatory mechanisms (Vaquerizas et al. 2009) and are worse predicted than TFs with tissue-specific expression (one or two GTEx tissues). Taken together, these results indicate that activity predictions are less accurate for TFs under complex molecular control.
An integrated resource of scored TF–target interactions
With the aim of providing a comprehensive resource of regulatory TF–target interactions, we have integrated all the collected interactions from the four lines of evidence and assigned a confidence score to each one based on the benchmark results. This resource incorporates (1) all the interactions derived from the literature-curated resources, (2) the top 500 scoring interactions per TF identified from the collection of ChIP-seq experiments from ReMap, (3) the top 500 interactions per TF identified by scanning the human gene promoters with JASPAR and HOCOMOCO motifs (P < 0.001), and (4) the regulons inferred by ARACNE in at least three GTEx normal tissues. Given that on cancer samples cancer-specific regulons inferred by ARACNE performed better than regulons inferred from normal tissues, we have generated a pancancer version of the resource in which GTEx TF–target interactions are substituted by those observed in at least three TCGA cancer types. These resources are available in OmniPath (Türei et al. 2016; www.omnipathdb.org) and at https://saezlab.github.io/DoRothEA/. The normal collection comprises 1,077,121 TF–target candidate regulatory interactions between 1402 TFs and 26,984 targets. The pancancer collection includes 636,753 TF–target candidate regulatory interactions between 1412 TFs and 26,939 targets.
Here, for each TF–target interaction, we assigned a confidence score based on the observations from our benchmark. The score comprises five categories, ranging from A (highest confidence) to E (lowest confidence). The scoring criteria are described in Figure 5A. Briefly, interactions that are supported by all the four lines of evidence, manually curated by experts in specific reviews, or supported in at least two curated resources are considered to be highly reliable and were assigned an A score. Scores B through D are reserved for curated and/or ChIP-seq interactions with different levels of additional evidence. Finally, an E score is used for interactions that are uniquely supported by computational predictions. To provide the most confident regulon for each TF, we aggregated the TF–target interactions with the highest possible confidence score that resulted in a regulon equal to or greater than 10 targets. The final confidence score assigned to the TF regulon is the lowest confidence score of its component targets. Figure 5B describes the TFs and interactions coverage per scoring category in the normal and the pancancer data sets (Supplemental Tables S3, S4).
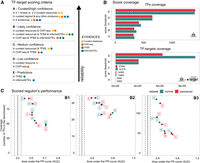
Scoring TF–target interactions from different evidence. (A) Scoring scheme. (B) TF and TF–target interaction coverage per score cutoff for the normal (dark green) and pancancer (red) collections. (C) Performance of scored regulons in the B1, B2, and B3 benchmark data sets.
Finally, we used the scored regulons to characterize TF activities on our benchmark data sets. As expected, TF activities derived from A- to B-scored target regulons perform better than activities estimated using E-scored targets in the three benchmark data sets (Fig. 5C). Similar results are observed with the pancancer scored regulons. These results highlight the importance of the integration of TF target regulatory relationships from multiple sources for an accurate and comprehensive inference of human TF activities.
Discussion
Inference of TF activities from the expression levels of their putative targets is becoming a widespread approach to extract functional insight from transcriptomic data (Carro et al. 2010; Schacht et al. 2014; Alvarez et al. 2016; Falco et al. 2016; Osmanbeyoglu et al. 2017; van de Peppel et al. 2017; Garcia-Alonso et al. 2018). Although several strategies exist to define the TF targets (i.e., TF regulon), their potential to predict changes in TF activities has not yet been systematically compared. To use these data conveniently, a critical evaluation of their reliability (i.e., quality), coverage (i.e., quantity), and bias is needed. Here we evaluated the impact of the four major types of evidence supporting the human TF–target interactions in the estimation of TF activities: literature-curated repositories, ChIP-seq binding data, in silico predictions of TFBSs on gene promoters, and inference by reverse engineering from large gene expression data sets.
Overall, we observed that for almost half of the TFs, only one of the four strategies report targets. We also found low overlap at the TF–target interaction level, at which the great majority are supported by a single line of evidence. This low overlap, along with different algorithmic strategies to estimate TF activities from regulons, can lead to large variation in the estimations (Trescher et al. 2017). Therefore, it seems that to have a complete picture of the human TF–target regulatory map, integration of different strategies is essential.
Comparing the quality of TF–target interaction data sets is complex owing to their relatively low coverage and overlap. In addition, these data sets need to be benchmarked against a reliable and comprehensive reference set. To our knowledge, there is no systematic experiment directly measuring the protein-level activities of hundreds of human TFs in several conditions. Under these limitations, in order to compare the different TF–target resources and detection strategies, we collected three alternative benchmark data sets in which changes in TF activities are assumed indirectly. In general, although there is a trend (curated regulons are better than ChIP-seq, which in turn are better than predicted ones), we noticed differences in the performance of each TF–target strategy across the benchmark data sets. These differences can be because of various experimental and biological factors. Among the experimental factors, we note the low coverage and low overlap of the TFs included in each benchmark experiment, as well as the different experimental conditions and assumptions used to derive these control data sets. In fact, in the perturbation-based benchmark data sets B1 and B2, some TFs in the negative controls (i.e., not directly perturbed TFs) can be indirectly affected and, therefore, not represent true negatives. These could involve, for instance, TFs coregulated by the perturbed TFs. Moreover, some of the TFs in the positive set (i.e., perturbed TFs) may not be effectively modulated by the perturbation strategy used (overexpression or knockout). For example, the experiments overexpressing a TF gene may not translate into an efficient activation of the coded protein if the regulatory elements (e.g., posttranslational modifications) or external stimulus (e.g., viral infection) needed for such activation is not present. In fact, when comparing TFs with different regulatory properties, performances are generally challenged when predicting activities for TFs with dual MoR (which can act as activators or repressors of their targets) or under complex molecular control, such as those working as heterodimers, interacting with cofactors, or other chromatin regulators. In these cases, the combination of complementary strategies to define TF—targets can enhance the TF activity predictions. Additionally, other biological factors influence the estimation of TF activities such as the modulation of TFs other than the perturbed ones owing to cooperativity, feedback regulation, or redundancy mechanisms in the regulation of transcriptional programs, which are used to buffer loss-of-function perturbations or inappropriate activation of specific TFs. All together, we hypothesize that the limitations of the benchmark data sets are masking and underestimating the potential of these TF–target resources.
Still, our results highlight the importance of the literature-curated regulons to infer accurate TF activities, with the highest precision achieved for interactions supported by more than one resource or expert's review. However, their systematic use is limited by low coverage, which requires the integration of multiple resources. Among literature-curated resources, the TRRUST database displays the best balance between regulon performance and coverage, the latter likely boosted by the systematic sentence-based text mining search of regulatory interactions before manual curation and incorporation of the MoR. Focusing on high-throughput strategies, ChIP-seq binding regulons displayed the highest performance with a coverage comparable to that of TF binding motifs on gene promoters. In general, in silico predictions based on TFBSs on gene promoters or inferred from GTEx displayed the lowest performance among all strategies. This result is likely because of the higher ratio of false positives intrinsic to the technical biases of each strategy (Yang et al. 2006; Farnham 2009). Tissue-specific regulons inferred from GTEx data perform similarly to inferred consensus regulons (i.e., selecting TF–target interactions detected in several tissues). A reason may be the inherent differences between the gene expression regulatory programs in the samples used to infer the regulatory networks (normal tissues from GTEx) and in the samples in the benchmark (cell lines, mostly cancer derived). Indeed, the use of cancer-specific instead of healthy GTEx-inferred regulons improves the performance in our benchmark data sets.
When combining TF–target interactions supported by both curated databases and ChIP-seq or any three lines of evidence, the performance increases with respect to the use of interactions only reported by literature-curated resources, suggesting that these can be further refined by integrating other lines of evidence. In contrast, regulons detected by the two in silico prediction methods did not improve the performance with respect to the use of curated databases alone.
With these observations in mind, we have integrated TF–target interactions derived from the aforementioned strategies, accompanied with a confidence score, to generate a normal (1,076,628 interactions) and a pancancer (636,753 interactions) consensus set of regulons. To our knowledge, this is the largest collection of human TF–target interactions from heterogeneous sources and strategies. This integrated resource has broad applicability for approaches requiring the inference of the regulatory activity of TFs, in which researchers can decide the level of confidence and coverage they want to use in their studies.
The use of regulons to estimate TF activities has many applications and can be particularly powerful to extract signal robustly from noisy or low coverage expression data such as in the case of single-cell RNA data (Ding et al. 2018; Garcia-Alonso et al. 2018). In addition, TF activities can be linked to upstream signaling pathways. Pathway activities are often inferred by the transcription levels of their members, ignoring the hard-to-measure posttranscriptional and posttranslational regulation. However, considering gene expression to be a downstream effect of pathway activity instead leads to more accurate estimations (Cantini et al. 2018; Schubert et al. 2018). Furthermore, TF activities can be used to infer the activity of upstream proteins using knowledge of pathways and how they affect TFs (Melas et al. 2015; Tuncbag et al. 2016; Clarke et al. 2018). The resources and confidence estimates that we propose will support the development of such methods. More generally, we expect the presented comparative assessment of the TF regulon resources to contribute to the establishment of guidelines for the quantification of human TF activities.
Methods
TF census and classification
Here we consider a TF as a protein that binds DNA in a sequence-specific manner and regulates the expression level of the target gene (Vaquerizas et al. 2009). We used the census of human TFs from the TFClass database (version 2014) (Wingender et al. 2013) involving 1541 human TFs, classified according to their DNA-binding domain. Moreover, we annotated each TF according to (1) the mode of interaction with the chromatin (pioneers, settlers, and migrants) using the results from Ehsani et al. (2016) and Lambert et al. (2018), (2) the number of GTEx tissues (Carithers et al. 2015) in which the gene is expressed (i.e., average expression >2 fpkm), (3) the DNA-binding mode (monomer, homomer, or heteromer) that we manually curated from UniProt (version November 2017) (The UniProt Consortium 2017) and complemented with the annotation provided by Lambert et al. (2018), and (4) the DNA-binding specificity, also from Lambert et al. (2018). Finally, we used the UniProt “Function CC” field to manually classify TFs into activators, repressors, activators and repressors, or unknown MoRs. TF annotations are provided as in Supplemental Table S1.
TF–target data sources
Literature-curated resources
We downloaded manually curated TF–target relationships from 12 sources—Fantom4 (Kawaji et al. 2011), HTRIdb (Bovolenta et al. 2012), IntAct (Orchard et al. 2014), KEGG (Kanehisa et al. 2012), ORegAnno (Lesurf et al. 2016), NFIRegulomeDB (Gronostajski et al. 2011), PAZAR (Portales-Casamar et al. 2009), TFacts (Essaghir et al. 2010), TFe (Yusuf et al. 2012), TRRD (Kolchanov et al. 2002), TRED (Jiang et al. 2007), TRRUST (Han et al. 2018)—and a manual curation of targets from TF-centric papers (Zeller et al. 2003; Massie et al. 2007; Riley et al. 2008; Boros et al. 2009; Chan et al. 2015). From Fantom4, we downloaded the “edge.GoldStd_TF.tbl.txt” file. From HTRIdb (v052016), we excluded interactions derived from large-scale experiments such as ChIP-chip and ChIP-seq. From IntAct, we collected all human protein–DNA interactions involving a TF protein and a gene. From KEGG, we used KEGGREST R library to download all Homo sapiens pathways and retrieve regulatory interactions classified as “GErel.” From ORegAnno, we separated the interactions from PAZAR and NFIRegulomeDB. The remaining interactions were classified as ORegAnno, keeping the interaction sign (i.e., MoR). From TFacts catalog, we extracted human interactions and separated TFacts-specific interactions from TRRD interactions using the REF field. TRED interactions were retrieved via the RegNetwork database (Liu et al. 2015). From TFe, we downloaded the manually curated targets and the interaction sign. From TRRUST, we extracted all human interactions. When the same TF–target interaction was assigned with more than one sign (activation or repression), we kept the interaction sign with more PubMed references. If the same number of references was observed, we prioritized the sign as follows: activation > repression > unknown. Finally, we manually extracted the canonical targets listed in several TF-specific revision papers (Zeller et al. 2003; Massie et al. 2007; Riley et al. 2008; Boros et al. 2009; Chan et al. 2015).
ChIP-seq interactions
We downloaded the merged ChIP-seq binding peaks provided by ReMap (Chèneby et al. 2018), which contains ChIP-seq data sets from ENCODE and other public resources. We chose ReMap because it provides ChIP-seq peaks
analyzed in a homogeneous way. Other ChIP-seq databases collect interactions from the original research articles and vary
in the way they processed the ChIP-seq data, the quality controls, and the peaks-to-genes mapping. Regulatory proteins other
than TFs in our census were excluded. For each TF, each binding site is assigned to the closest transcription start site (TSS)
using the function bedtools closest of BEDTools (Quinlan and Hall 2010). We obtained human TSSs from GENCODE version 26 (GRCh38) (Harrow et al. 2012). For all genes that have multiple transcripts, we chose the closest binding site–transcript pair. Therefore, each binding
site is assigned to one gene, but each gene may have zero or more binding sites for a given TF. For each binding site–gene
pair, we assigned a binding site-gene score between zero and one based on the distance between the binding site and TSS, similar
to the method of Ouyang et al. (2009):
 where md denotes the median distance between the TSS and binding site for each TF, and d is the distance between each binding site and the TSS of each gene, g. Therefore, the same score can be assigned a different distance for each TF depending on whether it tends to bind proximally
or distally. The score for each TF–target gene assignment is the sum of the scores for all binding sites of the TF assigned
to that gene. Finally, for each TF, all TF–target scores are scaled to a value between one and 1000.
where md denotes the median distance between the TSS and binding site for each TF, and d is the distance between each binding site and the TSS of each gene, g. Therefore, the same score can be assigned a different distance for each TF depending on whether it tends to bind proximally
or distally. The score for each TF–target gene assignment is the sum of the scores for all binding sites of the TF assigned
to that gene. Finally, for each TF, all TF–target scores are scaled to a value between one and 1000.
TFBS predictions in promoters
For each transcript, we scanned human promoter sequences (version GRCh38) for TFBSs. These were defined as the genomic sequence that comprises 1000 bp upstream (5′ direction) and 200 bp downstream (3′ direction). Mononucleotide PWMs were downloaded from the HOCOMOCO (version 11) (Kulakovskiy et al. 2018) and JASPAR (version 2018) (Khan et al. 2018) repositories. HOCOMOCO-core (excluding low-quality models, i.e., “D” category) comprised 402, whereas JASPAR (Vertebrates, nonredundant) comprised 572 PFMs (position frequency matrices). The prediction of potential TFBSs in the promoter sequences (on both strands) was performed using the motif discovery tool FIMO (Grant et al. 2011) from the MEME suite (version 4.12) (Bailey et al. 2015) with the default parameters. We selected FIMO predictions with a P-value <0.0001. Duplicated matches (exact binding sites found in different transcripts of the same gene) have been removed.
Next, we annotated the conservation and epigenetic regulatory features of the TFBSs. Base-level phastCons (Siepel et al. 2005) and phyloP (Pollard et al. 2010) scores were extracted from CellBase database (Bleda et al. 2012). phyloP version “hg38.100way.phyloP100way” and phastCons version “hg38.100way.phastCons” were downloaded in October 2016. phastCons scores range between zero and one and indicate the posterior probability that the site is in its most-conserved state at that base position. phyloP score is the −log(P-value) under a null hypothesis of neutral evolution, in which a positive sign indicates greater conservation. In both cases, binding site–level scores were defined as the 75% percentile of the single base-level scores of the binding region. To call a region conserved, phastCons and phyloP scores have to be equal or larger than 0.95 or three (corresponding to a P-value threshold = 0.001), respectively. Finally, we aligned the genomic coordinates of the TFBSs with Ensembl regulatory features (GRCh38.p10) (Zerbino et al. 2015) using CellBase to extract the feature ID and type. We considered the TFBSs aligned to “open_chromatin_region” or “ChIP_seq_region” to be a regulatory site.
Regulons inferred by reverse engineering from gene expression
We used GTEx v6 human gene expression data (Carithers et al. 2015) from control donors to infer transcriptional regulatory networks for healthy tissues. We downloaded gene-level raw counts for 18,737 samples from the Expression Atlas (Petryszak et al. 2014). One hundred forty-four samples with >30% of zero raw counts were discarded. Also, we removed genes with an average log counts per million (CPM) lower than zero. Next, we normalized the data using the TMM method implemented in the edgeR R package (version 3.14.0) (Robinson et al. 2010). Then, we used the voom function in the limma package (version 3.28.21) (Ritchie et al. 2015) to obtain fitted log2 CPM. To account for potential sample batch effects, we downloaded the annotation file GTEx_Data_V6_Annotations_SampleAttributesDS.txt from the gtexportal.org and extracted the isolation batch field “SMNABTCH” and corrected it, keeping the histological type as a covariate, using ComBat function from sva R package (version 3.20.0) (Leek et al. 2012). We also assessed regulons based on noncorrected data (Supplemental Fig. S10). Samples from cell lines were discarded. Finally, replicates (i.e., samples from the same tissue and donor) were averaged. These data cover 9407 samples from 30 tissues (histological types) (Supplemental Fig. S1B). Next, we used the ARACNE software (version 1.4) (Margolin et al. 2006) to reverse engineer tissue-specific networks. For each tissue with at least 15 donors, we first precalculated the ARACNE threshold with a fixed seed with the --calculateThreshold parameter. Second, we ran 100 reproducible bootstraps with a controlled seed and, with the --consolidate parameter, derived the tissue-specific network. Finally, we used the aracne2regulon function in VIPER R package (version 1.12.0) (Alvarez et al. 2016) to infer the sign of each TF–target interaction (i.e., MoR; activation or inhibition). We also downloaded cancer regulatory networks from the aracne.networks R package (version 0.99.7) covering 14 cancer types from TCGA (https://bioconductor.org/packages/release/data/experiment/html/aracne.networks.html).
Finally, we also aggregated the data from all the tissue-specific/cancer-specific regulons to infer four healthy and pancancer consensus regulons by selecting TF–target signed interactions appearing in at least two, three, five, and 10 GTEx tissues or TCGA cancer types, respectively.
Benchmark data
Three different benchmark data sets (B1, B2, and B3) were used to evaluate the TF–target resources: B1 and B2 based on gene expression data upon TF perturbation and B3 based on combining basal gene expression with essentiality profiles in cancer cell lines.
TF perturbation experiments
Benchmark B1
We downloaded microarray expression data corresponding to 189 manually curated TF perturbation experiments in human cell lines from 130 GEO studies. We considered only experiments that fulfilled two requirements: (1) providing comparable control and perturbed samples and (2) having at least two replicates per condition. In each experiment, controls and perturbed samples were manually classified into positive (with higher expected activity for the perturbed TF) or negative (with lower expected activity) samples. Overexpression and knockout-based experiments, in which the perturbed TF was not differentially expressed, were excluded. A total of 94 unique TFs were covered across the collected experiments (Supplemental Table S5). When CEL files were available for experiments performed with Affymetrix platforms, we used the functions ReadAffy and rma from the affy R package (version 1.50.0) to load and normalize the raw data. Otherwise, we used the expression matrix provided by the investigators and applied a quantile normalization for nonnormalized data. Finally, for each experiment, we performed a differential expression analysis between the positive and the negative samples using the limma R package (version 3.28.21) (Ritchie et al. 2015). Each perturbation experiment was analyzed independently.
Benchmark B2
Also, we considered two additional high-throughput shRNA perturbation experiments knocking-down several TFs with no replicates: one in an A375 cell line (GSE31534) and another in an MCF-7 breast cancer cell line (GSE31912) (Wang et al. 2012). The corresponding microarray expression data sets were downloaded and normalized as described for the benchmark data set B1. Normalized expression values were z-transformed to bring the expression from different genes to a common scale. To remove unsuccessful shRNA cases, knocked-down TFs whose expression was in the top 20th percentile (TF-wise) were excluded. Ultimately, 13 and 28 TFs from GSE31534 and GSE31912, respectively, were used.
Basal cancer cell line data: benchmark B3
Additionally, we retrieved basal gene expression data from a panel of cancer cell lines that we combined with phenotypic data from two gene shRNA essentiality screens and copy number alterations (CNAs) to define likely active and inactive TFs. Specifically, we used gene expression data from our previous publication (Garcia-Alonso et al. 2018), which included basal RNA-seq measurements from three cancer cell line panels: Genomics of Drug Sensitivity in Cancer (GDSC) (Iorio et al. 2016), Cancer Cell Lines Encyclopedia (CCLE) (Barretina et al. 2012), and Genentech (Klijn et al. 2015). Data are available to download from the Expression Atlas (Petryszak et al. 2014) under the accessions E-MTAB-3983, E-MTAB-2770, and E-MTAB-2706, respectively. Regarding the gene essentiality screens, we downloaded the DEMETER scores from Achilles data set (version 2.20.2) (Tsherniak et al. 2017) and ATARiS scores from the project DRIVE (McDonald et al. 2017). A TF was considered to be essential in a cell line (i.e., positive control) if the DEMETER or ATARiS z-scores were less than −4 and nonessential (i.e., negative control) if the z-scores were more than 4. TFs carrying homozygous deletions were also used as negative controls. CNA for the cell lines were downloaded from the GDSC portal (Iorio et al. 2016).
TF-activity scoring methods
We estimated TF activities as a proxy of the expression levels of the targeted genes using the aREA method from the VIPER R package (Alvarez et al. 2016), a statistical test based on the average ranks of the targets. For perturbation experiments in B1, changes in TF activities for each perturbation were derived from the differential expression signatures via the aREA-msviper function. For GSE31534 and GSE31912 experiments in B2 and the cancer cell lines in B3, TF activities were derived from the z-transformed expression values via the aREA-viper function. In both cases, we used the default parameters, with the exception of ges.filter/eset.filter, which was set to false to avoid limiting the expression signatures to the genes represented in the regulons. The NES was used as a measure of relative TF activity. NESs were estimated for each TF in each individual regulon data set independently (e.g., TP53 regulon from IntAct, TP53 regulon from ReMap, etc.). To avoid confounding effects, self-regulatory interactions were removed. Also, overrepresented targets (regulated by >10% of the TFs in the regulon data set) were discarded. Only TF regulons with at least five targets (n > 4) were tested. NFIRegulomeDB was excluded from the benchmark because of the low coverage.
The aREA method takes into account the sign of each TF–target interaction. Here, when the MoR of the TF–target interaction was not defined by the original data set (i.e., those derived from TFBS predictions, ChIP-seq data and most of the curated databases), we assumed a positive regulatory effect of the TF on the target. However, if the TF is known to be a global repressor (data extracted from UniProt) (Supplemental Table S1), the interactions are assumed to have a negative regulatory effect.
Comparing regulons performance
To evaluate the performance of each regulon resource, we compared the estimated activities of the TFs in each benchmark data set. In the context of the perturbation-based benchmark data sets B1 and B2, our assumption is that if the TF regulon defined by a given source (e.g., TP53-IntAct) is accurate, then the experiment perturbing such TF (positive controls) should display lower activity than the rest of the perturbations (negative controls) and rank at the top. In the same way, in our benchmark data set B3, we expect that a sample in which a TF is essential (and therefore active; positive controls) should display the highest activity scores, whereas the inactive TFs (negative controls) should take the lowest values. Thus, for each TF regulon under study, we rank the samples according to the TF's NES. Next, to evaluate the ranking values of the positive and negative controls we performed precision-recall and receiver operating characteristic (ROC) analyses by the PRROC R package (version 1.3) (Grau et al. 2015) and we used the areas under the curves (AUPRC and AUROC) as performance metrics. Because the number of positive and negative controls is unbalanced for the benchmark data sets B1 and B2 (in favor of the negatives), we down-sampled the negatives 100 times to equal the number of positives and took the average metric values.
Data access
The regulons and code to estimate transcription factors activities are available at https://saezlab.github.io/DoRothEA/. The regulons are also available as Supplemental Tables S3 and S4 or as part of OmniPath (www.omnipathdb.org) and can be browsed in Omnipath's Cytoscape Plugin. TF activity scores can also be computed and visualized in a user-friendly web application available at https://saezlab.shinyapps.io/funkiapp/. The code to benchmark the regulon's TF activities can be found at https://github.com/saezlab/TFbenchmark and as Supplemental Code. Benchmarking code is written in R (R Core Team 2017). All the data used in this study are available at Zenodo (https://zenodo.org/record/2646279).
Acknowledgments
We thank Anthony Mathelier and Manu Kumar for useful feedback on the manuscript. This work was supported by Open Targets (grant number OTAR016), Germany Federal Ministry of Education and Research grant “LiSyM” (FKZ 031L0041), and the JRC for Computational Biomedicine, which is partially funded by Bayer AG.
Footnotes
-
[Supplemental material is available for this article.]
-
Article published online before print. Article, supplemental material, and publication date are at http://www.genome.org/cgi/doi/10.1101/gr.240663.118.
-
Freely available online through the Genome Research Open Access option.
- Received June 18, 2018.
- Accepted May 28, 2019.
This article, published in Genome Research, is available under a Creative Commons License (Attribution-NonCommercial 4.0 International), as described at http://creativecommons.org/licenses/by-nc/4.0/.


