
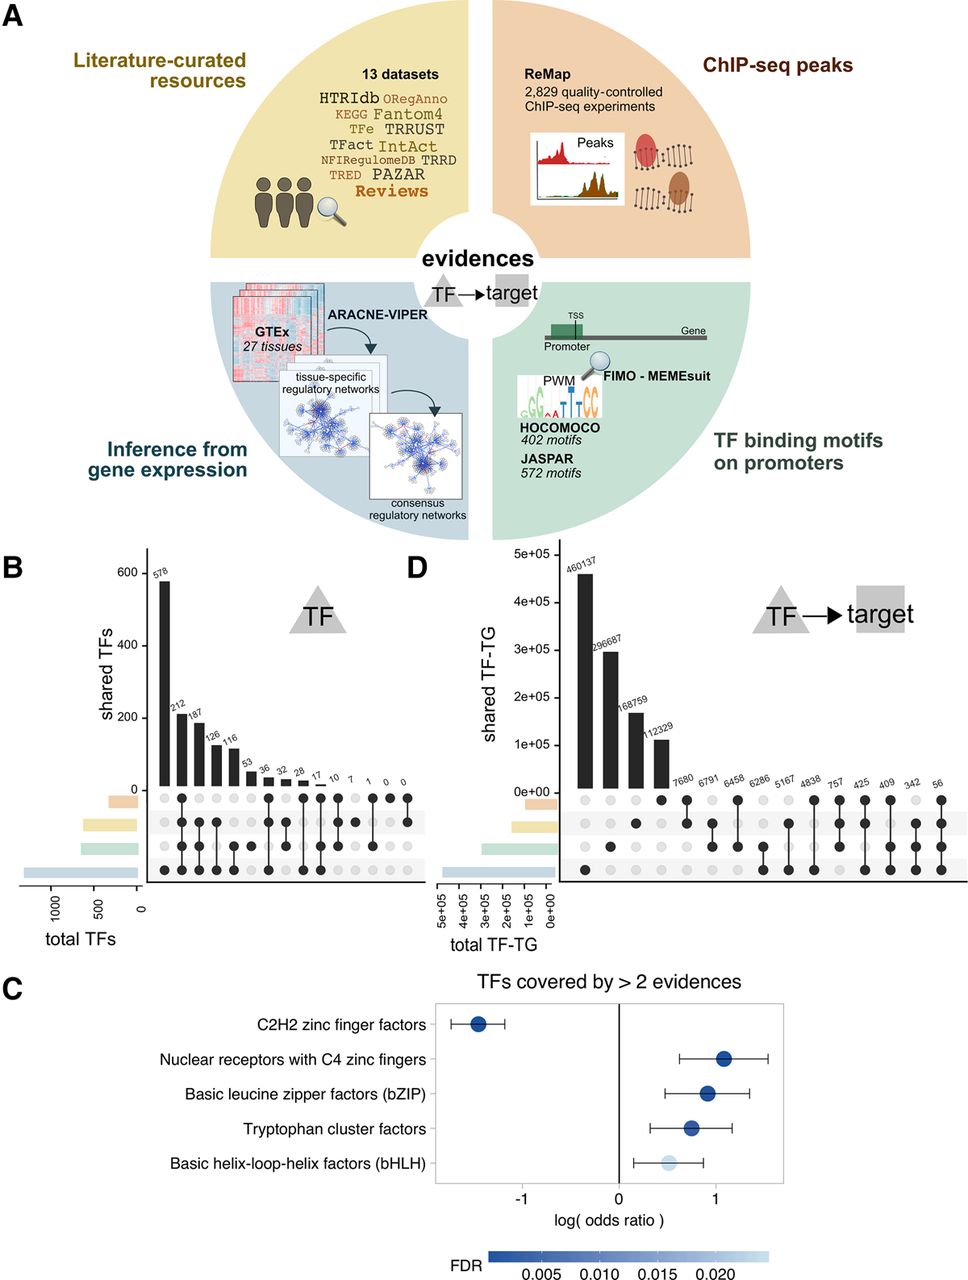
TF–target resources overview. (A) Summary of the resources and strategies used to derive human TF–target interactions classified according to the evidence level: manually curated resources (yellow), ChIP-seq binding experimental data (orange), prediction of TF binding motifs based on gene promoter sequences (green), or inference from GTEx data (blue). All the resources were used in the benchmark, except NFIRegulomeDB, which has too low coverage. (B) TF coverage and overlaps across the different evidence classes, represented via UpSet plots (Lex and Gehlenborg 2014). Left bar plot represents the total number of TF per evidence class. Top bar plot represents the number of overlapping TFs in the intersection. Dark circles in the matrix indicate the evidence class that is part of the intersection. (C) TF classes (from TFClass) enriched in the TFs covered by more than two lines of evidence. Dots indicate the log odds ratio; error bars, the confidence interval. Colors indicate the FDR. (D) UpSet plot representing the TF–target's coverage and overlaps across the different evidence classes (similar as in B). Note that for regulons inferred from GTEx, only TF–targets or three or more tissues are shown. For TFBSs and ChIP-seq, only top 500 unique hits are shown; P < 0.0001.


