
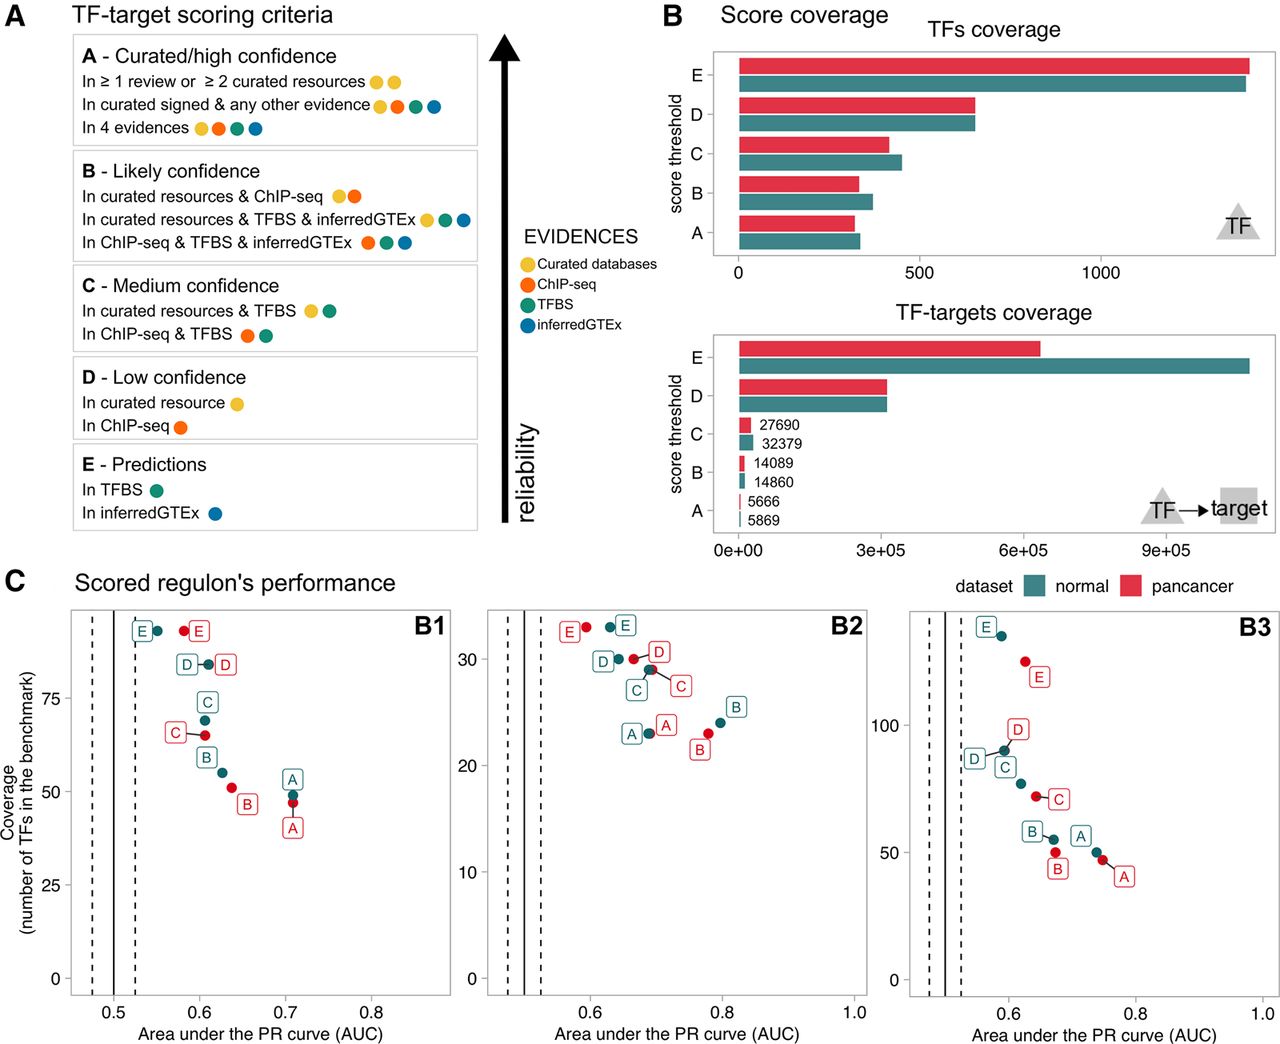
Figure 5.
Scoring TF–target interactions from different evidence. (A) Scoring scheme. (B) TF and TF–target interaction coverage per score cutoff for the normal (dark green) and pancancer (red) collections. (C) Performance of scored regulons in the B1, B2, and B3 benchmark data sets.


