
A chromosome-level assembly of the Atlantic herring genome—detection of a supergene and other signals of selection
- Mats E. Pettersson1,
- Christina M. Rochus1,13,
- Fan Han1,13,
- Junfeng Chen1,
- Jason Hill1,
- Ola Wallerman1,
- Guangyi Fan2,3,
- Xiaoning Hong2,4,
- Qiwu Xu2,
- He Zhang2,
- Shanshan Liu2,
- Xin Liu2,5,6,
- Leanne Haggerty7,
- Toby Hunt7,
- Fergal J. Martin7,
- Paul Flicek7,
- Ignas Bunikis8,
- Arild Folkvord9,10 and
- Leif Andersson1,11,12
- 1Science for Life Laboratory, Department of Medical Biochemistry and Microbiology, Uppsala University, SE-75123 Uppsala, Sweden;
- 2BGI-Qingdao, BGI-Shenzhen, Qingdao 266555, China;
- 3State Key Laboratory of Quality Research in Chinese Medicine, Institute of Chinese Medical Sciences, University of Macau, Macao 999078, China;
- 4BGI Education Center, University of Chinese Academy of Sciences, Shenzhen 518083, China;
- 5BGI-Shenzhen, Shenzhen 518083, China;
- 6China National GeneBank, BGI-Shenzhen, Shenzhen 518120, China;
- 7European Molecular Biology Laboratory, European Bioinformatics Institute, Wellcome Genome Campus, Hinxton, Cambridge CB10 1SD, United Kingdom;
- 8Science for Life Laboratory Uppsala, Department of Immunology, Genetics and Pathology, Uppsala University, SE-75123 Uppsala, Sweden;
- 9Department of Biological Sciences, University of Bergen, 5020 Bergen, Norway;
- 10Institute of Marine Research, 5018 Bergen, Norway;
- 11Department of Animal Breeding and Genetics, Swedish University of Agricultural Sciences, SE-75007 Uppsala, Sweden;
- 12Department of Veterinary Integrative Biosciences, Texas A&M University, College Station, Texas 77843, USA
-
↵13 These authors contributed equally to this work.
Abstract
The Atlantic herring is a model species for exploring the genetic basis for ecological adaptation, due to its huge population size and extremely low genetic differentiation at selectively neutral loci. However, such studies have so far been hampered because of a highly fragmented genome assembly. Here, we deliver a chromosome-level genome assembly based on a hybrid approach combining a de novo Pacific Biosciences (PacBio) assembly with Hi-C-supported scaffolding. The assembly comprises 26 autosomes with sizes ranging from 12.4 to 33.1 Mb and a total size, in chromosomes, of 726 Mb, which has been corroborated by a high-resolution linkage map. A comparison between the herring genome assembly with other high-quality assemblies from bony fishes revealed few inter-chromosomal but frequent intra-chromosomal rearrangements. The improved assembly facilitates analysis of previously intractable large-scale structural variation, allowing, for example, the detection of a 7.8-Mb inversion on Chromosome 12 underlying ecological adaptation. This supergene shows strong genetic differentiation between populations. The chromosome-based assembly also markedly improves the interpretation of previously detected signals of selection, allowing us to reveal hundreds of independent loci associated with ecological adaptation.
The Atlantic herring (Clupea harengus) is a model system for ecological adaptation and the consequences of natural selection (Martinez Barrio et al. 2016; Lamichhaney et al. 2017; Hill et al. 2019), largely due to the enormous population size minimizing genetic drift. The Atlantic herring is, in fact, one of the most abundant vertebrates on Earth, with schools comprising more than a billion individuals and an estimated global population in excess of 1011 fish (Feng et al. 2017). It is also one of few marine species to successfully colonize the Baltic Sea, a brackish body of water formed after the last Ice Age, giving rise to the phenotypically distinct subspecies Baltic herring.
Earlier work provided the first draft version of the herring genome (Martinez Barrio et al. 2016) and revealed regions with strong signals of selection related to both adaptation to the brackish Baltic Sea and differences in spawning time between herring populations (Martinez Barrio et al. 2016; Lamichhaney et al. 2017). In contrast, there is essentially no genetic differentiation at selectively neutral loci even between geographically distant populations, a fact documented already by isozyme and microsatellite analyses (Andersson et al. 1981; Ryman et al. 1984; Larsson et al. 2010; Limborg et al. 2012) and verified by whole-genome sequencing (Lamichhaney et al. 2012, 2017). However, while the signals of selection are strong, the fragmented draft genome made it challenging to determine the number of independent loci under selection and made it difficult to study the impact of large-scale inversions and other structural variations.
Here, by combining a de novo long-read assembly of an Atlantic herring with long-range chromatin interaction (Hi-C) information (Lieberman-Aiden et al. 2009), we remedy this fragmentation and deliver a chromosome-level assembly of the herring genome comprising 26 autosomes with sizes ranging from 12.4 to 33.1 Mb and a total size of 726 Mb. We also show how this new assembly has a major impact on our ability to interpret signals of selection.
Results
The assembly is based on a new, de novo assembly of an Atlantic herring, as opposed to a Baltic herring used for the previously published version 1.2 (Martinez Barrio et al. 2016). The assembly workflow is outlined in Figure 1, and the final version, with the parts that could not be linked to the 26 chromosomes included as unplaced scaffolds, is publicly available via the European Nucleotide Archive (https://www.ebi.ac.uk/ena/data/view/GCA_900700415). Summary statistics of the involved assemblies are in Table 1, while the sizes of the assembled chromosomes are in Table 2. We assume that the 26 superscaffolds correspond to chromosomes and have named these Chr 1–Chr 26 based on size.
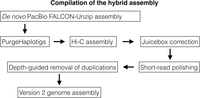
Flow chart of the assembly compilation process (see Methods for further details).
Summary statistics for different assemblies of the herring genome
Physical and genetic sizes of the chromosomes
A comprehensive linkage map
We used pedigree data from two full-sib families, one Baltic herring and one Atlantic herring family, bred in captivity. The parents and 45 Baltic and 50 Atlantic full-sibs were genotyped for approximately 45,000 markers across the genome using a previously described SNP chip (Martinez Barrio et al. 2016). The markers formed 26 linkage groups in perfect agreement with the genome assembly, and the linkage map confirmed the linear order of genomic segments along the chromosomes. The total length of the sex-average linkage map was 1660 cM, and the average recombination rate was 2.54 cM/Mb (Table 2; sex-specific maps in Supplemental Table S1); the male map was 13% longer than the female map. Since the herring genome is composed of 26 chromosomes, the total map distance of 1660 cM implies that there is slightly more than one recombination event per chromosome pair in each meiosis (26 × 50 cM = 1300 cM). There was a consistent pattern of nonuniform recombination rate across chromosomes, with the typical case being an L-shaped map where one section, in many cases, >10 Mb, displays little to no recombination in the pedigree (Fig. 2A). In essence, it seems most chromosomes have one hot side and one cold side in terms of recombination rate. However, on the population level, the linkage disequilibrium (LD)-based recombination frequencies across the cold regions are above zero, indicating that there is not a complete repression of recombination but rather a moderation of its frequency. The linkage map for Chromosome 8 is shown in Figure 2B, and all maps are in Supplemental Figure S1.
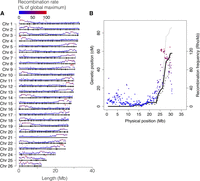
Chromosome size distribution and recombination rate. (A) Physical extent of the assembly for each chromosome, with average recombination rate, in 100-kb windows, shown on top of each chromosome and markers used in the linkage map indicated as black bars. (B) Linkage map data (black lines) and recombination-rate profile (colored segments) for Chromosome 8. Solid line: sex-average; dashed line: male; dotted line: female.
Chromosome-wise recombination profiles
The chromosomal-level assembly provides an opportunity to investigate the variation of recombination rates across the genome using population genetic data. Here, we constructed a recombination rate profile based on patterns of linkage disequilibrium using LDhat (Auton and McVean 2007). We estimated crossover events among ∼1.7 million SNPs from 14 Baltic herring that have been individually sequenced (Martinez Barrio et al. 2016; Lamichhaney et al. 2017). A fine-scale recombination map was generated with mean recombination rate of ρ = 31.3/kb, corresponding to 2.1 cM/Mb, given nucleotide diversity (π) = 0.3% (Martinez Barrio et al. 2016) and mutation rate (µ) = 2 × 10⁻⁹ (Feng et al. 2017), similar to the rate in zebrafish (1.6 cM/Mb) (Bradley et al. 2011). Overall, there was excellent agreement between pedigree-based (linkage) and population-based (LD) estimates of recombination rates along herring chromosomes (Fig. 2B; Supplemental Fig. S1).
Correspondence to karyotype and positioning of the centromeres
The genome assembly is consistent with the observed karyotype for the sister species Pacific herring (Clupea pallasi), both in terms of the number of chromosomes and their size distribution. Ida et al. (1991) showed that the diploid genome consisted of 26 pairs (2n = 52), where most were of similar size, with two smaller pairs that were speculated to be the result of a recent chromosome fission event. Out of the 26 pairs, three were determined to be metacentric or submetacentric, while the remaining 23 were reported to be acrocentric. The recombination profile observed across the Atlantic herring chromosomes suggests, based on the situation in many other species, that the recombination rate is relatively low toward centromeres and relatively high toward telomeres. Therefore, we propose that Chromosomes 3, 20, and 22 are metacentric, as their profile is shaped like a “U” rather than an “L” (Fig. 2). For the “L”-shaped chromosomes, we expect the centromere to be located at the flat end, not necessarily at the beginning, as the assembly was agnostic to the linkage map.
Inter-chromosomal rearrangements are rare, but intra-chromosomal rearrangements are frequent among teleosts
The chromosome-level assembly allows comparisons of the herring genomic organization with that in other species. We performed pair-wise whole-genome alignments between the new herring assembly and five other teleosts with chromosome-level assemblies publicly available. These comparisons revealed a very high degree of conserved synteny among teleosts, as illustrated by the comparison of the Atlantic herring and stickleback genomes (Fig. 3A). However, the linear orders along chromosomes are highly rearranged (Fig. 3B).
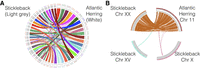
Conserved synteny between Atlantic herring and stickleback. (A) Whole-genome alignment between the Atlantic herring and threespine stickleback assemblies. (B) Detailed view of sequence homologies between herring Chromosome 11 and stickleback Chromosome XX, indicating many intra-chromosomal rearrangements.
Number of independent signals of selection associated with ecological adaptation
Our previous estimates of the number of independent loci associated with ecological adaptation to the brackish Baltic Sea, and to spring versus autumn (Martinez Barrio et al. 2016), were uncertain due to the fragmented nature of the previous assembly. Now, by transferring the data set to the new assembly and defining an independent peak as (1) at least two SNPs with χ2-test P-values < 10−20, as before (Martinez Barrio et al. 2016), (2) spanning at least 100 bases, and (3) separated from the next peak by at least 100 kb, we find 125 independent loci associated with adaptation to the Baltic Sea and 22 loci associated with different spawning times (Fig. 4A,B). Using a lower cut-off of 10−15 yields 195 and 47 independent loci, respectively. Thus, the qualitative result is not sensitive to the choice of cut-off value. While both these adaptations have a complex genetic background, there is a four- to fivefold difference in the number of loci reaching statistical significance, which makes sense given that adaptation to the Baltic Sea is likely a more complex process than adaptation to different spawning times; the Baltic Sea differs from the Atlantic Ocean as regards salinity, optic characteristics, depth, higher seasonal variation in temperature, plankton production, predators present, and pollution.
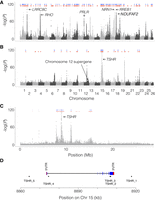
Signals of selections associated with ecological adaptation. The panels show the association, measured as –log(P) from χ2 tests on read counts of previously published data (Martinez Barrio et al. 2016) replotted along the new assembly. (A) Genetic differentiation between seven populations of Atlantic herring from the Atlantic Ocean, North Sea, Skagerrak, and Kattegat (salinity in the range 20–35 psu) and 10 populations from the Baltic Sea (salinity in the range 3–12 psu). (B) Genetic differentiation between 10 populations of spring-spawning herring versus three populations of autumn-spawning herring. In both panels, the blue and red dots indicate identified, independent regions of selection at a P-value cut-off of either 10−20 (blue) or 10−15 (red). (C) Zoom in on Chromosome 15 for the contrast based on differences in spawning time, which contains the most significant peak, located around TSHR. (D) Improved gene model of TSHR. TSHR_1 to 5 are selected SNPs showing highly significant association (P < 10−95) to spawning time and/or being nonsynonymous coding, while covering the extent of the THSR gene model.
Resolving spawning time-associated variation at the TSHR locus
Our previous work (Martinez Barrio et al. 2016; Lamichhaney et al. 2017) showed that the SNPs most strongly associated with variation in spawning time are located immediately adjacent to the thyroid stimulating hormone receptor (TSHR) gene (Fig. 4C). However, the previous gene model was truncated compared to homologs from other species, missing the first three exons. This led to difficulties in interpreting the signal of selection, as it was unclear how the differentiated SNPs were positioned in relation to the TSHR start of transcription (TSS). In order to improve the gene model, we performed 5′ and 3′ RACE experiments, which, together with subsequent PCR validation of the entire coding region, allowed us to generate a complete gene model that shows that the two most differentiated SNPs are located in a 10-kb region around the TSS of TSHR (Fig. 4D).
Identification of a supergene on Chromosome 12
The LD pattern across the herring genome was analyzed in more than 1170 individuals, genotyped for approximately 45,000 SNPs, collected from around the Swedish coast by high school students (project Forskarhjälpen). This analysis revealed an extensive LD block, from 17.8 Mb to 25.6 Mb on Chromosome 12, that was divided into four different scaffolds in the previous assembly. This region also stood out in screens for ecological adaptation, since the genetic differentiation was more or less equally strong across the block (Fig. 5A), lacking the typical pyramidal peak shape. Inside the block there was no correlation between the strength of LD and physical distance (Fig. 5B, top). This indicated the presence of a possible supergene, either in the form of an inversion or a block of otherwise repressed recombination. However, the pattern contained inconsistencies; specifically, there were moderately linked markers interspersed with virtually perfectly linked ones across the full extent of the block.
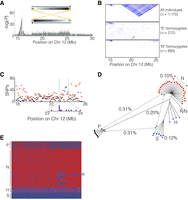
Identification of a 7.8-Mb inversion on herring Chromosome 12. (A) The spawning time contrast for Chromosome 12 highlights the block-like association pattern for the region from 17.9 to 25.6 Mb. The sketch shows the location of inverted repeats flanking the supergene. (B) LD patterns across the region in different groups of individuals sorted according to genotype for the putative inversion. (C) The distribution, as number of SNPs per 100 kb, of shared (black) and diagnostic (red) SNPs across the inversion region. Purple boxes (inset) are estimated locations of breakpoints in individuals that appear to carry a recombinant chromosome (see text). (D) Neighbor-joining tree based on genotypes for all SNPs in the inversion region called from individual whole-genome sequencing. The distances indicated across the tree are average nucleotide differences between haplotypes, either within groups (dashed) or between groups (solid). The letters designate the supergene type of the individual as follows: N = Northern homozygote; S = Southern homozygote; H = N/S heterozygote; R/N = individual carrying an N haplotype and a recombinant haplotype (see text); P = Pacific herring. (E) Heat map of the genotypes for diagnostic SNPs based on individual whole-genome sequencing. Supergene type of the samples is indicated as in D.
Led by the LD patterns revealed in the population data, detailed examination of the pedigree data used for linkage mapping revealed an elevated frequency of heterozygous SNPs in one out of four parents across the putative inversion, a pattern that was repeated in 28 out of 50 offspring in that family, consistent with proper Mendelian inheritance. Assuming that the high-heterozygosity parent and offspring were heterozygous for the proposed inversion allowed us to deduce supergene haplotypes and use these to genotype unrelated individuals by similarity to the two reference haplotypes; these were denoted Northern (N) and Southern (S) based on their geographic distribution (see below). Finally, by analyzing LD patterns in the groups of individuals determined to be homozygous for the two haplotypes separately, we noted a lack of strong LD across the entire region within both groups (Fig. 5B, middle and bottom). This indicates that recombination occurs between chromosomes of the same class but is strongly repressed in heterozygotes, the expected pattern for an inversion but not if recombination is suppressed in the region for other reasons.
In an attempt to identify inversion break points, we examined reads from whole-genome sequence data from individuals with different genotypes and found inverted repeat patterns at both ends of the putative inversion block (Fig. 5A; Supplemental Fig. S2). For the putative breakpoint at 17.9 Mb, we found short-read mismatch patterns at the edge of this repeat (position 17,826,318 bp) that correlated perfectly with the SNP-based supergene genotype (Supplemental Fig. S2). No short-read mismatches (e.g., soft-clipped reads) were identified in individuals classified as SS homozygotes, consistent with the fact that the reference assembly contains the S haplotype. In contrast, 50% and 100% of the short reads from NS heterozygotes and NN homozygotes, respectively, were mismatched at this position. Thus, we consider this as a putative inversion breakpoint, but at present we cannot exclude the possibility that this is a structural variant in complete LD with the true breakpoint. We were not able to identify similar mismatched reads at the other breakpoint (around 25.6 Mb) due to the high repeat content. These observations support the hypothesis that the extremely strong LD in this region is caused by an inversion and that the inverted repeats have facilitated its occurrence.
Examining individual SNP allele frequencies in each group of locus-wide homozygotes, we were able to classify a fraction of the SNPs within the interval as shared, defined as having allele frequencies in the range 10%–90% in both haplotype-groups. This is not expected of a canonical inversion with a single origination event and complete suppression of recombination. Thus, some amount of genetic exchange must be ongoing. In an attempt to quantify the amount of genetic exchange across the supergene, we tallied both diagnostic, defined as having allele frequency >90% in one group and <10% in the other, and shared SNPs in 100-kb windows (Fig 5C). Diagnostic (red) SNPs are enriched at each end of the interval, with the left-hand side having stronger enrichment. The shared SNPs (black) have a peak, matched by a corresponding lack of diagnostic SNPs, at around position 23.5 Mb. A similar pattern is seen for the absolute delta allele frequencies for all SNPs (Supplemental Fig. S3A).
It seems likely that this pattern is linked to a rare class of individuals (12 out of 1170) that carry a third haplotype where the segment leading up 23.5 Mb follows the “Southern” haplotype, while the block beyond that is of the “Northern” type. The estimated switching-points of these 12 individuals are shown as purple blocks in the inset of Figure 5C. We can also detect a lack of shared SNPs close to both edges of the supergene, in particular, the right-hand one (Supplemental Fig. S3B), a pattern that is consistent with genetic exchange between inversion haplotypes due to twisting of the chromosomes.
We constructed a genetic distance tree for the supergene region based on individual whole-genome sequence data (Fig. 5D); the color of each leaf in the tree corresponds to the supergene type. This shows the expected clustering of homozygotes for the two supergene types (N or S), while the heterozygotes (H) are positioned in between. Notably, there is one individual that carries one copy of the partial inversion haplotype (R) discussed above, with an estimated breakpoint in the same region found in individuals genotyped using the SNP chip. The tree also reveals that the inversion must have occurred after the divergence from the Pacific herring, because the two alleles are equidistant from alleles found in Pacific herring (Fig. 5D). The nucleotide diversity inside each haplotype group is lower than the genomic average of 0.3%, which is consistent with both lower effective population size, due to restricted recombination, for this region compared to the rest of the genome, as well as a bottleneck when the inversion was formed. Supplemental Figure S3, C and D, shows the allele frequency distributions among 11,965 typed SNPs from the inversion region in “S” and “N” homozygotes. The higher number of SNPs close to fixation (MAF < 5%) in the “N” group indicates that it is the derived version, which could be correlated to northward expansion of the Atlantic herring in response to receding glaciation.
A heat map based on diagnostic SNPs, deduced from individual whole-genome sequence data, supports the notion that the two haplotype groups evolved subsequent to the split between Atlantic and Pacific herring and illustrates the extreme LD across the region (Fig. 5E). This analysis provides further evidence for ongoing recombination between haplotypes in the interval from 23.1 to 24.0 Mb. Additionally, the heat map makes it clear that the individual labeled “R/N” in Figure 5D carries one copy of the recombinant haplotype described above.
The supergene on Chromosome 12 underlies ecological adaptation
Across the supergene region, allele frequencies differ substantially for virtually all SNPs (Fig. 6A), allowing estimation of supergene allele frequency even in pooled sequencing data. Using the SNPs found to be essentially fixed for different alleles in the Northern and Southern haplotype groups, i.e., those SNPs found in the lower-right corner of Figure 6A, we estimated haplotype frequencies in pooled samples based on the average allele frequency at diagnostic SNPs.
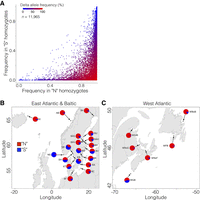
Genetic differentiation in the region encompassing the putative inversion on Chromosome 12. (A) Allele frequencies for all SNPs (n = 11,965) inside the inversion among individuals homozygous for the Southern (S) (y-axis) or Northern (N) haplotypes (x-axis). All frequencies are expressed in terms of the allele that is more common in the “N-”context than in the “S-”context. (B,C) Estimated frequencies for the Northern and Southern haplotypes in pooled population samples in the Baltic Sea and East Atlantic (B) and in the West Atlantic (C). The location and date of capture of the pooled samples are listed in Lamichhaney et al. (2017).
The estimated haplotype frequencies in the pooled data, which covers a wide range of herring populations, revealed a highly significant genetic differentiation among populations (Fig. 6B,C). There was a consistent trend in West Atlantic, East Atlantic, and in the Baltic Sea in that the populations spawning most northerly had a high frequency of the Northern haplotype while the Southern haplotype dominated in populations spawning more southerly, with the exception being a few populations in the Southern Baltic Sea. The most extreme population, almost fixed for the Southern haplotype, was the one representing autumn-spawning North Sea herring (NS in Fig. 6B). This strong genetic differentiation is never observed at selectively neutral loci among the populations included in this analysis (Martinez Barrio et al. 2016; Lamichhaney et al. 2017). Thus, this supergene polymorphism must be under selection, possibly related to temperature at spawning, which is known to be a major stressor for the southernmost and high temperature-exposed herring populations (Peck et al. 2012; Ojaveer et al. 2015).
Discussion
Integrity of the assembly
The overall organization of the assembly presented here is mainly supported by two separate observations: the one-to-one correlation between putative chromosomes and independently determined linkage groups, and the discrete blocks detected in the Hi-C contact map. Based on these two data sets, we are confident that the 26 superscaffolds present in the assembly match the 26 physical chromosomes identified by karyotyping of the sister taxon Pacific herring (Ida et al. 1991). Furthermore, the high quality of the assembly is strongly supported by the very high degree of conserved synteny between our Atlantic herring genome and those of other teleosts.
Inter-chromosomal rearrangements are rare, while intra-chromosomal rearrangements are abundant in teleosts
This study revealed a contrast between conserved synteny, with very few inter-chromosomal rearrangements, between Atlantic herring and even distantly related teleosts that have been separated from herring for hundreds of millions of years, and the frequent occurrence of intra-chromosomal rearrangements, a finding consistent with previous studies (Amores et al. 2014; Rondeau et al. 2014). There is a difference among vertebrate groups wherein fishes and birds usually show few inter-chromosomal rearrangements but frequent intra-chromosomal rearrangements. In contrast, there is an opposite trend among mammals, where often fairly closely related species like mouse and rat show many inter-chromosomal rearrangements (Coghlan et al. 2005).
Large-scale inversions and their evolutionary significance
In our previous studies (Martinez Barrio et al. 2016; Lamichhaney et al. 2017), using the scaffold-level assembly available at the time, it was indicated that small inversions were not a major contributor to differences between herring populations while the issue of larger, megabase-scale inversions was intractable given the scaffold length distribution. Using the improved assembly presented here, we now have clear evidence of selection acting on a supergene that is, in fact, a 7.8-Mb inversion. We were even able to identify a putative inversion breakpoint at position 17,826,318 bp on Chromosome 12. However, our data also illustrate how difficult it is to exactly define inversion breakpoints because they are often embedded in repeat regions.
Our observations fit a supergene model, where large essentially nonrecombining haplotypes allow accumulation of multiple causal variants synergistically affecting fitness. The divergence time between the two haplotype groups (Fig. 5D) cannot be accurately determined due to the ongoing genetic exchange between haplotype groups. However, the finding that the Pacific herring carries a separate haplotype limits the maximum age of the inversion to after the split of the two species, and the observed nucleotide divergence (0.2%) is lower than the genomic average (about 0.3%), which indicates that the putative inversion may be fairly recent. There is apparently ongoing genetic exchange between the inversion alleles as illustrated by the presence of many shared polymorphisms as well as recombinant haplotypes (Fig. 5E). It is likely that both double recombination and gene conversion contributes to this genetic exchange. It is, in fact, a characteristic feature of inversions that some recombination occurs between alleles, although it is severely suppressed. This feature is well documented for the inversion underlying the Rosecomb phenotype in domestic chicken (Imsland et al. 2012) and the inversion associated with variant mating strategies in the ruff (Küpper et al. 2016; Lamichhaney et al. 2016). In the herring, it is possible that the flanking inverted repeats have promoted recurrent inversion events, which would facilitate genetic exchange between haplotype groups.
The supergene contains 225 genes, with an additional approximately 10 genes located in flanking positions on the outside of the estimated breakpoint positions. Thus, it is difficult to determine which genes and/or variants contribute to the fitness effects of the inversion. However, based on the disruption of the local context, genes near the breakpoints are more likely to show altered gene regulation and are therefore listed in Supplemental Table S2. While it is currently not known what causes the fitness differences between the inversion variants in herring, it appears highly likely that it is related to ecological adaptation in relation to the water temperature during gonadal maturation before spawning or the water temperature at spawning/early larval development. There is a clear clinal variation of an increasing frequency of the Southern variant from north to south both in the East and West Atlantic (Fig. 6B,C).
The supergene on herring Chromosome 12 adds to the growing list of supergenes associated with morphological variation and ecological adaptation (Schwander et al. 2014). The first very early examples of supergenes under balancing selection were those detected by cytogenetic studies of polytene chromosomes in Drosophila (Dobzhansky and Sturtevant 1938). More recent examples include supergenes controlling mimicry in butterflies (Zhang et al. 2017), social behavior in fire ants (Wang et al. 2013), plumage variation and mating preferences in white-throated sparrows (Tuttle et al. 2016), and alternative male mating strategies in ruff (Küpper et al. 2016; Lamichhaney et al. 2016). Furthermore, five putative inversions ranging in size from 3.5 to 18.5 Mb have recently been associated with migratory behavior and geographical distribution in the Atlantic cod (Gadus morhua) (Berg et al. 2017). The present study shows how chromosome-based assemblies will facilitate the identification of many other similar examples of supergenes.
Methods
FALCON de novo assembly
Genomic DNA was fragmented to 20 kb using a DNA shearing device (Hydroshear, Digilab), and the sheared fragments were size-selected for the 7- to 50-kb size range using Blue Pippin (Sage Science). The sequencing library was prepared following the standard SMRTbell construction protocol (PacBio). The library was sequenced on 100 PacBio RSII SMRT cells using the P6-C4 chemistry. Raw data were imported into SMRT Analysis software 2.3.0 (PacBio). Subreads shorter than 500 bp or with a quality (QV) <80 were filtered out. The final data set contained 63.1 Gb of filtered subreads with N50 of 15.6 kb and was used for de novo assembly with FALCON (pb-falcon 0.2.4) (Chin et al. 2016). To further improve the assembly, we ran FALCON Unzip (pb-falcon 0.2.4) (Chin et al. 2016) followed by consensus calling using the Arrow algorithm. In order to remove highly heterozygous haplotypes assembled as separate primary contigs, we ran the Purge Haplotigs pipeline (v1.0.4) (Roach et al. 2018), which identifies and reassigns allelic contigs. The configuration file used for assembly constitutes Supplemental Text S1.
Hi-C library construction and sequencing
In situ Hi-C was conducted following the protocol provided by Rao et al. (2014) with minor modifications. The restriction endonuclease MboI was used to digest DNA, followed by biotinylated residue labeling. The Hi-C library was then sequenced on a BGISEQ-500 platform with pair-end sequencing using a read length of 50 bp. The raw number of reads was 656,695,125, out of which 98,838,909 provided useful Hi-C contact information.
Compiling the hybrid assembly
The FALCON-unzip assembly was processed through the Purge Haplotigs pipeline (Roach et al. 2018) in order to remove redundant sequences from the primary assembly. This procedure resulted in a de novo assembly with a total size of 792.6 Mb, a contig N50 of 1.61 Mb, comparable to the scaffold N50 (1.84 Mb) of the published v1.2 genome. Thus, the PacBio assembly achieves a similar level of organization while eliminating a substantial degree of uncertainty, as v1.2 contains close to 10% undetermined bases (Ns) as compared to zero Ns in the FALCON-unzip assembly.
Mapping with Juicer v1.5.6 (Durand et al. 2016b) yielded 99 million informative Hi-C read-pairs, which were used to scaffold the PacBio de novo assembly into chromosome-level organization using the 3D-DNA workflow pipeline (Dudchenko et al. 2017), followed by manual correction using Juicebox v1.9.8 (Durand et al. 2016a). The output assembly was polished using Pilon v1.22 (Walker et al. 2014), based on 50× Illumina paired-end coverage from the same individual. Finally, a custom R script (Supplemental Code S1; R Core Team 2015) was applied to eliminate a set of small, nearly identical repeats that were deemed likely to be redundant haplotypes based on analysis of the mapped read depth of a set of Illumina short reads from a previously sequenced herring population (Martinez Barrio et al. 2016). This procedure eliminated in total 6.9 Mb (removed fragments are available as Supplemental Data S1).
Annotation
The herring gene set was generated via the Ensembl Gene Annotation (Aken et al. 2016) and has been made available as part of Ensembl release 98 (expected October 2019). A detailed description of the annotation is available as Supplemental Text S2.
SNP chip genotyping
We previously designed a 60k Affymetrix SNP chip (Martinez Barrio et al. 2016). For this study, this SNP chip has been used to genotype two data sets: (1) a pedigree comprising two families with two parents and approximately 50 offspring each (Feng et al. 2017); and (2) 1170 individuals collected in the school project “Forskarhjälpen” in which students from 20 junior high schools from across Sweden contributed to research by collecting a sample of approximately 50 herring from one locality per school (Supplemental Table S3).
Construction of a high-resolution linkage map
Fifty full-sib progeny from the Atlantic family and 45 from the Baltic family were genotyped for about 45,000 SNPs using our previously described SNP-chip (Martinez Barrio et al. 2016). Linkage groups spanning the herring genome were constructed using these data and the Lep-MAP 2 (Rastas et al. 2013) software. The raw linkage groups were in overall concordance with the Hi-C assemblies, allowing each chromosome to be conclusively associated with a distinct linkage group. Based on this association, we were able to prune the marker set based on physical position, with the intent of controlling artificial map expansion while marinating coverage across the entire chromosome. The final, ordered linkage maps of each chromosome were calculated using CRI-MAP v2.5 (Green et al. 1990), and the locations of the markers used are shown in Figure 2, with detailed versions found in Supplemental Figure S1 and sex-specific maps found in Supplemental Table S1.
Linkage disequilibrium analysis and chromosome-wise recombination profiles
LD between markers was measured as correlation between genotypes, calculated using the “r2fast” method from the R-package GenABEL (Aulchenko et al. 2007). To estimate the recombination rates from population data, we applied the LDhat v2.2 package (Auton and McVean 2007) on genetic markers from 14 Baltic individuals phased using Beagle 4.0 (Browning and Browning 2007). The expected crossover events (ρ) between each pair of neighboring markers were calculated with the interval program for 1,000,000 iterations of the rjMCMC procedure with sampling every 2000 iterations. The first 50 iterations were discarded as burn-in. The block penalty 5 was determined after comparing output from simulations with block penalties of 5, 20, 50, and 100. The population recombination map was summarized by summing up the ρ from every 100-kb window, and only windows containing 50–2000 variable sites were included in the final map.
Identification of conserved synteny across teleosts
Whole-genome alignments were performed using Satsuma Chromosemble (Grabherr et al. 2010). The following genome versions were used: northern pike (Esox lucius): GCA_000721915.3 (Rondeau et al. 2014); threespine stickleback (Gasterosteus aculeatus): Gac-HiC_revised_genome_assembly (Peichel et al. 2017); guppy (Poecilia reticulata): GCA_000633615.2 (Künstner et al. 2016); zebrafish (Danio rerio): GCA_000002035.4; medaka (Oryzias latipes): GCA_002234695.1 (Ichikawa et al. 2017). The zebrafish genome is from the Genome Reference Consortium (Church et al. 2011).
Improvement of the TSHR gene model
Total RNA was extracted from the eye of a spring-spawning Atlantic herring using the RNeasy Mini kit (QIAGEN). Six micrograms of the isolated RNA was used for 5′ and 3′ RACE reactions with a FirstChoice RLM-RACE kit (Thermo Fisher Scientific). Nested RACE PCRs were performed in a 25-µL reaction containing 5× KAPA2G Buffer B, 0.24 mM dNTPs, 0.5 µM each of the forward and reverse primer, 1 U KAPA2G Robust DNA Polymerase (Kapa Biosystems), and 1 µL of the cDNA or Outer RACE PCR product as PCR template. Amplification was carried out with the following program: 95°C for 3 min, 35 cycles of 95°C for 15 sec, 58°C for 30 sec and 72°C for 30 sec, and a final extension of 5 min at 72°C. In order to confirm the obtained 5′ and 3′ cDNA ends from RACE reactions, cDNA was prepared using Oligo (dT)18 primer with a High-Capacity cDNA Reverse Transcription kit (Thermo Fisher Scientific). Then, nested PCR primers were designed in the 5′ and 3′ UTRs to amplify the whole coding region of TSHR. Targeted PCR products were purified from 1% agarose gel using a QIAquick Gel Extraction kit (QIAGEN) and Sanger-sequenced (Eurofins Genomics) with five primers to span the entire PCR product. All primers used for RACE reactions and full-length transcript validation are listed in Supplemental Table S4. In line with previous work on the herring genome, we follow the human gene nomenclature (https://www.genenames.org) in this paper such as TSHR.
Characterization of inversion breakpoints
In order to identify the breakpoints of the inversion, we used the BreakDancer software (Chen et al. 2009) on 46 individual sequenced samples independently. Reads with mapping quality above 30 were retained in the analysis. BreakDancer helped to narrow down the range of the potential breakpoints into 5 kb around the ends of the inversion. In an attempt to find the breakpoints at single-base level, we extracted soft-clipped reads and compared the normalized depths between samples carrying the Southern and Northern haplotypes around such reads. The visualization of short reads and clipped reads was performed in Integrative Genomics Viewer (IGV) (Robinson et al. 2017).
Data access
The assembly and RNA reads for annotations generated in this study have been submitted to the European Nucleotide Archive (ENA; https://www.ebi.ac.uk/ena) under accession number PRJEB31270. SNP-chip genotypes and associated auxiliary information constitute Supplemental Data S2, while Supplemental Code S1 contains the custom R scripts used.
Acknowledgments
This work was supported by the Knut and Alice Wallenberg Foundation, the Swedish Research Council, the Norwegian Research Council project 254774 (GENSINC), the Wellcome Trust (WT108749/Z/15/Z), and the European Molecular Biology Laboratory. We thank Carl-Johan Rubin and Kerstin Howe for valuable advice during the preparation of this assembly and all junior high school students that contributed to the project Forskarhjälpen.
Author contributions: L.A. designed the study. M.E.P. built the hybrid assembly and performed analysis. I.B. constructed the FALCON-assembly. G.F., X.H., Q.X., H.Z., S.L., and X.L. generated the Hi-C data set. A.F. cultivated fish and provided samples for linkage mapping. C.M.R. built the linkage map. F.H. generated the recombination profile and breakpoint estimation. J.H. performed GO analysis. J.C. refined the THSR gene model. O.W. assisted in assembly construction and performed experimental work. L.H., T.H., F.J.M., and P.F. performed annotation. M.E.P. and L.A. wrote the manuscript with input from others. All authors approved the final version of the manuscript.
Footnotes
-
[Supplemental material is available for this article.]
-
Article published online before print. Article, supplemental material, and publication date are at http://www.genome.org/cgi/doi/10.1101/gr.253435.119.
-
Freely available online through the Genome Research Open Access option.
- Received June 11, 2019.
- Accepted September 27, 2019.
This article, published in Genome Research, is available under a Creative Commons License (Attribution-NonCommercial 4.0 International), as described at http://creativecommons.org/licenses/by-nc/4.0/.


