
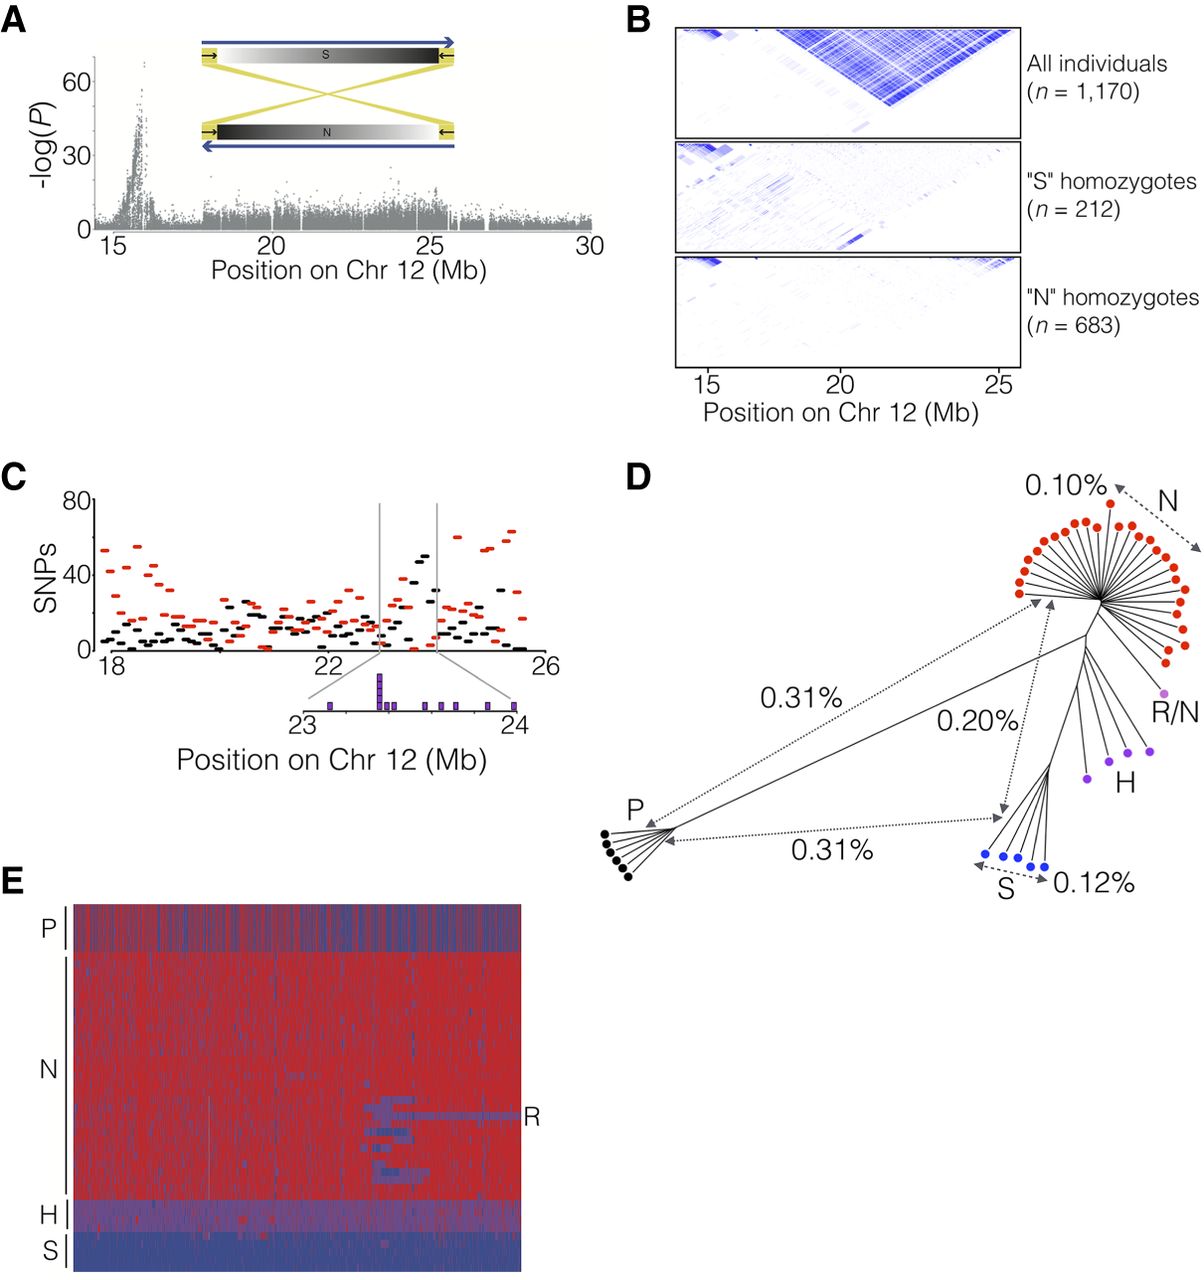
Identification of a 7.8-Mb inversion on herring Chromosome 12. (A) The spawning time contrast for Chromosome 12 highlights the block-like association pattern for the region from 17.9 to 25.6 Mb. The sketch shows the location of inverted repeats flanking the supergene. (B) LD patterns across the region in different groups of individuals sorted according to genotype for the putative inversion. (C) The distribution, as number of SNPs per 100 kb, of shared (black) and diagnostic (red) SNPs across the inversion region. Purple boxes (inset) are estimated locations of breakpoints in individuals that appear to carry a recombinant chromosome (see text). (D) Neighbor-joining tree based on genotypes for all SNPs in the inversion region called from individual whole-genome sequencing. The distances indicated across the tree are average nucleotide differences between haplotypes, either within groups (dashed) or between groups (solid). The letters designate the supergene type of the individual as follows: N = Northern homozygote; S = Southern homozygote; H = N/S heterozygote; R/N = individual carrying an N haplotype and a recombinant haplotype (see text); P = Pacific herring. (E) Heat map of the genotypes for diagnostic SNPs based on individual whole-genome sequencing. Supergene type of the samples is indicated as in D.


