
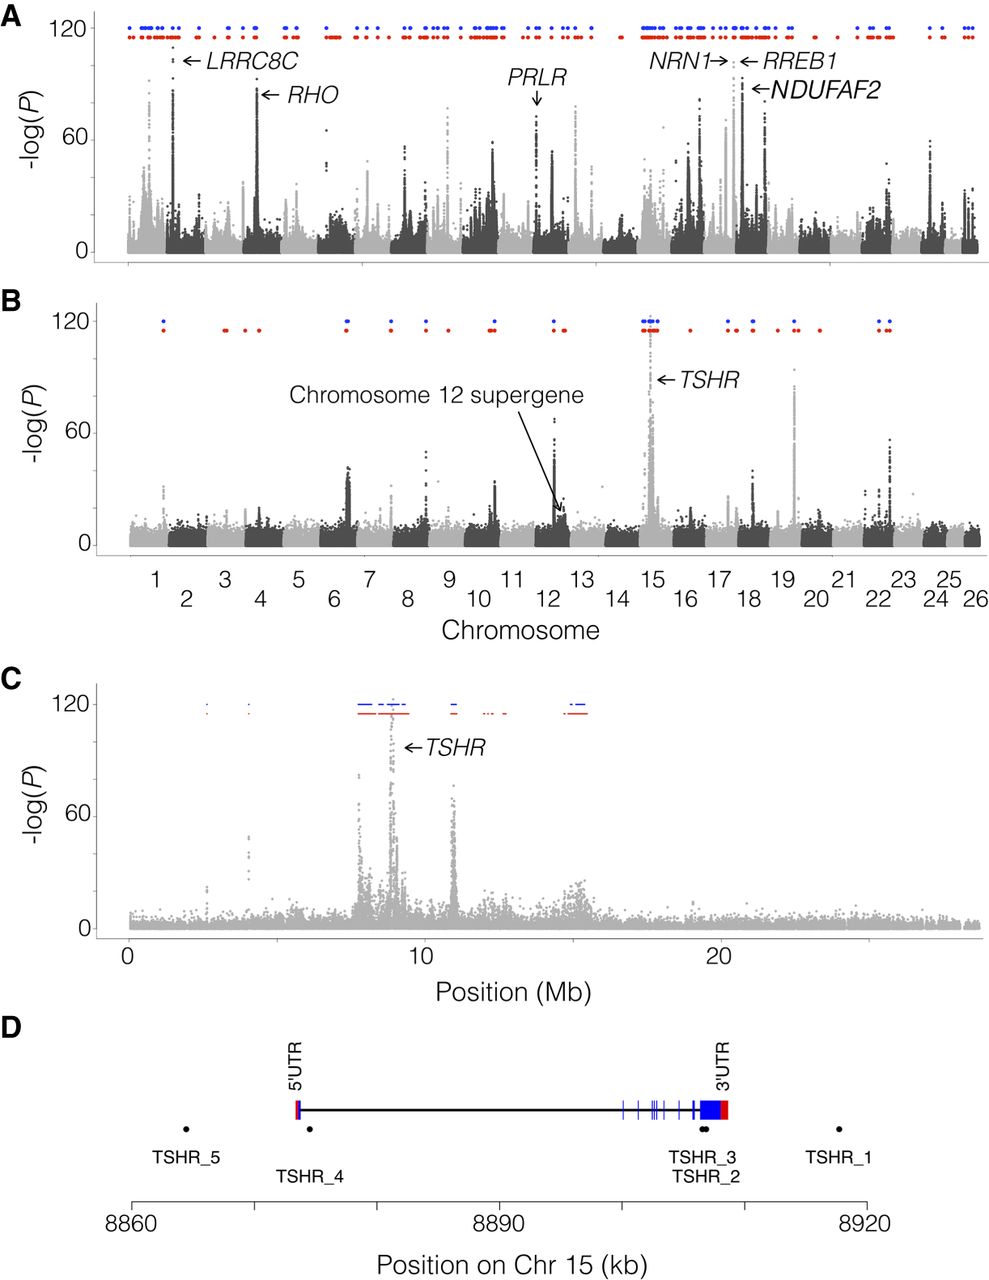
Signals of selections associated with ecological adaptation. The panels show the association, measured as –log(P) from χ2 tests on read counts of previously published data (Martinez Barrio et al. 2016) replotted along the new assembly. (A) Genetic differentiation between seven populations of Atlantic herring from the Atlantic Ocean, North Sea, Skagerrak, and Kattegat (salinity in the range 20–35 psu) and 10 populations from the Baltic Sea (salinity in the range 3–12 psu). (B) Genetic differentiation between 10 populations of spring-spawning herring versus three populations of autumn-spawning herring. In both panels, the blue and red dots indicate identified, independent regions of selection at a P-value cut-off of either 10−20 (blue) or 10−15 (red). (C) Zoom in on Chromosome 15 for the contrast based on differences in spawning time, which contains the most significant peak, located around TSHR. (D) Improved gene model of TSHR. TSHR_1 to 5 are selected SNPs showing highly significant association (P < 10−95) to spawning time and/or being nonsynonymous coding, while covering the extent of the THSR gene model.


