
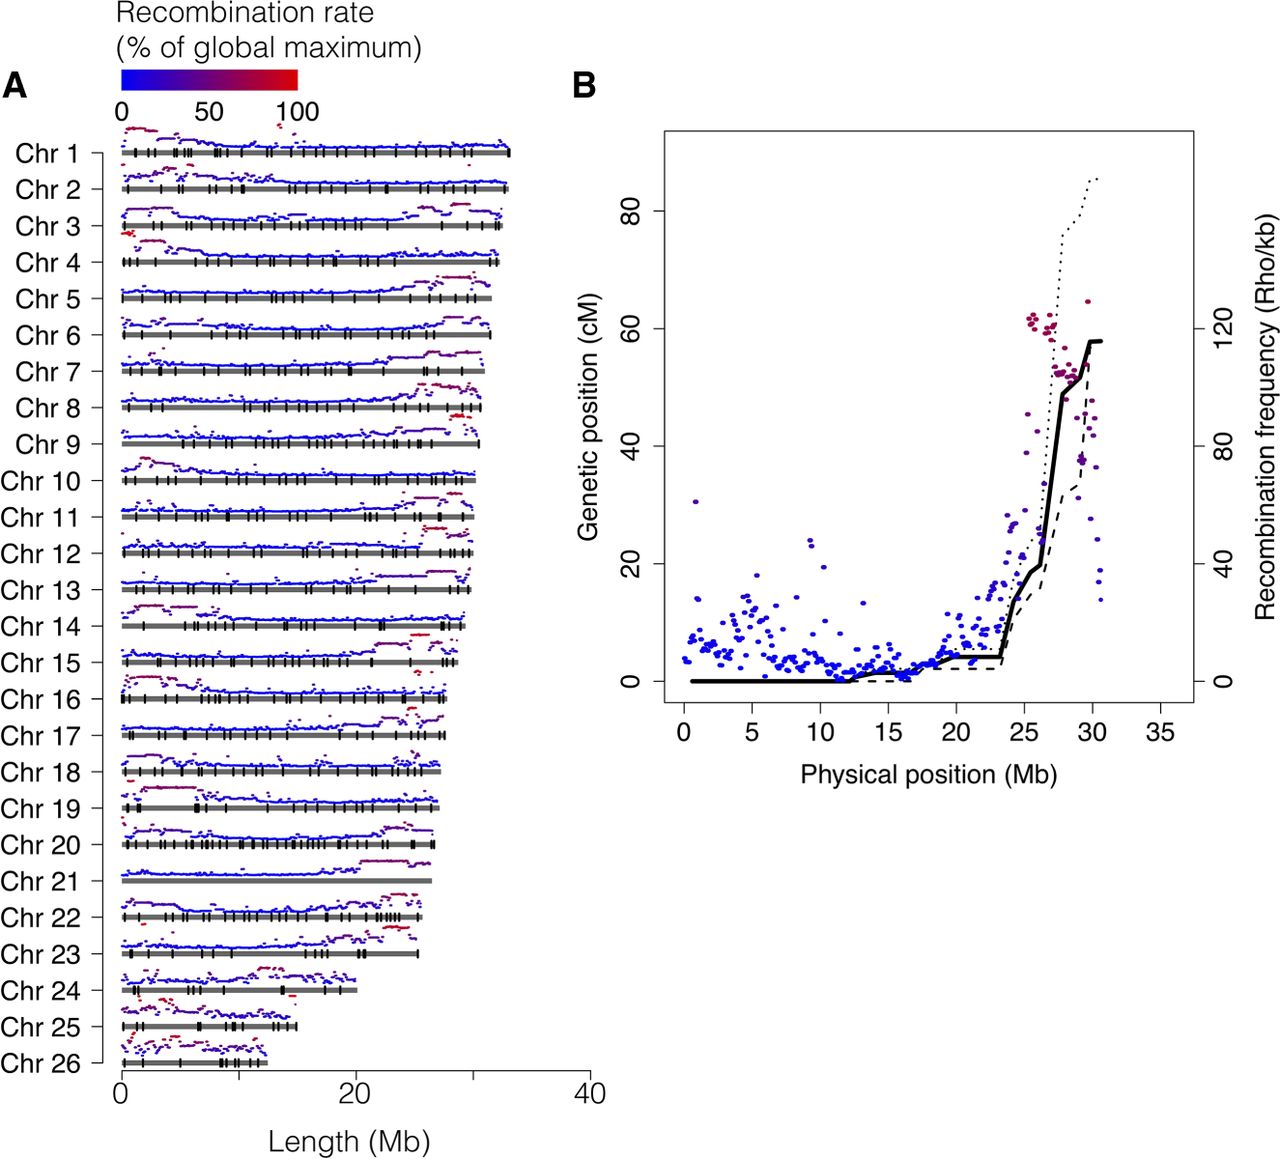
Figure 2.
Chromosome size distribution and recombination rate. (A) Physical extent of the assembly for each chromosome, with average recombination rate, in 100-kb windows, shown on top of each chromosome and markers used in the linkage map indicated as black bars. (B) Linkage map data (black lines) and recombination-rate profile (colored segments) for Chromosome 8. Solid line: sex-average; dashed line: male; dotted line: female.


