
TBR1 regulates autism risk genes in the developing neocortex
- James H. Notwell1,
- Whitney E. Heavner2,3,
- Siavash Fazel Darbandi4,
- Sol Katzman5,
- William L. McKenna6,
- Christian F. Ortiz-Londono6,
- David Tastad6,
- Matthew J. Eckler6,
- John L.R. Rubenstein4,
- Susan K. McConnell3,
- Bin Chen6 and
- Gill Bejerano1,2,7
- 1Department of Computer Science, Stanford University, Stanford, California 94305, USA;
- 2Department of Developmental Biology, Stanford University, Stanford, California 94305, USA;
- 3Department of Biology, Stanford University, Stanford, California 94305, USA;
- 4Department of Psychiatry, University of California, San Francisco, San Francisco, California 94143, USA;
- 5Center for Biomolecular Science and Engineering, University of California, Santa Cruz, Santa Cruz, California 95064, USA;
- 6Department of Molecular, Cell, and Developmental Biology, University of California, Santa Cruz, Santa Cruz, California 95064, USA;
- 7Division of Medical Genetics, Department of Pediatrics, Stanford University, Stanford, California 94305, USA
- Corresponding authors: bejerano{at}stanford.edu, bchen{at}ucsc.edu
Abstract
Exome sequencing studies have identified multiple genes harboring de novo loss-of-function (LoF) variants in individuals with autism spectrum disorders (ASD), including TBR1, a master regulator of cortical development. We performed ChIP-seq for TBR1 during mouse cortical neurogenesis and show that TBR1-bound regions are enriched adjacent to ASD genes. ASD genes were also enriched among genes that are differentially expressed in Tbr1 knockouts, which together with the ChIP-seq data, suggests direct transcriptional regulation. Of the nine ASD genes examined, seven were misexpressed in the cortices of Tbr1 knockout mice, including six with increased expression in the deep cortical layers. ASD genes with adjacent cortical TBR1 ChIP-seq peaks also showed unusually low levels of LoF mutations in a reference human population and among Icelanders. We then leveraged TBR1 binding to identify an appealing subset of candidate ASD genes. Our findings highlight a TBR1-regulated network of ASD genes in the developing neocortex that are relatively intolerant to LoF mutations, indicating that these genes may play critical roles in normal cortical development.
Exome sequencing studies have probed the genetic architecture underlying ASD by identifying mutations in ASD probands but not their unaffected family members. From a cohort of 1043 families assembled from four previous ASD exome sequencing studies (Iossifov et al. 2012; Kong et al. 2012; Neale et al. 2012; O'Roak et al. 2012), with an additional 56 quartets from the Simons Simplex collection (Willsey et al. 2013), Willsey and colleagues collected nine genes with two or more de novo loss-of-function (LoF) mutations in unrelated ASD probands. Because genes with recurrent de novo LoF mutations in ASD probands were identified as high-confidence ASD genes, we will refer to these nine genes as the “high-confidence (hc) Willsey” subset. The authors also identified 122 genes with a single de novo LoF mutation among ASD probands, which we term “probable (p) Willsey.” Two subsequent large-scale studies, which expand the cohorts used in earlier studies, have implicated additional genes with recurrent de novo LoF mutations among ASD probands. The first study by Iossifov et al. reported 27 genes with recurrent de novo likely-gene-disrupting mutations (we refer to this set as “hcIossifov”) and an additional 326 genes with a single de novo likely-gene-disrupting mutation (“pIossifov”) (Iossifov et al. 2014). In the second large study, De Rubeis et al. reported recurrent de novo LoF mutations in 18 genes (“hcDeRubeis”) and a single de novo LoF mutation in 257 genes (“pDeRubeis”) (Table 1; De Rubeis et al. 2014).
High-confidence and probable ASD gene counts
Together, these three studies identified a total of 35 high-confidence ASD genes, providing intriguing glimpses into the genetic and molecular basis for ASD (Table 1). Functional characterization of these high-confidence ASD genes has revealed an enrichment for genes that are expressed embryonically (Iossifov et al. 2014) and are involved in synapse formation, transcriptional regulation, and chromatin remodeling (De Rubeis et al. 2014). Furthermore, co-expression networks seeded by high-confidence ASD genes that are enriched for probable ASD genes converge on deep-layer projection neurons at midfetal stages of cortical development (Willsey et al. 2013), while other work has also implicated the superficial cortical layers (Parikshak et al. 2013). Discovering additional insights into the developmental and functional mechanisms of these genes, especially shared roles, remains a significant challenge. While these three studies also identified hundreds of probable ASD genes, these represent a combination of true ASD genes and genes with incidental LoF mutations that do not contribute to ASD, given that benign LoF variants are observed in healthy individuals (MacArthur and Tyler-Smith 2010). Many of the non-ASD genes with incidental LoF mutations may be more tolerant of such mutations. Therefore, another important challenge is determining which of the probable ASD genes contribute to ASD.
One of the high-confidence ASD genes identified in all three studies is TBR1, a T-box transcription factor (TF) that plays a critical role in regulating the differentiation and identity of deep-layer projection neurons in the developing neocortex (Hevner et al. 2001; Leone et al. 2008; Bedogni et al. 2010; Han et al. 2011b; McKenna et al. 2011). The de novo TBR1 mutations found in ASD patients can cause changes in the transcriptional regulation and cellular localization of TBR1, as well as its interactions with coregulators such as CASK and FOXP2 (Deriziotis et al. 2014). In humans, patients with microdeletions of the 2q24 region, which encompasses TBR1, exhibit intellectual disability and developmental delay (Traylor et al. 2012). In mice, Tbr1 haploinsufficiency results in defective axonal projections and impairments of social interactions, ultrasonic vocalization, associative memory, and cognitive flexibility (Huang et al. 2014). Strikingly, TBR1 transcriptionally regulates Grin2b (Chuang et al. 2014), another high-confidence ASD gene that encodes a subunit of the NMDA receptor, a major class of excitatory glutamate receptors in the central nervous system (Dingledine et al. 1999). These observations raise the possibility that TBR1 regulates other ASD genes that are expressed during cortical development. Here, we test this hypothesis by assessing the binding of TBR1 near ASD genes using ChIP-seq, examining their expression in Tbr1 mutant mice, and analyzing the frequency of LoF mutations within them in reference human populations of individuals without ASD.
Results
TBR1 binds near high-confidence ASD genes in the developing neocortex
To test the hypothesis that ASD genes are transcriptionally regulated by TBR1, we performed ChIP-seq for TBR1 on mouse whole cortex dissected from embryonic day 15.5 (E15.5) embryos, a stage at which deep cortical layers already have been generated and are completing their migration (McConnell 1991; Molyneaux et al. 2007), and identified 7324 TBR1 ChIP-seq peaks (see Methods). These peaks significantly overlap TBR1 ChIP-seq in N2A cells (P-value: 4.0 × 10⁻⁴) (Han et al. 2011b; see Methods) and are highly enriched for the known TBR1 motif (E-value: 8.3 × 10−101) (Jolma et al. 2013; Supplemental Fig. S1; see Methods). In addition, our TBR1 ChIP-seq peaks were enriched for overlapping the active enhancer marks H3K27ac (P-value < 1.0 × 10⁻⁴) and H3K4me1 (P-value < 1.0 × 10⁻⁴), as well as H3K9me3 (P-value = 2.0 × 10⁻³) and H3K27me3 (P-value < 1.0 × 10⁻⁴) (see Methods), marks associated with repressed chromatin states, assayed in mouse E14.5 whole brain (The ENCODE Project Consortium 2012); this suggests possible roles for TBR1 as both a transcriptional activator and repressor. When we examined Grin2b and Auts2, ASD genes that are regulated by TBR1 (Bedogni et al. 2010; Chuang et al. 2014), we observed multiple adjacent TBR1 ChIP-seq peaks (Fig. 1A). To associate TBR1 peaks with their putative target genes, we used the established Genomic Regions Enrichment of Annotations Tool (GREAT) (McLean et al. 2010) with default parameters (see Methods) and found the majority of peaks were distal to their associated transcription start sites (Supplemental Fig. S2). We then mapped each of the high-confidence and probable ASD genes to their mouse orthologs (Supplemental Fig. S3; see Methods) and used GREAT to test whether TBR1 was enriched for binding near the high-confidence ASD genes, given the number of TBR1 peaks and the size of the genomic regions used by GREAT to associate peaks with their adjacent genes. For each set of ASD genes, we calculated a binomial P-value that reflects the significance of the number of peaks adjacent to these genes, as well as a hypergeometric P-value that reflects the significance of the number of these genes with adjacent peaks (McLean et al. 2010).
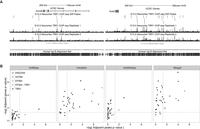
TBR1 binds near high-confidence ASD genes. (A) Regulatory domains of Grin2b with eight adjacent TBR1 ChIP-seq peaks and Auts2 with 22 adjacent TBR1 ChIP-seq peaks. (B) Significance of the number of TBR1 ChIP-seq peaks adjacent to each high-confidence ASD gene set given the total number of peaks and size of the genomic regions used to associate peaks with their adjacent genes (the negative logarithm of the GREAT binomial P-value; x-axis) compared to the significance of the number of high-confidence ASD genes with an adjacent TBR1 peak given the total number of genes with an adjacent TBR1 peak (negative logarithm of the GREAT hypergeometric P-value; y-axis). Enrichment compared to E14.5 neocortex EP300 ChIP-seq, E15.5 neocortex SATB2 ChIP-seq, and 28 ENCODE ChIP-seq sets including tissues at different developmental time-points and primary cell lines. Dashed gray lines represent P = 0.05 significance level.
TBR1 bound 27 regions adjacent to six of the nine hcWillsey genes (67%, binomial P-value: 1.69 × 10⁻⁵, hypergeometric P-value: 1.59 × 10⁻²), 66 regions adjacent to 20 of 27 hcIossifov genes (74%, binomial P-value: 2.03 × 10⁻⁴, hypergeometric P-value: 5.90 × 10⁻⁷), and 42 regions adjacent to 12 of 17 hcDeRubeis genes (71%, binomial P-value: 1.35 × 10⁻³, hypergeometric P-value: 2.55 × 10⁻⁴) (Fig. 1B). In addition, when we merged the high-confidence gene sets, we found that TBR1 bound 82 regions adjacent to 25 of the 34 high-confidence ASD genes (74%, binomial P-value: 1.11 × 10⁻⁴, hypergeometric P-value: 2.81 × 10⁻⁸). We previously performed ChIP-seq in E14.5 neocortex for EP300 (Wenger et al. 2013), a transcriptional co-activator that marks active enhancers, and ChIP-seq in E15.5 neocortex for SATB2 (McKenna et al. 2015), another master regulator of cortical development. The TBR1 high-confidence ASD gene enrichment is stronger, by either the binomial or hypergeometric test, than the enrichments for EP300 or SATB2. Furthermore, when the EP300 peaks overlapped by TBR1 are removed, the remaining EP300 peaks show no statistical enrichment for two of the three high-confidence ASD gene lists (Fig. 1B). In addition, the ENCODE Project Consortium performed ChIP-seq for nine transcription factors in different subsets of 20 primary cells and tissues from mouse (The ENCODE Project Consortium 2012). This includes brain-related tissues, including E14.5 whole brain, 8-wk olfactory bulb, 8-wk cerebral cortex, and 8-wk cerebellum. TBR1 is more enriched for binding adjacent to every high-confidence ASD gene set, by either the binomial or hypergeometric statistic, than each of the ENCODE ChIP-seq experiments (Fig. 1B; Supplemental Table S1). As TBR1 is enriched adjacent to each high-confidence gene set individually, as well as the merged set, we used the merged set of high-confidence ASD genes for all subsequent analyses. Together, these results suggest that the enrichment for TBR1 peaks adjacent to high-confidence ASD genes is not the consequence of these ASD genes being actively transcribed in the neocortex but a specific property of TBR1.
Giving rise to these enrichments, TBR1 binding reflects a particularly dense pattern of regulation. In addition to using GREAT to measure the enrichment of our TBR1 ChIP-seq peaks adjacent to a set of genes, we can also use GREAT to measure the significance of observing a given number of peaks next to each gene individually. Doing so, we observe as many as 10 TBR1 ChIP-seq peaks adjacent to a single high-confidence ASD gene (Dscam; GREAT binomial P-value: 3.58 × 10⁻⁴), eight peaks adjacent to the previously known target Grin2b (GREAT binomial P-value: 7.25 × 10⁻³) (Fig. 1A), and an average of more than two adjacent TBR1 ChIP-seq peaks per high-confidence ASD gene overall. In our previous study of E14.5 mouse neocortex, we observed that Auts2 has 29 adjacent EP300 ChIP-seq peaks (Wenger et al. 2013). In this study, we found that Auts2 has 22 adjacent TBR1 peaks (GREAT binomial P-value: 1.12 × 10⁻¹¹) (Fig. 1A).
Gene co-expression, protein-protein interactions, and combinations of these together with candidate genes have been used to construct gene modules that were enriched for ASD genes. Parikshak et al. constructed gene networks from gene expression data collected by RNA-seq. Their M3 module was enriched for DNA binding and transcriptional regulation; it also included TBR1 among 996 genes and was one of two modules significantly enriched for rare de novo variants from ASD probands and superficial cortical layers (Parikshak et al. 2013). Six hundred sixty-two of our TBR1 ChIP-seq peaks were enriched for binding adjacent to genes from this module, but the 228 genes with adjacent peaks were not significant (GREAT binomial P-value: 5.77 × 10⁻¹⁶, GREAT hypergeometric P-value: 0.30). In contrast, Li et al. constructed networks from protein interaction data; they identified a group of genes, termed module #13, that included TBR1 among 119 genes, which was one of two modules enriched for ASD genes and included genes expressed ubiquitously throughout the brain and in the corpus callosum (Li et al. 2014). Our TBR1 ChIP-seq peaks were not enriched for binding adjacent to genes from this module, but the 65 genes with adjacent peaks were significant (GREAT binomial P-value: 0.24, GREAT hypergeometric P-value: 1.18 × 10⁻¹⁰). Finally, Hormozdiari et al. used a combination of co-expression, protein-protein interactions, and genes with mutations enriched in ASD and intellectual disability cases but not controls. Their M1 extended network included TBR1 among 80 genes and was associated with chromatin remodeling and the Wnt and Notch signaling pathways (Hormozdiari et al. 2015). Here, we observed no significant enrichment (GREAT binomial P-value: 0.35, GREAT hypergeometric P-value: 0.18), possibly due to the inclusion of missense mutations or genes mutated in individuals with intellectual disability. Together, these reflected less consistent enrichments than those for the high-confidence ASD genes.
High-confidence ASD genes are misregulated in Tbr1 KOs
To determine whether TBR1 binding affects the expression of putative target genes, we first analyzed published microarray data to investigate differences in gene expression between Tbr1+/+ and Tbr1−/− E14.5 mouse whole neocortex (Bedogni et al. 2010). Differentially expressed probes corresponded to 1784 of 21,524 genes (8%) assayed on the array (see Methods). TBR1 ChIP-seq peaks were significantly enriched adjacent to the differentially expressed genes (658 genes, GREAT binomial P-value: 1.59 × 10⁻²⁹, GREAT hypergeometric P-value: 3.54 × 10−36). After excluding Tbr1 itself from the merged gene list, we found that 15 of the 33 high-confidence ASD genes (45%, hypergeometric P-value: 1.39 × 10⁻⁸) showed altered expression in Tbr1 mutant cortices at E14.5 (Table 2; see Methods). Overall, the microarray differentially expressed genes were congruent with the high-confidence genes that had adjacent TBR1 ChIP-seq peaks (excluding Tbr1): 12 of 15 differentially expressed high-confidence ASD genes had at least one adjacent TBR1 ChIP-seq peak (80%, hypergeometric P-value: 1.68 × 10⁻⁵) (Table 2). Together, these results suggest that TBR1 binding influences high-confidence ASD gene expression and is likely a direct transcriptional regulator of high-confidence ASD genes in the developing neocortex.
High-confidence ASD genes are misregulated in Tbr1 knockouts
TBR1 regulates the expression of genes in specific layers of the developing cortex (Bedogni et al. 2010). Because microarray profiling integrates signals from cells throughout the whole cortex and is not intended to detect changes in subpopulations of cells, we examined the spatial patterns of gene expression in Tbr1 mutant cortices using in situ hybridization. Here, we focused our analyses on nine high-confidence ASD genes (not including Tbr1 itself) supported by at least three studies: seven from the intersection of the three high-confidence ASD gene lists (ANK2, CHD8, DYRK1A, GRIN2B, KATNAL2, POGZ, SCN2A), and an additional two omitted by Willsey et al. (2013) (ADNP, ARID1B) but supported by Iossifov et al. (2014), De Rubeis et al. (2014), and earlier studies (O'Roak et al. 2011, 2012; Krumm et al. 2014).
Tbr1 is expressed soon after cortical neurons begin to differentiate and is most highly expressed in early-born neurons of the preplate, Cajal Retzius neurons, and layer 6 (Fig. 2; Bulfone et al. 1995). Our in situ experiments revealed that four high-confidence ASD genes that are expressed throughout the cortical plate are significantly reduced in the brains of Tbr1−/− mice at E15.5: Arid1b, Ank2, Scn2a1, and Grin2b (Fig. 2A; Supplemental Fig. S5A). Grain counts were performed to quantify in situ differences in expression (see Methods; Fig. 2A,B). We also examined Tbr1 knockout mice at postnatal day 0 (P0), when distinct cortical laminae are visible. We observed Arid1b expression, which is restricted to layer 5, to significantly decrease in the knockout at P0 (Fig. 2B; Supplemental Figs. S4, S5B). In addition, Ank2, which is expressed throughout the cortex, and Scn2a1, which is enriched in the deep cortical layers, both showed an increase in expression throughout the cortex in the P0 Tbr1 knockout (Fig. 2B; Supplemental Figs. S4, S5B). Three additional genes, Adnp, Dyrk1a, and Pogz, are expressed diffusely throughout the cortical layers of controls but specifically increase in expression in the deep layers of P0 Tbr1 knockouts (Fig. 2B; Supplemental Figs. S4, S5B). Collectively, the in situ hybridization analysis from these two time points showed that seven of the nine high-confidence ASD genes (excluding Tbr1) were misexpressed in the Tbr1 knockouts. In addition, the two genes which are not misexpressed, Chd8 and Katnal2, lacked adjacent TBR1 ChIP-seq peaks, while all of the misexpressed genes, with the exception of Pogz, had one or more adjacent peaks. Thus, together with the ChIP-seq data, these results are consistent with the role of TBR1 as a direct transcriptional regulator of high-confidence ASD genes in the developing neocortex.
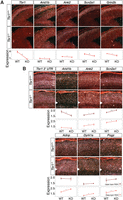
TBR1 is necessary for ASD gene expression in specific cortical lamina. Radioactive in situ hybridization (RISH) of high-confidence genes at E15.5 (A) and P0 (B) in Tbr1+/+ and Tbr1−/− cortices reveal expression differences. RISH expression (lines in shades of red) corresponds to normalized grain counts (see Methods), and significance was determined using the two-sided t-test (n = 3–6 sections encompassing three samples per genotype) (see Methods). E15.5 cortical plate (red), P0 upper layers (brown), and P0 deep layers (pink). Upper layers correspond to layers 2–5 and deep layers correspond to layer 6 (see Methods). Error bars represent SD. (*) P-value < 0.05; (**) P-value < 0.01; (***) P-value < 0.001.
TBR1 binds near highly co-expressed genes
In addition to being significantly enriched for binding adjacent to genes differentially expressed from the Tbr1 knockout microarray experiments, we also turned to the Allen Brain Atlas to identify co-expressed genes. We identified human genes with mouse orthologs that had patterns of expression correlated with TBR1 (r ≥ 0.8). TBR1 was highly enriched for binding adjacent to these genes, with 157 peaks adjacent to 51 of 87 genes (59%, GREAT binomial P-value: 5.89 × 10⁻¹¹, GREAT hypergeometric P-value: 9.01 × 10⁻¹⁰), further supporting the role of TBR1 as an upstream regulator.
TBR1 target genes are depleted for LoF mutations
The heterozygous nature of de novo LoF mutations (Iossifov et al. 2014) suggests that the affected genes were haploinsufficient and that putative ASD genes are under strong selective pressure. To test this idea, we examined the frequency of LoF mutations in ASD genes in a large control population from the Exome Aggregation Consortium (ExAC), which aggregated exome sequencing data from 60,706 unrelated individuals, excluding individuals diagnosed with severe pediatric diseases (Exome Aggregation Consortium et al. 2015). For each gene in the ExAC Browser, we computed the proportion of mutations that were LoF (fraction LoF; by computing the proportion of mutations that are LoF, we control for gene length and sequence context) (see Methods; Supplemental Table S2) to assess the frequency of LoF alleles. We discovered that high-confidence ASD genes were depleted for LoF mutations (Fig. 3A). Furthermore, TBR1 was the only high-confidence ASD gene in which no LoF mutations were observed in the ExAC population.
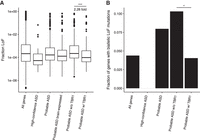
Probable ASD genes that are TBR1 targets are more depleted for ExAC LoF mutations and biallelic LoF mutations in Icelanders. (A) Box plots depicting the distributions of fraction LoF scores for each gene from the ExAC reference population (y-axis) for merged ASD gene lists (x-axis). Probable ASD genes with adjacent TBR1 ChIP-seq peaks in the developing cortex have lower fraction LoF scores than those without an adjacent TBR1 peak. A pseudocount of one LoF allele for 121,412 sampled alleles, the maximum number sampled at any locus, was included for each gene for visualization purposes. Significance was determined using the one-sided two-sample Wilcoxon test. (B) The fraction of genes in each gene list with biallelic mutations in a study of Icelandic individuals (Sulem et al. 2015). Significance was determined using the one-sided Fisher's exact test. (*) P-value < 0.05; (***) P-value < 0.001.
As discussed above, the probable ASD genes are thought to be a combination of true ASD genes, as well as unrelated incidental findings. We found that the probable ASD genes were skewed toward a higher fraction of LoF alleles in the ExAC population (Fig. 3A). Previous estimates suggested that only half of the probable ASD genes represented true ASD risk genes (Willsey et al. 2013). We used our TBR1 ChIP-seq results to divide the probable ASD genes with mouse orthologs into two groups: those with and those without a TBR1 ChIP-seq peak adjacent to their ortholog (173 of 464 probable ASD genes had adjacent ChIP-seq peaks) (Supplemental Table S3). We then compared the probable ASD genes having at least one adjacent TBR1 ChIP-seq peak to the remaining genes and found that the genes having adjacent TBR1 ChIP-seq peak(s) were over twofold depleted for LoF mutations (two-sample Wilcoxon P-value: 3.87 × 10⁻⁶ and fold of medians: 2.28) (Fig. 3A). In addition, the genes having at least one adjacent TBR1 ChIP-seq peak were nominally depleted for LoF mutations compared to brain expressed genes (two-sample Wilcoxon P-value: 0.11 and fold of medians: 1.33), although this was a harsh comparison due to overlap between the two sets. We observed the same trends when using a different mutation tolerance metric, the Residual Variation Intolerance Scores (RVIS) (Petrovski et al. 2013; Supplemental Fig. S6; see Methods). Therefore, TBR1 binding allowed us to identify an appealing subset of probable ASD genes that were less tolerant to LoF alleles, as reflected by a lower fraction LoF in the reference data set (Table 3).
Probable ASD genes that are neocortical transcriptional targets of TBR1 and less tolerant to LoF alleles
TBR1 target genes have fewer biallelic LoF mutations
More than a thousand nonessential genes with homozygous or compound heterozygous LoF mutations have been identified by genomic sequencing of 2636 individuals and genotyping of an additional 101,584 subjects in Iceland, who were selected because they were affected by common diseases of adulthood (Sulem et al. 2015). We investigated whether ASD genes, particularly those regulated by TBR1, were less likely to have biallelic LoF mutations in this population. None of the high-confidence ASD genes had biallelic LoF mutations in the Icelandic population (Fig. 3B). As above, we split the lists of probable ASD genes with mouse orthologs into those with and without a TBR1 ChIP-seq peak adjacent to their ortholog (Supplemental Table S3). Genes with adjacent TBR1 peaks were less likely to show biallelic LoF mutations when compared to those without, with an odds ratio of 0.37 (Fisher's exact test P-value: 1.05 × 10⁻²) (Fig. 3B). These results provide additional evidence that TBR1 regulates a group of ASD genes that are intolerant to LoF mutations.
Discussion
Statistical evidence has suggested that between 300 and 1000 genes could confer increased ASD risk (Krumm et al. 2014). Discovering high-confidence ASD genes is a significant challenge, however, because recurrent mutations in any given gene are uncommon (Yu et al. 2013). Recent exome sequencing studies on large cohorts composed of thousands of individuals have revealed 35 high-confidence ASD genes with recurrent de novo LoF mutations. Among these is TBR1, a master regulator of cortical development. Our study reveals that many high-confidence ASD genes have the shared mechanism of being direct transcriptional targets of TBR1 in the developing neocortex. This regulation is due to distal TBR1 binding and reflects a particularly dense pattern of regulation, which we have previously found to identify important genes for cortical development (Wenger et al. 2013). In addition to showing that TBR1 regulates ASD genes, our study reveals the regulatory sequences that are bound by TBR1, which will likely be useful for interpreting noncoding ASD variants.
Our observations were made during cortical neurogenesis, highlighting the developing neocortex as a brain region relevant to ASD. The increase of high-confidence ASD gene expression in the deep layers of the Tbr1 mutants is consistent with the role of TBR1 as a regulator of deep-layer cortical identity and calls attention to deep-layer cortical neurons, which have previously been implicated in ASD (Willsey et al. 2013). This is in contrast to the less consistent enrichments of TBR1 peaks adjacent to genes that were part of modules enriched for ASD genes from other studies (Parikshak et al. 2013; Li et al. 2014; Hormozdiari et al. 2015). TBR1 has known roles in the neocortex as both an activator (i.e., of Auts2) (Bedogni et al. 2010) and a repressor (i.e., of Fezf2) (Han et al. 2011a; McKenna et al. 2011), which explains the up- and down-regulation of different genes in Tbr1 mutant mice and is consistent with the enrichments we observed for both active and repressed chromatin marks. Given that the mutations observed in ASD probands are presumed LoF, the fact that TBR1 acts as a repressor may be surprising. At E15.5, however, all of the genes with observed changes in expression were down-regulated in the Tbr1 mutants, suggesting that early corticogenesis may be a key time point in ASD pathology. In addition, the aberrant expression of these genes in the Tbr1 mutants, up or down, may reflect the importance of their levels of activity in the deep cortical layers. We also observed instances of the same gene being activated and repressed by TBR1, i.e., Ank2 and Scn2a1, at different time points. In addition to observing this in a previous study (McKenna et al. 2015), the fact that we observe the same trend of activation and repression across RISH in situ, DIG in situ, and RT-qPCR gives us confidence that such temporal changes in regulation are possible, perhaps due to different roles of TBR1 in different cell types, but understanding this phenomenon will require further study. Finally, the changes in expression were observed in homozygous mutant mice, whereas the LoF mutations observed in ASD probands affect a single allele. Given the haploinsufficient nature of TBR1, we expect the changes to gene expression in the heterozygous model to be more subtle, yet still relevant to the pathology of ASD.
TBR1's role as a master regulator of cortical development has long made it a candidate regulator of ASD genes (Bedogni et al. 2010; Chuang et al. 2015); here, we measure its binding genome-wide in the developing cortex and confirm its role in regulating other high-confidence ASD genes for the first time. The enrichment of TBR1 ChIP-seq peaks adjacent to high-confidence ASD genes suggests that TBR1 can be used to select a subset of probable ASD genes that are less tolerant to LoF alleles and could be more relevant to ASD (Table 3). Testing this hypothesis required a method to compare the relative tolerance of different genes to mutations. A previous study found that exons that were highly expressed in the brain and contained relatively few nonsynonymous mutations were enriched for de novo mutations found in ASD probands (Uddin et al. 2014). This methodology, however, failed to produce significant findings for entire genes. Recurrent de novo LoF mutations found in the same gene among ASD probands are thought to identify high-confidence ASD genes due to the differing rates of de novo LoF mutations in affected versus unaffected siblings (Iossifov et al. 2014). In addition, the pattern of LoF mutations observed in ASD exome sequencing studies suggests that these mutations are heterozygous (Iossifov et al. 2014) and that the evidence of selection may be visible by examining allele frequencies in a large reference population, such as the one compiled by ExAC. We captured these observations in the fraction LoF metric, which controls for length, GC-bias, and other factors by measuring the rate of LoF mutations relative to all mutations. Using this metric, we confirm our hypothesis and show that TBR1 can be used to select an appealing subset of probable ASD genes that are less tolerant to LoF alleles and could be more relevant to ASD. Against the background of all probable ASD genes, the mouse orthologs of probable ASD genes with at least one adjacent TBR1 ChIP-seq peak are most enriched for encoding proteins located in the synapse, the same enrichment observed by De Rubeis et al. (2014), across all of the Gene Ontology (GO) (Gene Ontology Consortium 2015); out of 22 probable ASD gene orthologs annotated with synapse, 18 have at least one adjacent TBR1 peak (Bonferroni hypergeometric P-value: 1.38 × 10⁻²) (Supplemental Table S4). Above, we examined the enrichment of TBR1 ChIP-seq peaks adjacent to the genes in previously discovered autism gene modules. We can also look at the overlap of only the probable ASD genes with at least one adjacent TBR1 ChIP-seq peak and these different gene modules; we find this subset of genes enriched in the networks identified by Parikshak et al. (15 genes, hypergeometric P-value: 2.66 × 10⁻⁴), Li et al. (4 genes, hypergeometric P-value: 6.60 × 10⁻³), and Hormozdiari et al. (8 genes, hypergeometric P-value: 5.81 × 10⁻⁸), suggesting a level of molecular convergence (Parikshak et al. 2013; Hormozdiari et al. 2015; Li et al. 2015). In addition, we observed that high-confidence ASD genes are strongly depleted for LoF mutations and never have biallelic LoF mutations in the sequenced Icelandic population (Sulem et al. 2015). TBR1 is also the only high-confidence ASD gene with no LoF mutations in the ExAC population, providing additional evidence that this gene is under strong selective pressure.
Protein-protein interaction networks previously have been proposed to identify novel ASD candidate genes based on their proximity and connectivity to high-confidence ASD genes, forming an iterative process by which genetics and interaction networks mutually inform (Krumm et al. 2014). Based on the current study, being a target of TBR1 in the developing cortex and having a low LoF mutation burden can be used as signals for the prioritization of probable ASD genes for targeted resequencing and study in animal models. TBR1 binding and the fraction LoF metric allow for the reinterpretation of even high-confidence ASD genes. KATNAL2, a high-confidence ASD gene for which we find no evidence of TBR1 regulation, has a fraction LoF that is almost an order of magnitude higher than all other high-confidence ASD genes, suggesting that the recurrent de novo mutations in this gene reflect weak constraint rather than essential function in ASD. A recent study showed that LoF variants in KATNAL2 were passed from an unaffected mother to their unaffected male child, reinforcing this point (Iossifov et al. 2015). This methodology may even be applied to genes that have not been previously implicated in ASD. For example, CTNND2 was recently implicated as a critical gene in autism based on studies of female-enriched multiplex families (Turner et al. 2015) but was not found in any of the gene lists used for the current study. Its mouse ortholog has seven adjacent TBR1-bound regions and a low LoF burden. Our methodology highlights a small set of probable ASD genes with similar properties, including well-known cortical genes such as NFIA, NFIB, ZBTB18, CUX2, and LRP6, as well as attractive candidates such as MYT1L and PBX1 (Table 3). Together, our findings highlight a TBR1-regulated network of ASD genes in the developing neocortex that are relatively intolerant to LoF mutations, indicating that these genes may play critical roles in normal cortical development.
Methods
Animals
All animal work was carried out in compliance with the University of California at Santa Cruz IACUC, Stanford University IACUC under approved protocols #18487 and #21758, University of California at San Francisco IACUC under approved protocol #AN098262-01I, and institutional and federal guidelines. The day of vaginal plug detection was designated as E0.5. The day of birth was designated as P0.
ChIP-seq
Chromatin immunoprecipitation followed by deep sequencing (ChIP-seq) was performed as previously described (McKenna et al. 2011; Eckler et al. 2014). Cortices dissected from E15.5 embryos were fixed for 10 min with 1% formaldehyde and neutralized with glycine. The cells were lysed, and the chromatin was sheared into ∼300-bp fragments. Immunoprecipitation reactions were performed in duplicate using the rabbit anti TBR1 (Abcam: ab31940, RRID: AB_0) antibody, which was previously validated for ChIP-qPCR (McKenna et al. 2011). Sequencing libraries were generated from the ChIP-ed DNA and input DNA for control using the Illumina TruSeq kit according to the manufacturer's protocol (Supplemental Table S5). Twenty million cells were used for each ChIP-seq experiment. Sequencing was performed on an Illumina HiSeq 2000 at the UCSC Genome Technology Center. Sequencing reads were mapped to the mouse reference genome (NCBI37/mm9) using version 0.7.12-r1039 of the BWA sampe and aln mapping algorithms (Li and Durbin 2009) with default parameters. ChIP-seq quality was assessed using phantompeakqualtools version 2.0 (https://code.google.com/p/phantompeakqualtools/), and all replicates received the highest quality score (Supplemental Table S5) based on the relative strand cross-correlation coefficient (RSC). Peaks were called using MACS version 2.1.0 20140616 with a P-value cutoff of 0.01 and merged using the Irreproducible Discovery Rate (IDR) framework (Li et al. 2011) October 2010 version using a threshold of 0.01 as previously described (https://sites.google.com/site/anshulkundaje/projects/idr).
For computing the overlap with TBR1 ChIP-seq performed in N2A cells, reads were last downloaded from the Sequence Read Archive (accessions: SRR1016884 and SRR1016885) on October 19, 2015. Sequencing reads were mapped to the mouse reference genome (NCBI37/mm9) using version 0.7.12-r1039 of the BWA samse and aln mapping algorithms (Li and Durbin 2009) with default parameters. The number of reads overlapping our set of TBR1 ChIP-seq peaks was compared to the number of reads overlapping 10,000 shuffles of the same peaks across the genome (excluding the UCSC mm9 gap track).
We downloaded H3K27ac, H3K4me1, H3K27me3, and H3K9me3 histone modifications assayed in mouse E14.5 whole brain (The ENCODE Project Consortium 2012). Enrichments with TBR1 ChIP-seq peaks were computed as has been done previously (Notwell et al. 2015): We shuffled the TBR1 ChIP-seq peaks across the genome 10,000 times (excluding the UCSC mm9 gap track). For each shuffle, we counted the number of TBR1 peaks overlapped by each histone modification and computed an empirical P-value.
Motif discovery was performed using MEME-ChIP (Machanick and Bailey 2011) version 4.10.2 on the set of IDR peaks called from both replicates, which were centered over the peak summits from replicate 1 of the MACS ChIP-seq peak calls and trimmed/padded to 201 base pairs, which was approximately the median peak length.
Gene sets
Genes with two or more de novo LoF mutations in ASD probands (hcWillsey, hcIossifov, and hcDeRubeis) and genes carrying a single de novo LoF mutation in ASD probands (pWillsey, pIossifov, and pDeRubeis) were obtained from references (Willsey et al. 2013; De Rubeis et al. 2014; Iossifov et al. 2014). Genes were mapped from human gene symbols to mouse UCSC cluster IDs using mappings from Ensembl Biomart (Ensembl 78) (Cunningham et al. 2015), the UCSC Genome Browser (Rosenbloom et al. 2015), and the Mouse Genome Informatics (MGI) database (Eppig et al. 2015). Ambiguous mappings were excluded, and mappings were validated using UCSC chains (Rosenbloom et al. 2015). All nine hcWillsey genes and 117 of 122 pWillsey genes were mapped to their mouse orthologs; all 27 hcIossifov genes and 312 of 326 pIossifov genes were mapped to their mouse orthologs; and 17 of 18 hcDeRubeis genes (all but SYNGAP1) and 249 of 257 pDeRubeis genes were mapped to their mouse orthologs. Additional gene lists were obtained from references (Parikshak et al. 2013; Li et al. 2014; Hormozdiari et al. 2015) and mapped using the same procedures. Finally, genes co-expressed with TBR1 in microarray data from the Allen Human Brain Atlas were downloaded and mapped to their mouse orthologs. ChIP-seq peaks were associated with genes using the default basal regulatory domain definition of 5 kb upstream and 1 kb downstream plus extensions in both directions to the nearest gene's basal domain, up to 1 Mb. Enrichments were computed using GREAT version 2.0.2 (McLean et al. 2010).
Transcriptome profiling
Transcriptome profiles were last downloaded from the NCBI Gene Expression Omnibus (GEO; accession: GSE22371) on March 17, 2015. CEL files were read using the read.celfiles() function and normalized using the robust multichip average (RMA) algorithm from version 1.30.0 of the oligo (Carvalho and Irizarry 2010) R library with default parameters. Differentially expressed transcripts were identified using limma version 3.22.7 (Ritchie et al. 2015). Probes with a limma reported P-value less than 0.05 were called differentially expressed, and probes were mapped to genes using mappings from Ensembl Biomart (Ensembl 78; Cunningham et al. 2015).
Radioactive in situ hybridization
Subjects in this study were Tbr1tm1Jlr/Tbr1tm1Jlr mice and their wild-type littermates (RRID: MGI_3040613). Radioactive in situ hybridization was carried out as previously described (Frantz et al. 1994), with the following modifications: Riboprobes were transcribed from embryonic mouse neocortex cDNA, and slides were exposed for a period of 3 d to 3 wk before developing. Primer pairs were designed to capture as many isoforms as possible (Supplemental Table S6). Specificity of the probe to the gene of interest was verified using BLAT (Kent 2002).
Grain counts
Coronal (P0) and sagittal (E15.5) sections through the frontal cortex were imaged at 40× magnification such that individual silver grains were resolved within a single plane. At E15.5, all images were cropped at the same dimensions to contain only the cortical plate. At P0, images fully contained either layers 2–5 or layer 6. For all quantifications, images were chosen with similar cell densities and background levels. Grains were counted using the ImageJ (Schneider et al. 2012) Analyze Particles tool. All counts were normalized to background counts in regions of the brain that were negative for expression of the gene being quantified. For each gene at each time point and genotype, three to six sections, encompassing three different samples, were counted.
Exome data
The latest version 0.3 summary data were last downloaded from the Exome Aggregation Consortium (ExAC) Browser (Exome Aggregation Consortium et al. 2015) on October 22, 2015. Variants were obtained from the 60,706 unrelated individuals reported in this database. We used variant
annotations provided in the ExAC download, which were produced by the Ensembl Variant Effect Predictor v77. For each Ensembl
Gene Identifier, we computed the fraction of nonreference LoF alleles annotated by ExAC, e.g., nonsense, frameshift, and splice
site, normalized to the total number of nonreference alleles, adjusting for allelic sampling differences. The fraction LoF
score f for gene i is the following:
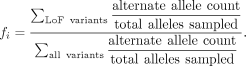 This statistic internally controls for each gene's length, GC bias, and other confounding factors. The trends and statistics
we observed were robust to the removal of intronic and less harmful variants, as well as using only the subset of exomes from
the National Heart, Lung and Blood Institute's (NHLBI) Exome Sequencing Project (ESP). RVIS scores computed from ExAC release
0.3 were last downloaded on October 22, 2015 (http://genic-intolerance.org/data/RVIS_Unpublished_ExAC_May2015.txt), and genes were mapped from human gene symbols to Ensembl IDs using mappings from Ensembl Biomart (Ensembl 78; Cunningham et al. 2015).
This statistic internally controls for each gene's length, GC bias, and other confounding factors. The trends and statistics
we observed were robust to the removal of intronic and less harmful variants, as well as using only the subset of exomes from
the National Heart, Lung and Blood Institute's (NHLBI) Exome Sequencing Project (ESP). RVIS scores computed from ExAC release
0.3 were last downloaded on October 22, 2015 (http://genic-intolerance.org/data/RVIS_Unpublished_ExAC_May2015.txt), and genes were mapped from human gene symbols to Ensembl IDs using mappings from Ensembl Biomart (Ensembl 78; Cunningham et al. 2015).
Icelandic KO data
The list of genes homozygous or compound heterozygous for LoF mutations with a minor allele frequency below 2%, the same criterion used in the study, were downloaded from Supplementary Table S4 (Sulem et al. 2015) and mapped to human Ensembl identifiers.
Quantitative Real-Time PCR (qRT-PCR)
qRT-PCR was performed using SYBR Green (Bio-Rad) and a 7900HT Fast Real-Time PCR System (Applied Biosystems). Gene-specific primers for high-confidence ASD genes and the Eif1a housekeeping gene (HKG) were designed using the Primer3 program (Supplemental Table S7; Rozen and Skaletsky 2000). The expression levels of the target genes were normalized relative to the expression levels of Eif1a HKG, and then expression levels between Tbr1-knockouts and wild-type littermates were compared as previously described (Pfaffl 2001; Darbandi and Franck 2009).
Digoxigenin in situ hybridization
E14.5 mouse embryos were fixed in 4% paraformaldehyde (PFA) in 1× PBS overnight at 4°C. The brains were transferred into 30% sucrose and incubated overnight at 4°C. Following the sucrose treatment, the brains were washed in 1× PBS for 5 min at room temperature (RT) and embedded in Tissue Tek O.C.T. compound. P0 mice were perfused with 4% PFA in 1× PBS, followed by an overnight post-fix in 4% PFA in 1× PBS at 4°C. The brains were transferred into 30% sucrose and incubated at 4°C for 48 hr. Following the sucrose treatment, 20-µm samples were sectioned using a LEICA SM2000R freezing microtome. Twenty-micron sections were obtained from the E14.5 embedded specimen, utilizing a LEICA CM1900 cryostat, and collected using SuperfrostPlus microscope slides (Fisherbrand). In situ hybridization on frozen tissue sections and digoxigenin RNA probe labeling were performed according to the procedures previously described (Wallace and Raff 1999; Long et al. 2003). Hybridized probes were detected with an AP-conjugated anti-digoxigenin Fab fragment antibody (1:2000, Roche) and visualized using the BM purple (Roche) substrate system. Antisense riboprobes for high-confidence ASD genes were prepared as previously described (Supplemental Table S8; Long et al. 2003; Cobos et al. 2005).
Data access
The ChIP-seq data from this study have been submitted to the NCBI Gene Expression Omnibus (GEO; http://www.ncbi.nlm.nih.gov/geo/) under accession number GSE71384.
Acknowledgments
We thank Chris Kaznowski for technical help. We also thank Will Talbot, Natasha O'Brown, and members of the Bejerano and McConnell labs for helpful comments, especially Aaron Wenger, Geetu Tuteja, and Dino Leone. This work was supported by a National Science Foundation Fellowship DGE-1147470 and a Bio-X Stanford Interdisciplinary Graduate Fellowship (J.H.N.), the Nina Ireland fund, a National Institute of Neurological Disorders and Stroke (NINDS) grant R01 NS34661, and a National Institute of Mental Health (NIMH) grant R37 MH049428 (J.L.R.R.), a National Institutes of Health (NIH) R01 MH51864 grant (S.K.M.), a Stanford Bio-X Interdisciplinary Initiatives Seed grant (G.B. and S.K.M.), a NIH R01 MH094589 grant (B.C.), and a NIH U01 MH105949 grant (G.B.). G.B. is a Packard Fellow and Microsoft Research Fellow.
Author contributions: J.H.N., B.C., and G.B. designed the study. J.H.N., W.E.H., S.F.D., W.L.M., C.F.O., D.T., M.J.E., and B.C. performed experiments. J.H.N., W.E.H., S.F.D., S.K., J.L.R.R., S.K.M., B.C., and G.B. analyzed the data. J.H.N., W.E.H., S.F.D., J.L.R.R., S.K.M., B.C., and G.B. wrote the manuscript.
Footnotes
-
[Supplemental material is available for this article.]
-
Article published online before print. Article, supplemental material, and publication date are at http://www.genome.org/cgi/doi/10.1101/gr.203612.115.
- Received December 20, 2015.
- Accepted June 17, 2016.
This article is distributed exclusively by Cold Spring Harbor Laboratory Press for the first six months after the full-issue publication date (see http://genome.cshlp.org/site/misc/terms.xhtml). After six months, it is available under a Creative Commons License (Attribution-NonCommercial 4.0 International), as described at http://creativecommons.org/licenses/by-nc/4.0/.


