
Characterization of complex chromosomal rearrangements by targeted capture and next-generation sequencing
- Nara L.M. Sobreira1,2,
- Veena Gnanakkan1,2,
- Michael Walsh1,3,
- Beth Marosy4,
- Elizabeth Wohler5,
- George Thomas1,5,
- Julie E. Hoover-Fong1,3,6,
- Ada Hamosh1,3,
- Sarah J. Wheelan7 and
- David Valle1,3,4,8
- 1McKusick-Nathans Institute of Genetic Medicine, Johns Hopkins University School of Medicine, Baltimore, Maryland 21205, USA;
- 2Predoctoral Training Program in Human Genetics, Baltimore, Maryland 21205, USA;
- 3Department of Pediatrics, Johns Hopkins University School of Medicine, Baltimore, Maryland 21205, USA;
- 4Center for Inherited Disease Research, McKusick-Nathans Institute of Genetic Medicine, Johns Hopkins University School of Medicine, Baltimore, Maryland 21205, USA;
- 5Kennedy Krieger Institute Cytogenetics, Baltimore, Maryland 21205, USA;
- 6Greenberg Center for Skeletal Dysplasias, Baltimore, Maryland 21205, USA;
- 7Department of Oncology, Division of Biostatistics and Bioinformatics, Johns Hopkins University School of Medicine, Baltimore, Maryland 21205, USA
Abstract
Translocations are a common class of chromosomal aberrations and can cause disease by physically disrupting genes or altering their regulatory environment. Some translocations, apparently balanced at the microscopic level, include deletions, duplications, insertions, or inversions at the molecular level. Traditionally, chromosomal rearrangements have been investigated with a conventional banded karyotype followed by arduous positional cloning projects. More recently, molecular cytogenetic approaches using fluorescence in situ hybridization (FISH), array comparative genomic hybridization (aCGH), or whole-genome SNP genotyping together with molecular methods such as inverse PCR and quantitative PCR have allowed more precise evaluation of the breakpoints. These methods suffer, however, from being experimentally intensive and time-consuming and of less than single base pair resolution. Here we describe targeted breakpoint capture followed by next-generation sequencing (TBCS) as a new approach to the general problem of determining the precise structural characterization of translocation breakpoints and related chromosomal aberrations. We tested this approach in three patients with complex chromosomal translocations: The first had craniofacial abnormalities and an apparently balanced t(2;3)(p15;q12) translocation; the second has cleidocranial dysplasia (OMIM 119600) associated with a t(2;6)(q22;p12.3) translocation and a breakpoint in RUNX2 on chromosome 6p; and the third has acampomelic campomelic dysplasia (OMIM 114290) associated with a t(5;17)(q23.2;q24) translocation, with a breakpoint upstream of SOX9 on chromosome 17q. Preliminary studies indicated complex rearrangements in patients 1 and 3 with a total of 10 predicted breakpoints in the three patients. By using TBCS, we quickly and precisely defined eight of the 10 breakpoints.
Apparently balanced translocations (ABTs) occur once in every 600 live births (Van Dyke et al. 1983), and de novo ABTs are associated with a twofold increase in congenital abnormalities (6.1% vs. 3%–4%) (Warburton 1991). Among patients with mental retardation, the prevalence of ABTs is 4.5 per 1000 patients (Funderburk et al. 1977). An ABT can produce a clinical phenotype by gene disruption or altered expression of genes in or around the breakpoint region (Chen et al. 2008, 2010). The definition of breakpoints in disease-associated ABTs has been important for molecular elucidation of multiple Mendelian and complex disorders as exemplified by studies leading to the identification of genes responsible for or contributing to neurofibromatosis type I; Sotos syndrome; schizophrenia; dyslexia; psoriasis; and diabetes (Fountain et al. 1989; Blackwood et al. 2001; Gloyn et al. 2002; Kurotaki et al. 2002; Taipale et al. 2003; Tzschach et al. 2006).
Traditionally, chromosomal rearrangements have been investigated microscopically with conventional cytogenetic banding methods. Molecular tools, including fluorescence in situ hybridization (FISH), various PCR methods, array comparative genomic hybridization (aCGH), chromosome sorting and painting, and the application of whole-genome SNP genotyping, have enabled more sensitive identification and precise definition of chromosome rearrangements (Gribble et al. 2005; Chen et al. 2010). These newer methods have expanded our appreciation of the molecular alterations associated with cytogenetically detected chromosomal aberrations. For example, recent reports have suggested that 20% of ABT are complex and include deletions, duplications, and inversions at the breakpoints (Manning and Hudgins 2010). These molecular alterations likely occur during the genesis of the chromosomal rearrangements, and their definition is important for relating the cytogenetic abnormality to the clinical phenotype. Recent appreciation of the extent of copy number variations (CNVs), a form of genetic variation that accounts for a substantial fraction of human genetic variation, has added to the demand for an efficient method to precisely define chromosomal breakpoints (Redon et al. 2006; McCarroll et al. 2008; Mills et al. 2011).
Recently, Chen et al. (2010) applied a next-generation paired-end sequencing strategy to investigate two patients with ABT and two patients with chromosome inversions. For the ABTs, they isolated the derivative chromosome by flow sorting, made a derivative chromosome-specific library of 2- to 3-kb inserts, and sequenced the ends of the DNA fragments. For the inversions, they constructed a whole-genome library with 2- to 3-kb inserts and performed next-generation paired-end sequencing. In both instances, they were able to map the breakpoints to a region of few hundred base-pairs by identifying paired end reads for which the end sequences (mate pairs) aligned to different regions of the reference genome. Subsequent PCR amplification and Sanger sequencing defined the breakpoints at a base-pair resolution.
Here we tested a new approach: preliminary localization of the breakpoint region by conventional methods (standard band karyotype and whole-genome SNP genotyping) followed by capture of the predicted breakpoint regions and paired-end next-generation sequencing to rapidly and precisely define the molecular abnormalities. We refer to this approach as translocation breakpoint capture followed by next-generation sequencing (TBCS) and tested it in three patients with dysmorphic syndromes and complex chromosomal translocations: The first has craniofacial abnormalities and an apparently balanced t(2;3)(p15;q12) translocation that co-segregates with the phenotype in three generations (Cargile et al. 2000); the second has cleidocranial dysplasia (CCD; OMIM 119600) associated with a t(2;6)(q22;p12.3) translocation and a breakpoint in RUNX2 on chromosome 6p; and the third has acampomelic campomelic dysplasia (OMIM 114290) associated with a t(5;17)(q23.2;q24) translocation, with a breakpoint in the region upstream of SOX9 on chromosome 17q. Preliminary studies (see below) predicted complex rearrangements in patients 1 and 3 with a total of 10 predicted breakpoints in the three patients. By using TBCS, we quickly and precisely defined eight of the 10 breakpoints.
Results
By using a conventional karyotype and a whole-genome SNP genotyping (see Methods), we were able to localize six target regions predicted to contain the breakpoints in the three clinical samples. Together the regions of interest spanned 5.6 Mb. Based on this information, we designed custom SureSelect Target Enrichment arrays (Agilent Technologies) to capture the target regions. After removing repetitive sequences, the capture probes covered 3.5 of the 5.6 Mb. Library preparation and regional capture were performed using standard methods (Gnirke et al. 2009). We performed 75-bp paired-end sequencing of the captured fragments in one channel of an Illumina Genome Analyzer IIx. We aligned sequence reads to the reference sequence for the entire genome using the on-instrument Illumina software. Subsequently, by utilizing Integrative Genomics Viewer (IGV) (Robinson et al. 2011), we were able to identify the sequence of four of the six junction points (union of normally noncontiguous sequences) by searching for mate pairs that mapped to different chromosomes. We then confirmed the results by PCR amplification and Sanger sequencing of fragments predicted to contain the junction points. We defined the fifth junction point by PCR amplification and Sanger sequencing using the coordinates found by TBCS on one end and by subsequent qPCR and Southern blot studies on the other end.
We also tested a bioinformatics approach to define the junction points. We developed Perl parsers to identify reads that span the junction points (split-reads) found by TBCS (see Methods, Data Processing). In brief, we searched for a single 75-bp read that contained at least 15 bp of sequence from two normally noncontiguous sites on the reference sequence. Normally, these would have been considered unmapped reads and discarded. By using this analysis, we were able to map the same four junction points to single base pair resolution.
Patient 1
Initial cytogenetic analysis identified an ABT, (46,XY,t(2;3)(p15;q12)). Surprisingly, our preliminary studies had indicated that a segment of chromosome 4 was inserted between chromosomes 3 and 2 on derivative chromosome 2 (Fig. 1A; see Methods). Guided by these results, we captured and sequenced the regions on chromosome 2 from 63,775,154–64,009,437 bp, chromosome 4 from 58,420,000–60,883,766 bp, and chromosome 3 from 106,395,854–106,604,335 bp to define all three junction points and the corresponding five chromosomal breakpoints. After alignment and mapping, we used IGV (Robinson et al. 2011) to identify four mate pairs spanning the 3;4 junction point on derivative chromosome 2 predicted by our preliminary studies (see Methods), 25 mate pairs spanning the 4;2 junction point on derivative chromosome 2, and no mate pairs spanning the 3;2 junction point on derivative chromosome 3. By using this information, we designed primers to flank the 4;2 junction point on derivative chromosome 2 and used them to amplify genomic DNA from the patient and controls. This yielded a PCR product of ∼2.5 kb specific for the patient (Supplemental Fig. S1). Sanger sequencing defined the breakpoint at position 63,892,413 on chromosome 4 and at position 60,638,301 on chromosome 2 (NCBI build 36.1). There is a 2-bp (AA) insertion between the sequences from chromosomes 4 and 2 (Fig. 1C). Together with our previously defined 3;4 junction point on derivative chromosome 2, this result confirmed and precisely defined an ∼2.2-Mb chromosome 4 duplication inserted between segments of chromosomes 3 and 2 on the derivative chromosome 2 (Fig. 1A,B). In retrospect, we would have defined this complex rearrangement simply by capturing the breakpoint regions on chromosome 2 and 3.
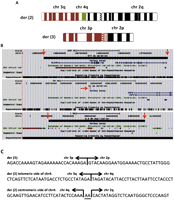
(A) Ideograms showing derivative chromosomes 2 and 3. (B) UCSC Genome Browser information about the breakpoints regions: The red arrows indicate the exact breakpoint on each chromosome, and if there is no segmental duplication in the region, that track on the UCSC Genome Browser is not shown. (C) The nucleotide sequence around each junction point; AA indicates two inserted nucleotides.
By using the breakpoint position on chromosome 2 and previous data predicting the breakpoint region on the centromeric side of the chromosome 3 deletion, we designed primers and amplified genomic DNA from the patient and controls. This yielded a PCR product of ∼3.0 kb that was specific for derivative chromosome 3 of the patient (Supplemental Fig. S2). Following Sanger sequencing, we mapped these sequences to the reference genome (NCBI build 36.1) and located the precise breakpoints at position 106,498,660 on chromosome 3 and at position 63,892,392 on chromosome 2 (Fig. 1C). These breakpoints confirmed and precisely defined the ∼577-kb deletion of chromosome 3 and also revealed a 21-bp deletion of chromosome 2 (Fig. 1B). With Perl parsers, we identified 31 split-reads spanning the 3;4 junction point and 157 split-reads spanning the 4;2 junction point. Thus, we were able to confirm these two breakpoints at single base pair resolution. No annotated reference genes were disrupted by the breakpoints on chromosomes 3, 4, or 2 (Fig. 1B). There were no reference genes on the duplicated region of chromosome 4 (Fig. 1B). The region deleted on chromosome 3 harbors 2 genes, ALCAM and CBLB (Fig. 1B).
Patient 2
Initial conventional cytogenetic analysis predicted an ABT involving chromosomes 2 and 6 (46,XY,t(2;6)(q22;p12.3)) (Fig. 2A). We captured and sequenced the region on chromosome 6 from 45,166,074–45,806,126 bp (Fig. 2B) in an attempt to define two breakpoints and two junction points. After alignment and mapping, we were unable to find mate pairs spanning the 2;6 junction point using IGV (Robinson et al. 2011).This negative result may be because we designed baits only to the 640-kb predicted breakpoint region on chromosome 6, a region rich in DNA repeats (Fig. 2B). We elected not to capture the other side because our preliminary localization of the breakpoint was too imprecise with a minimal region of 4.9 Mb.
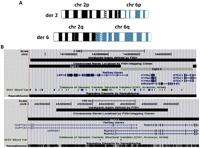
(A) Ideograms showing derivative chromosomes 2 and 6. (B) UCSC Genome Browser information around the breakpoint regions with the same conventions as described for Figure 1.
Patient 3
Initial conventional cytogenetic analysis predicted an ABT involving chromosomes 5 and 17 (46,XY,t(5;17)(q23.2;q24)) (Fig. 3A). We captured and sequenced the region of chromosome 5 from 123,618,782–123,967,296 bp and the region of chromosome 17 from 66,081,810–67,793,011 bp to define three breakpoints and two junction points. Following alignment and mapping, we used IGV (Robinson et al. 2011) analysis to visually identify 16 mate pairs spanning the 5;17 junction point on derivative chromosome 5, and 31 mate pairs spanning the 5;17 junction point on derivative chromosome 17. We designed primers to flank the 5;17 junction point on derivative chromosome 5 and derivative chromosome 17 and used them to amplify genomic DNA of the patient and controls. This yielded patient-specific PCR products of 617 bp for derivative chromosome 5 and 1.5 kb for derivative chromosome 17 (Supplemental Figs. S3, S4). After Sanger sequencing, we mapped these sequences to the reference genome (NCBI build 36.1) and located the precise breakpoint on derivative chromosome 5 at position 123,735,693 on chromosome 5 and at position 67,467,531 on chromosome 17 (Fig. 3C). On derivative chromosome 17, the precise breakpoints were at base-pair position 123,857,794 on chromosome 5 and at base-pair position 67,467,521 on chromosome 17 (Fig. 3C). These breakpoints confirmed and precisely defined the chromosome 5 deletion predicted by SNP genotyping (122,101-bp deletion) and discovered a 10-bp deletion on chromosome 17 (Fig. 3B). By using Perl parsers, we identified 250 split-reads for the 5;17 junction point on derivative chromosome 5 and 184 split-reads spanning the 5;17 junction point on derivative chromosome 17. This analysis confirmed the two junction points at single base pair resolution.
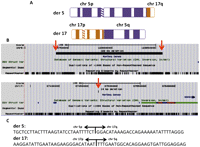
(A) Ideograms showing derivative chromosomes 5 and 17. (B) UCSC Genome Browser information around the breakpoint regions. (Red arrows) Exact breakpoint on each chromosome, with the same conventions as described for Figure 1. (C) The nucleotide sequence around each junction point.
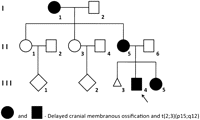
Pedigree case 1.
TBCS workflow.
Interspersed repetitive elements leading to nonallelic homologous recombination (NAHR) have been implicated in chromosomal rearrangements. To search for these in the vicinity of the breakpoints, we referred to the UCSC Genome Browser (NCBI build 36). In patient 1, the breakpoint on chromosome 4 (telomeric end of the inserted chromosome 4 sequence, joined to the chromosome 3 segment on derivative chromosome 2) was in a short interspersed element (SINE) belonging to the mammalian interspersed repeats (MIR) family. The breakpoint on chromosome 2 was in a long interspersed element (LINE) belonging to the L1 family. The centromeric breakpoint of the chromosome 3 deletion was also in an L1 element. The telomeric breakpoint of the chromosome 3 deletion was 51 bp from a SINE belonging to the MIR family. In patient 3, the chromosome 5 breakpoint on derivative chromosome 17 was in a LINE belonging to the L2 family. The other defined breakpoints were not in or near repetitive elements. In total, five of eight defined breakpoints were in repetitive sequences, and the two breakpoints that we failed to identify were in a region with multiple repetitive sequences that could not be captured because the bait design avoided highly repetitive regions.
Discussion
Evaluation of complex chromosomal rearrangements and their potential phenotypic consequences is a common challenge in the genetics clinic. The identification of chromosomal rearrangements (inversions, translocations, and CNVs) is a key step in understanding the generation of phenotype in the affected individuals. Numerous genetic diseases, including cancer, have been associated with chromosomal rearrangements (Futreal et al. 2004; Sandberg and Meloni-Ehrig 2010), and characterization of breakpoints in these disease-associated rearrangements has led to the molecular elucidation of many hereditary diseases (Chen et al. 2008). However, progress in detecting inversions and defining translocations has been slow. This is largely due to the lack of a powerful, generalizable, and efficient method for a genome-wide discovery of these chromosomal rearrangements. The slow progress in the molecular definition of inversions and translocations is evident from the data entries recorded in the Database of Genomic Variants (DGV). More than 66,000 CNVs and nearly 34,000 indels have been reported, while fewer than a thousand inversions have been found and no data are presently available for translocations (Ku et al. 2010). With the arrival of high-throughput sequencing technologies applied to short-insert paired-end reads, our ability to detect these chromosomal rearrangements has improved. By using a priori information such as order, orientation, and insert size of mate pairs as constraints for alignment of the reads to the reference genome, anomalously mapped pairs indicate potential genomic variations from the reference (Zeitouni et al. 2010). Leary et al. (2010) used this approach in whole-genome sequencing of tumor DNA to identify translocation breakpoints.
We used conventional cytogenetic and molecular methods (whole-genome SNP genotyping) to identify target regions with subsequent TBCS to precisely and quickly define five of six predicted junction points and eight of 10 breakpoints in three patients predicted to have ABT. By focusing on the predicted breakpoint regions, TBCS significantly reduces the cost and the time required to complete the process. In designing our targeted capture, we included sequences adjacent to the estimated breakpoint (100 kb on either side) to compensate for the low resolution of our predictions. We utilized IGV (Robinson et al. 2011) to search for sequencing mate pairs that mapped to noncontiguous sequence (all on different chromosomes in our test patients) and confirmed these results at base-pair resolution by PCR amplification and Sanger sequencing of patient genomic DNA. We defined the fifth junction point by PCR amplification and Sanger sequencing using the coordinates found by TBCS on one end and by predictions based on previous studies on the other end. Our design of the capture baits covering this region was hampered by the presence over 8 kb of dense repeats.
As an alternative analytic strategy, we developed Perl parsers to identify the split reads spanning the breakpoints, and we were able to map the same four junction points with single base pair resolution. This method alone finds many split reads around the genome. Thus, at current read lengths it does not have sufficient specificity to replace the PCR and Sanger sequencing steps of TBCS.
High-resolution molecular characterization of chromosomal rearrangements will lead to a better understanding of the origins of the clinical phenotypes. In our case, patient 1 had a complex translocation with an ∼577-kb deletion on chromosome 3 and an ∼2.2-Mb duplication/insertion of chromosome 4 between chromosomes 3 and 2 on derivative chromosome 2 (Fig. 1A,B). The breakpoints did not disrupt any annotated gene. In contrast, the deletion of chromosome 3 removed ALCAM and CBLB (Fig. 1B). Simovich et al. (2008) described a patient with a 2.5-Mb deletion at 3q13.11q13.12, which removed ALCAM and CBLB, and suggested that CBLB plays a role in the craniofacial phenotype in patients with deletions in this region. The delineation of the chromosomal rearrangement in patient 1 supports the involvement of ALCAM and/or CBLB in the phenotype of these patients. Moreover, explanation of the complex nature of the rearrangement in our family emphasizes the challenge of relating genotype to phenotype in patients with what appears to be an ABT at the cytogenetic level.
Patient 3 was also a complex translocation with an ∼122-kb deletion on chromosome 5 (Fig. 3B). The breakpoints did not disrupt any reference gene, but the breakpoint on chromosome 17 is ∼161 kb centromeric of SOX9, in a region of known regulatory function for SOX9. Acampomelic campomelic dysplasia is associated with translocations and breakpoints centromeric of SOX9 (Gordon et al. 2009). The published acampomelic campomelic dysplasia translocation breakpoints centromeric of SOX9 fall into two clusters: a proximal cluster 50–375 kb and a distal cluster 789–932 kb centromeric of SOX9 (see Supplemental Material; Leipoldt et al. 2007). The result in our patient is consistent with disruption of regulatory elements in the area defined by the proximal cluster. In addition to acampomelic campomelic dysplasia, patient 3 had pyloric stenosis (MIM 226730), a phenotype that has been associated with reduced expression of ITGB4, which is located 3.4 Mb telomeric from the breakpoint (Fig. 3B). This observation suggests that the chromosomal rearrangement might also perturb expression of ITGB4. Regulatory sequences located at long range (up to 1.2 Mb) from the genes they control have been described, but none as distant as this (Lettice et al. 2002, 2003; Kleinjan and van Heyningen 2005). Thus, additional studies would be required to test this hypothesis.
Reciprocal translocations may be the result of two random double-strand breaks followed by ligation repair of these breaks by NAHR or nonhomolgous end joining (NHEJ). Recent observations suggest that repetitive sequences such as LINE and Alu elements may contribute to structural variations (Beck et al. 2010; Ewing and Kazazian 2010; Huang et al. 2010; Iskow et al. 2010). Because of the limited number of ABT that have been analyzed in detail, however, relatively little is known about the involvement of specific sequences in the generation of such rearrangements (Chen et al. 2008). Ou et al. (2011) suggested that interchromosomal LCR-mediated (low-copy repeat) NAHR may be a major mechanism for recurrent constitutional translocation formation, in particular within the subtelomeric regions. The translocations we report here have not previously been described, and none of the five breakpoints we identified were in LCR regions. For those rearrangements without sequence similarity at the breakpoints, the process is predicted to involve NHEJ and may generate local genomic alterations such as small deletions, insertions, or duplications at the breakpoint junctions (Gu et al. 2008; Stankiewicz and Lupski 2010). CNVs at a distance from a breakpoint may be unrelated to the rearrangement or may reflect a more complex mechanism that promotes interchromosomal exchanges and rearrangements. In our study, five out of eight defined breakpoints were within repetitive sequences, an observation that suggests that these elements played a role in their generation. We did not find homologous sequences flanking the breakpoints in patient 1 or patient 3. This argues against NAHR and supports the idea that these chromosome rearrangements were generated through NHEJ. The case for NHEJ is also strengthened by the observation that patient 1 involves a deletion and a duplication/insertion in the breakpoints and the patient 3 involves a deletion in one of the breakpoints.
Finally, our results show the value of combining the standard G-banded chromosome study with the results of a SNP genotyping array or other whole-genome technology (e.g., dense whole-genome oligonucleotide arrays) to detect copy number differences to better understand chromosomal rearrangements. Although whole-genome SNP genotyping arrays detect CNVs that are beyond the resolution of standard cytogenetic, they only provide copy number and genotype information. The location of the copy number change is inferred from the reference genome sequence. Thus, SNP genotyping arrays will not detect truly balanced chromosomal rearrangements.
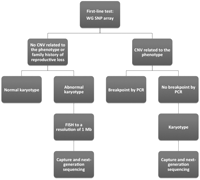
Several studies have shown that ∼20% of individuals with an ABT (de novo or familial) and up to 40% of the ABTs in patients with abnormal phenotype have loss or gain of genetic material as identified by SNP arrays (Gribble et al. 2005; De Gregori et al. 2007; Sismani et al. 2008; Edelman and Hirschhorn 2009). That was the case for two of our three patients. In patient 1, the karyotype showed a balanced translocation, 46,XY,t(2;3)(p15;q12), and the SNP genotyping identified a 550-kb deletion of 3q and a 2.1-Mb duplication of 4q. This information was used to design the capture baits and precisely define this chromosomal rearrangement. Although we included the duplicated 2.1-Mb region of chromosome 4 in our capture, we would have identified the junction points using only the chromosomes 2 and 3 breakpoints regions. In patient 2, the SNP genotyping array did not reveal deletion or duplication of genomic material in the breakpoint region and the only indication of a rearrangement was the G-banded karyotype, 46,XY,t(2;6)(q22;p12.3). In patient 3, the karyotype showed the 46,XY, t(5;17)(q23.2;q24) and the SNP array showed deletion of 5q material. Thus, in this instance it was important to have both karyotype and SNP genotype data. The karyotype also predicted the region on chromosome 17 that we included in designing the capture. We suggest, therefore, that a whole-genome SNP genotyping array plus a karyotype provides the most reliable guide for the design of the capture baits to precisely define the chromosomal rearrangements (Fig. 5). As the density of genotyped SNPs on the arrays progressively increases, the resolution around the breakpoint regions will increase enabling more informed design of the breakpoint capture reagents. The combination of karyotype plus genotyping data is also necessary to provide completely informed counseling for the parents. For example, if the patient has a truly balanced translocation, the genotyping results will be negative and the abnormality detected only by the karyotype.
The TBCS approach is cost-efficient and rapid, allowing simultaneous investigation of multiple patients with different chromosomal rearrangements, and avoids the experimentally intensive and time-consuming use of methods such as FISH, inverse PCR, quantitative PCR, and chromosome sorting (Gribble et al. 2005). This method will greatly facilitate large-scale breakpoint mapping.
Methods
Case reports
Patient 1
Cargile et al. (2000) previously described this family (Fig. 4) in which delayed cranial membranous ossification (OMIM 155980) co-segregates with an ABT 46,XY,t(2;3)(p15;q12). The chromosomes 2 and 3 translocation was identified in individuals I-1, II-5, III-3, and III-5 (Fig. 4). The chromosome studies of family members II-1 and II-3 were interpreted as normal in 1977 and were not repeated (see Supplemental Material).
Patient 2
This patient has a t(2;6)(q22;p12.3) translocation associated with CCD.
Patient 3
This 30-mo-old male has acampomelic campomelic dysplasia. He has a flat round face, mid-face hypoplasia, flat supraorbital ridges, hypertelorism, small palpebral fissures, a flat nasal bridge, a small nose, low-set ears, a cleft palate, micrognathia, a short neck with redundant posterior skin folds, hydrocephalus, and tracheobroncheomalacia. He also had pyloric stenosis, a feature not described in campomelic dysplasia or acampomelic campomelic dysplasia. His skin was normal. Radiographic studies showed a short thorax with kyphoscoliosis, 11 pairs of ribs, and bilateral absence of the scapulae. The long bones were short but unbowed. His karyotype was interpreted as an ABT, 46,XY,t(5;17)(q23.2;q24).
Molecular studies
Here we provide all the preliminary studies performed prior to using the TBCS approach. In retrospect, these studies were not necessary; a conventional karyotype plus the SNP genotyping results were sufficient to design the capture reagent for TBCS.
Patient 1
We utilized the Illumina whole-genome SNP genotyping platform 550K (Illumina) to examine the genomic DNA of individual II-5 and identified a stretch of 124 SNPs with reduced intensity (LogR ratio) and apparent loss of heterozygosity covering 550 kb on chromosome 3q, indicating a hemizygous deletion. This deletion is adjacent to the predicted translocation breakpoint in this family (Fig. 4). We utilized FISH, Southern blot analysis, qPCR, inverse PCR, and sequencing to show that in addition to a 550-kb deletion on chromosome 3, a segment of chromosome 4q (∼2.1 Mb) was duplicated and attached to the chromosome 3q in the derivative chromosome 2 (Fig. 1A). Thus on derivative chromosome 2, the breakpoint on chromosome 3 was at base-pair position 107,076,273 and at base-pair position 58,423,388 on chromosome 4. We also narrowed down the breakpoint region on the centromeric side of the deletion at chromosome 3q to a region of 8 kb by qPCR and Southern blot and narrowed down the breakpoint region at chromosome 2p, by FISH, from 286 kb to 23 kb (63,875,154–63,909,437 bp).
Patient 2
FISH analysis using fluorescently labeled BAC clones revealed that the breakpoint in chromosome 6 is between BAC clones RP11-39I17 (45,266,074–45,422,219 bp) and RP11-342L7 (45,533,186–45,706,126 bp), which is a 111-kb region that is part of RUNX2. On chromosome 2, the predicted breakpoint region was between BAC clones RP11-12M21 (139,529,620–139,697,761 bp) and RP11-285H23 (144,589,302–144,778,851) that is a region of 4.9 Mb. While loss of function of RUNX2 is a well-documented cause of CCD, we studied this proband as a test of this approach's ability to precisely define breakpoints.
Patient 3
SNP array analysis (Illumina 550) revealed a 100-kb region on 5q23.2 (123,742,816–123,843,769 bp) in the area of the cytogenetic breakpoint containing 26 genotyped SNPs with reduced intensity and apparent loss of heterozygosity, indicating a hemizygous deletion. This region lacks annotated genes (UCSC). Chromosome 17q was normal by this assay. We performed FISH analysis and showed that the breakpoint in chromosome 17 is between BAC clones RP11-84E24 (67,512,627–67,693,011 bp) and RP11-90L11 (65,981,810–66,144,564 bp). This region is 1.3 Mb centromeric of SOX9. Next, we performed inverse PCR based on the limits of the deletion at chromosome 5 identified by the SNP genotyping data. From the inverse PCRs results, we predicted that a minimal region of 535 bp from chromosome 9 (113,466,821 to 113,466,286 bp) is attached to chromosome 5 in the derivative 5 and that a minimal region of 462 bp from chromosome 6 (152,071,369 to 152,070, 907 bp) is inserted between chromosome 5 and 17 in the derivative 5; however, PCR of the genomic DNA did not confirm these data.
Targeted capture
To design the RNA baits for capture, we utilized the breakpoints boundaries predicted by the conventional karyotype and the SNP genotyping results and the Agilent Technologies eArray site (https://earray.chem.agilent.com/earray/).
The regions were chromosome 2 from 63,775,154–64,009,437 bp, chromosome 4 from 58,420,000–60,883,766 bp, chromosome 3 from 106,395,854–106,604,335 bp, chromosome 5 from 123,618,782–123,967,296 bp, chromosome 17 from 66,081,810–67,793,011 bp, and chromosome 6 from 45,166,074–45,806,126 bp. These regions totaled 5.6 Mb, but after removing repetitive regions, the total length captured was ∼3.5 Mb.
The baits were 120 bp long, and the average bait coverage of each base in the target region was 2×. We avoided standard repeat masked regions but allowed each bait to overlap with a repetitive region up to 20 bp. We also identified sequences within repetitive regions that were sufficiently unique to serve as reasonable baits. One of the biggest challenges for target enrichment sequence-capture methods is capturing regions of genomes that encompass large deletions. Using a complex mixture of 120 bp RNA oligonucleotides of 120 bp increases capture performance across regions with insertions and deletions because RNA has stronger affinity for DNA and long capture probes are also more tolerant of single variants with the target. Also, the in-solution method favors high-yield capture, as the baits are significantly more abundant than the targets. Approximately 3 μg of genomic DNA of each patient was sheared (150–200 bp), and adaptors were attached to the ends of DNA fragments. We purified and amplified the ligated fragments and sized and quantified the products preceding capture using the Agilent 2100 Bioanalyzer. We incubated size-selected libraries with baits (a mixture of RNA oligonucleotides that are biotinylated for easy capture onto streptavidin-labeled magnetic beads) for 24 h and recovered the RNA bait–DNA hybrids by incubation with streptavidin-labeled magnetic beads and followed by capture with a magnet. After washing, the RNA bait was removed by exposure to RNase so that the only the targeted DNA remains. Following capture, we amplified and sequenced the selected DNA (Gnirke et al. 2009).
Next-generation sequencing
We used a single lane of an Illumina Genome Analyzer IIx platform to perform 75-bp paired-end sequencing of the captured DNA from the three patients. We sequenced ∼3.5 Mb of genomic DNA from each patient and aligned the resulting short-sequence reads to the reference genome (NCBI human genome assembly build 36) using BWA software (version 0.4.9) (Li and Durbin 2009). After accounting for PCR duplicates and reads that did not align to captured regions of the reference genome, the average coverage for was 737.5×.
Data processing
By using IGV (Robinson et al. 2011), we were able to identify the breakpoint-spanning region of four out of six junction points by searching for mate pairs that mapped to noncontiguous sequence. This allowed us to map the junction points to a region of few hundred base-pairs that we confirmed and refined by subsequent PCR amplification and Sanger sequencing of the junction fragments.
To test an alternative bioinformatics approach, we developed PERL parsers to identify reads spanning breakpoints (split reads) and were able to map these breakpoints with single-base resolution. The FASTQ sequence files were first aligned to the reference genome using Bowtie (Langmead et al. 2009) allowing a 3-bp mismatch. Next we processed the unmapped reads focusing on the ones that were unpaired with the assumption that paired, unmapped reads would most likely not have the breakpoint within the read sequence itself. We remained agnostic as to the orientation and position of the mapped partner in order to allow for unknown structural variation. These unmapped, unpaired reads are aligned using the Smith-Waterman algorithm as implemented by NCBI's Blastall, with a minimum alignment length of 15 bp and a maximum alignment length of 60 bp and an e-value threshold of −10. The resulting read alignments were clustered in 1-kb genomic coordinate intervals and sorted to determine most significant alignments.
PCR amplification and sequencing of junction fragments
Junction fragments were amplified by PCR using the AccuPrime PCR Systems. Primers and PCR conditions are available upon request. PCR products were used as templates for sequencing in both directions using BigDye Terminator chemistry (PE Biosystems) on an Applied Biosystem 3730xl DNA Analyzer. Sequences of junction fragments were aligned to the human genome reference sequence (NCBI build 36) using BLAT from UCSC Genome Browser (http://genome.ucsc.edu/cgi-bin/hgGateway).
Data access
The sequence data from this study have been submitted to the NCBI Sequence Read Archive database (http://trace.ncbi.nlm.nih.gov/Traces/sra/sra.cgi?view=search_seq_name) under accession no. SRX080629.
Acknowledgments
We thank the Predoctoral Training Program in Human Genetics of McKusick-Nathans Institute of Genetic Medicine, Johns Hopkins University School of Medicine, and the NIH (award no. F31HD068133 from the Eunice Kennedy Shriver National Institute of Child Health and Human Development) for support. We also thank S. Muscelli for help with manuscript preparation.
Footnotes
-
↵8 Corresponding author.
E-mail dvalle{at}jhmi.edu.
-
[Supplemental material is available for this article.]
-
Article published online before print. Article, supplemental material, and publication date are at http://www.genome.org/cgi/doi/10.1101/gr.122986.111.
- Received March 8, 2011.
- Accepted July 7, 2011.
- Copyright © 2011 by Cold Spring Harbor Laboratory Press


