
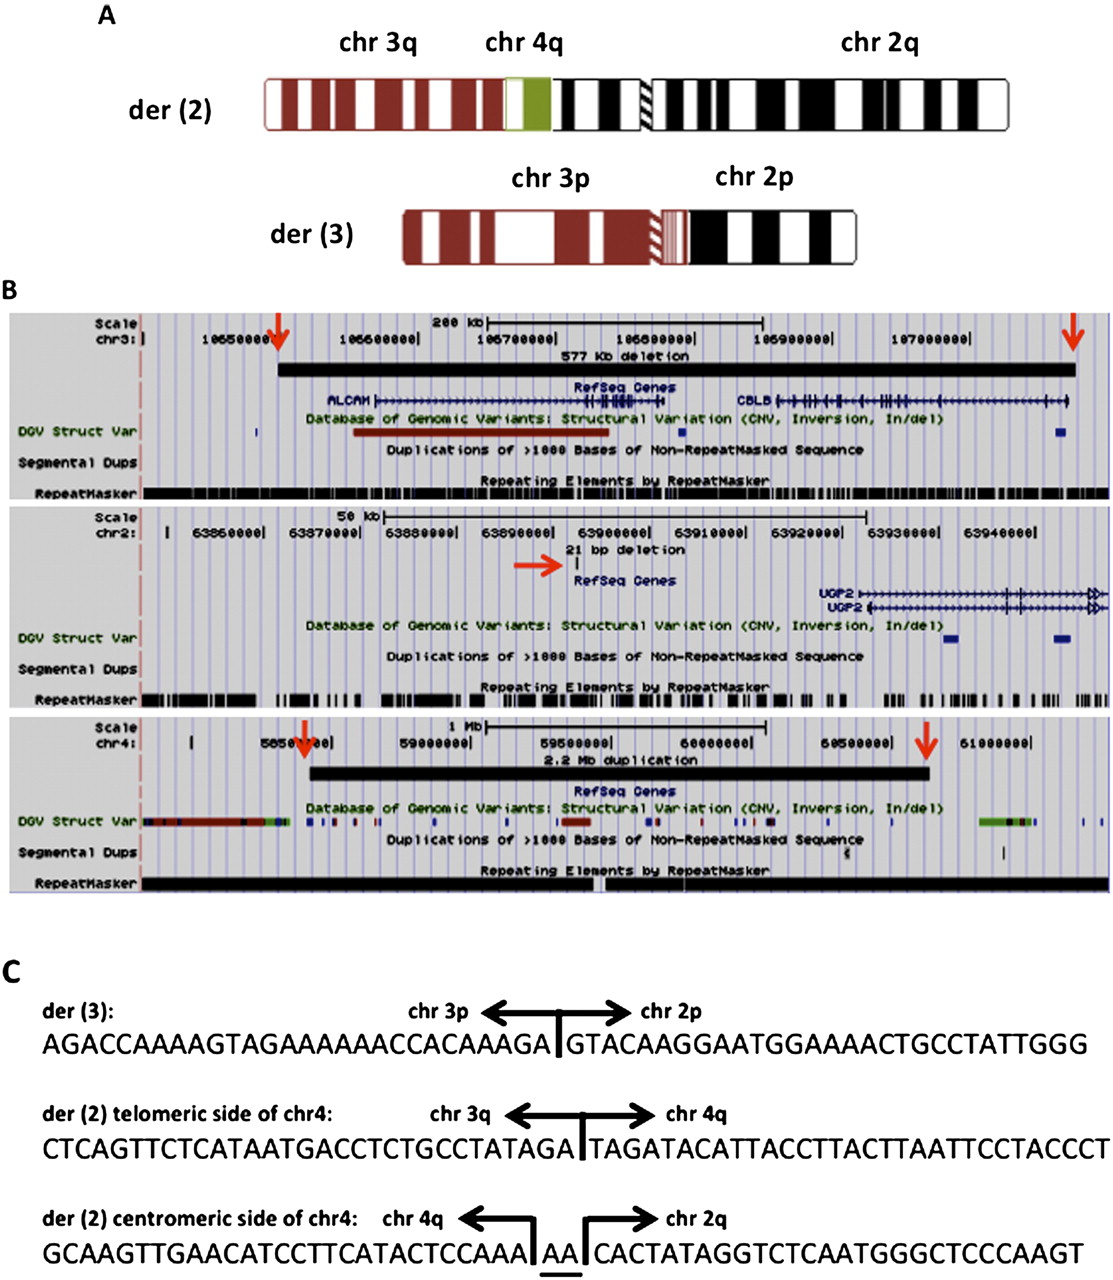
Figure 1.
(A) Ideograms showing derivative chromosomes 2 and 3. (B) UCSC Genome Browser information about the breakpoints regions: The red arrows indicate the exact breakpoint on each chromosome, and if there is no segmental duplication in the region, that track on the UCSC Genome Browser is not shown. (C) The nucleotide sequence around each junction point; AA indicates two inserted nucleotides.


