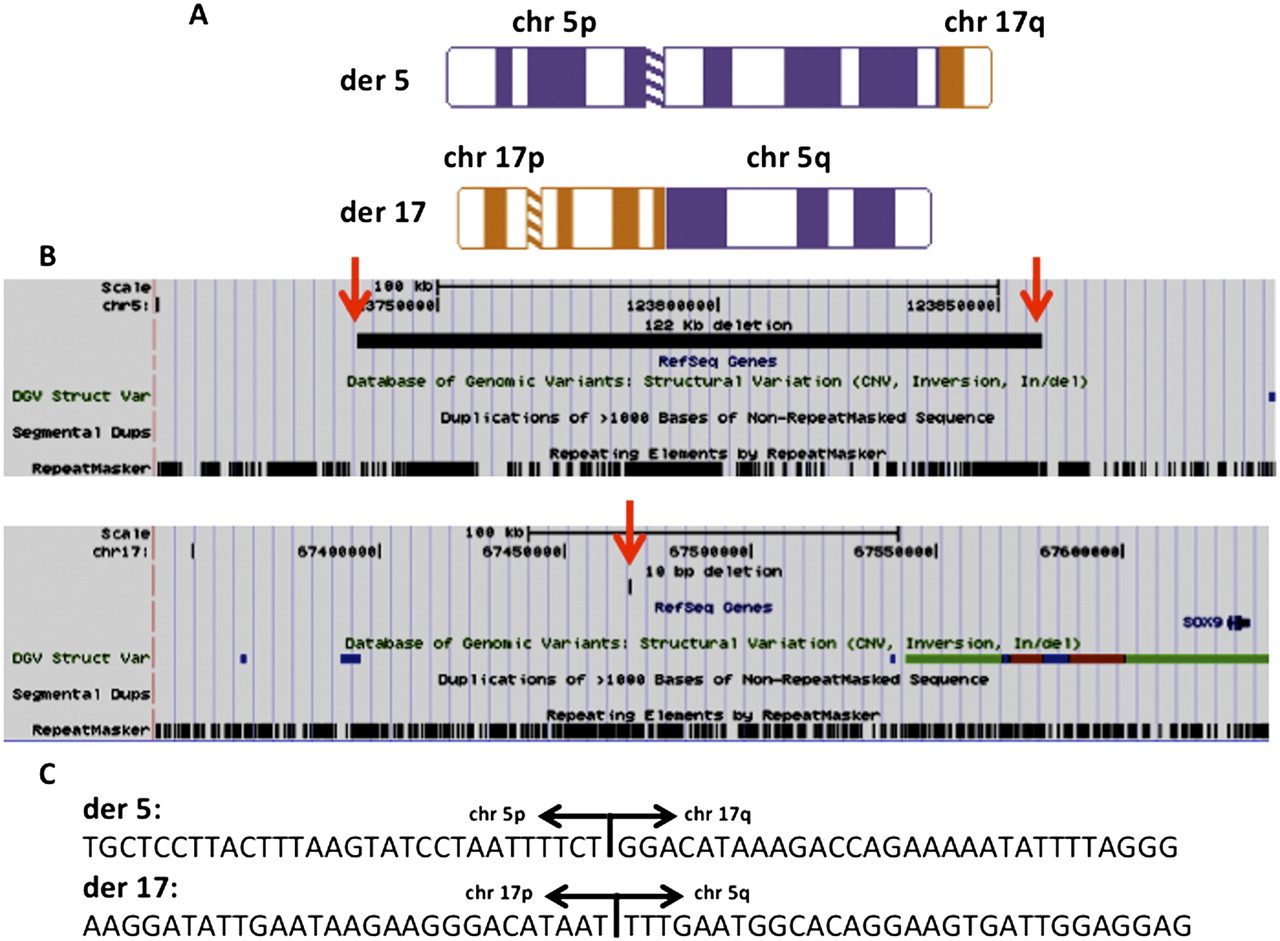
Characterization of complex chromosomal rearrangements by targeted capture and next-generation sequencing

(Downloading may take up to 30 seconds. If the slide opens in your browser, select File -> Save As to save it.)

Click on image to view larger version.

Figure 3.
Figure 3.

(A) Ideograms showing derivative chromosomes 5 and 17. (B) UCSC Genome Browser information around the breakpoint regions. (Red arrows) Exact breakpoint on each chromosome, with the same conventions as described for Figure 1. (C) The nucleotide sequence around each junction point.

This Article

  1. Genome Res. 21: 1720-1727

Preprint Server