
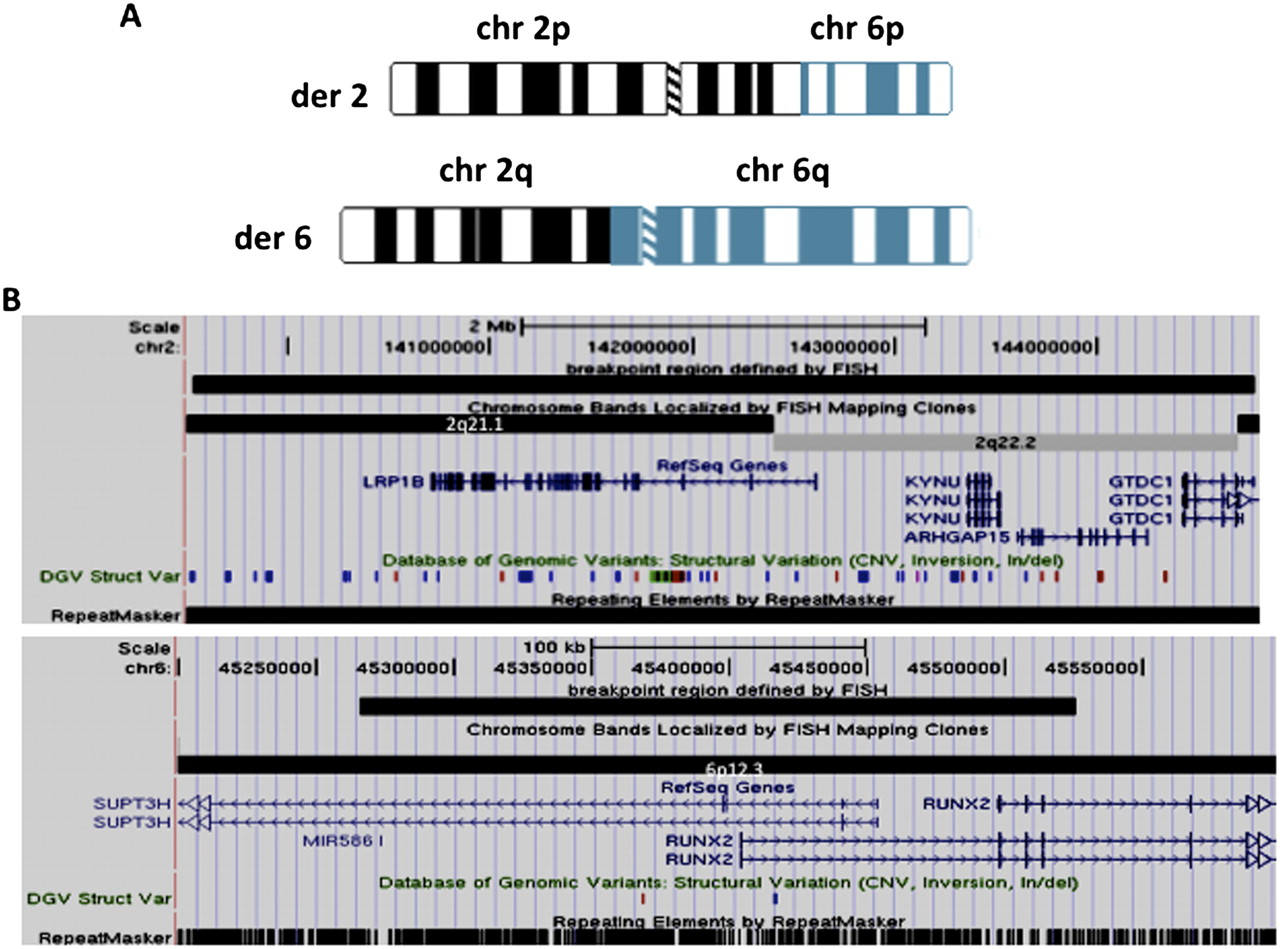
Figure 2.
(A) Ideograms showing derivative chromosomes 2 and 6. (B) UCSC Genome Browser information around the breakpoint regions with the same conventions as described for Figure 1.
(Downloading may take up to 30 seconds. If the slide opens in your browser, select File -> Save As to save it.)
Click on image to view larger version.
(A) Ideograms showing derivative chromosomes 2 and 6. (B) UCSC Genome Browser information around the breakpoint regions with the same conventions as described for Figure 1.
 CiteULike
 Delicious
 Digg
Digg Facebook
 Google+
 Reddit
 Twitter
