
Abstract
A large gene expression database has been produced that characterizes the gene expression and physiological effects of hundreds of approved and withdrawn drugs, toxicants, and biochemical standards in various organs of live rats. In order to derive useful biological knowledge from this large database, a variety of supervised classification algorithms were compared using a 597-microarray subset of the data. Our studies show that several types of linear classifiers based on Support Vector Machines (SVMs) and Logistic Regression can be used to derive readily interpretable drug signatures with high classification performance. Both methods can be tuned to produce classifiers of drug treatments in the form of short, weighted gene lists which upon analysis reveal that some of the signature genes have a positive contribution (act as “rewards” for the class-of-interest) while others have a negative contribution (act as “penalties”) to the classification decision. The combination of reward and penalty genes enhances performance by keeping the number of false positive treatments low. The results of these algorithms are combined with feature selection techniques that further reduce the length of the drug signatures, an important step towards the development of useful diagnostic biomarkers and low-cost assays. Multiple signatures with no genes in common can be generated for the same classification end-point. Comparison of these gene lists identifies biological processes characteristic of a given class.
Expression microarray data have been used to classify biological samples in a number of novel ways such as by tumor type (Golub et al. 1999), toxicological mode of action (Thomas et al. 2001; Waring et al. 2001), and pharmacological mechanism (Gunther et al. 2003). Our interests are to characterize the pharmacologic and toxicologic mechanisms of new chemical compounds relative to known compounds and drugs. We have assembled a large microarray data set derived from in vivo drug-treated rats in order to provide a reference database so that the significance of various expression patterns might be rapidly judged. This database is composed of over 13,000 microarrays and encompasses the response of rats to 630 different approved drugs and certain biochemical and environmental toxic standards, as well as a number of drugs withdrawn from the market. The studies are all performed at two or more doses, four or more timepoints, and in biological triplicate. All studies are accompanied in the same experiment by traditional toxicological and animal physiology measurements, a variety of biochemical measurements, and careful curation of critical pharmacological and pathway literature associated with compounds and pathologies, creating a multidomain database that places each drug in its full physiological, pathological, and gene expression context (a full description of this database is presented by Ganter et al. 2005).
Deriving classification information from large databases presents several challenges. An essential first step to addressing this problem is careful examination of current mathematical methods and new methods to determine the advantages and disadvantages of the various methods. Here we compare several standard and some newer classification algorithms. Classification algorithms can be separated into two main categories: supervised and unsupervised. Examples of unsupervised clustering methods include principal component analysis (PCA), hierarchical clustering, and self-organizing maps (Hastie et al. 2001). With two-dimensional hierarchical clustering, one of the earliest methods used to analyze microarray data (Eisen et al. 1998), one can visually relate groups of treatments to groups of genes. PCA can also cluster treatments in two or three dimensions using genes as variables. Each of these dimensions, the principal components, is a linear function of all the initial variables. The coefficients of this function (eigen values) can be used to rank the contribution of each of the initial variables to each principal component. A group of treatments separating along one of the principal components can thus be related to a set of genes. These methods allow a rapid visual inspection of the data but fail to provide an unbiased objective classification. Thus while unsupervised methods are useful for class discovery and can relate groups of observations to groups of variables, they do not provide decision rules for classification.
Supervised methods rely on known descriptors (phenotypes) associated with each observation (drug or chemical treatments). The descriptors can be of several types; for example, they could include histopathological observation of a particular lesion type associated with a given treatment, or they could be derived from a literature report showing that a particular compound causes liver cancer after more than one year of treatment. The descriptors are used to define two or more classes. A separation function is derived that classifies each observation into these classes. Examples of supervised classification methods include support vector machines (SVMs), decision trees, logistic regression, and neural nets (Hastie et al. 2001). Multi-class problems can be reduced to multiple two-class classifications (class-of-interest vs. all other classes) using the same methods. Supervised classification methods can be further subdivided according to two other important attributes: whether they use a linear or a nonlinear separation function and whether all or just a subset of the variables are used in the separation function. Both of these attributes impact the ability of the biologist to interpret the classification function and the ability of technologists to develop simple robust and inexpensive assays to classify future samples. Particularly attractive from an interpretation point of view are linear classifiers which can be reduced to a simple weighted gene list or “signature.” We show below that the absolute values of the weight and of the weighted expression provide an indication of the relative importance of each gene in the signature, whereas the sign of the weight indicates the direction of regulation. Minimizing the length (number of genes) of the classifier also helps in the interpretation of the signatures and allows for future robust inexpensive assay development. For example, the superior performance of linear SVM over weighted voting (WV) or k-Nearest Neighbor (k-NN) was illustrated (Ramaswamy et al. 2001). However, those authors also show that in their linear SVM implementation, the best classifiers use thousands of genes. The participation of this many genes in the classifier greatly complicates the task of interpretation and their use in a diagnostic device. Nonlinear kernel SVMs and neural nets can produce powerful classifiers, but they cannot be reduced to simple gene lists. Indeed, nonlinear classifiers output a list of weights that correspond to complex, nonlinear compositions of genes (e.g., the ratio of two genes, the logarithm of a gene, etc.).
Our goal is to provide short interpretable signatures that are reducible to a diagnostic device and that have a high performance for the response of a biological system to chemical treatments. Thus, the analysis is focused on a family of new linear classification methods including sparse linear programming (SPLP) and sparse logistic regression (SPLR) (El Ghaoui et al. 2003). The novelty of these methods is their utilization of the standard error of the mRNA response, available because all treatments presented here were performed in triplicate. Data replication is commonly used to assess the statistical significance of an individual gene expression data point. We show here that this information can also be utilized by these algorithms in order to produce high-performance short linear classifiers.
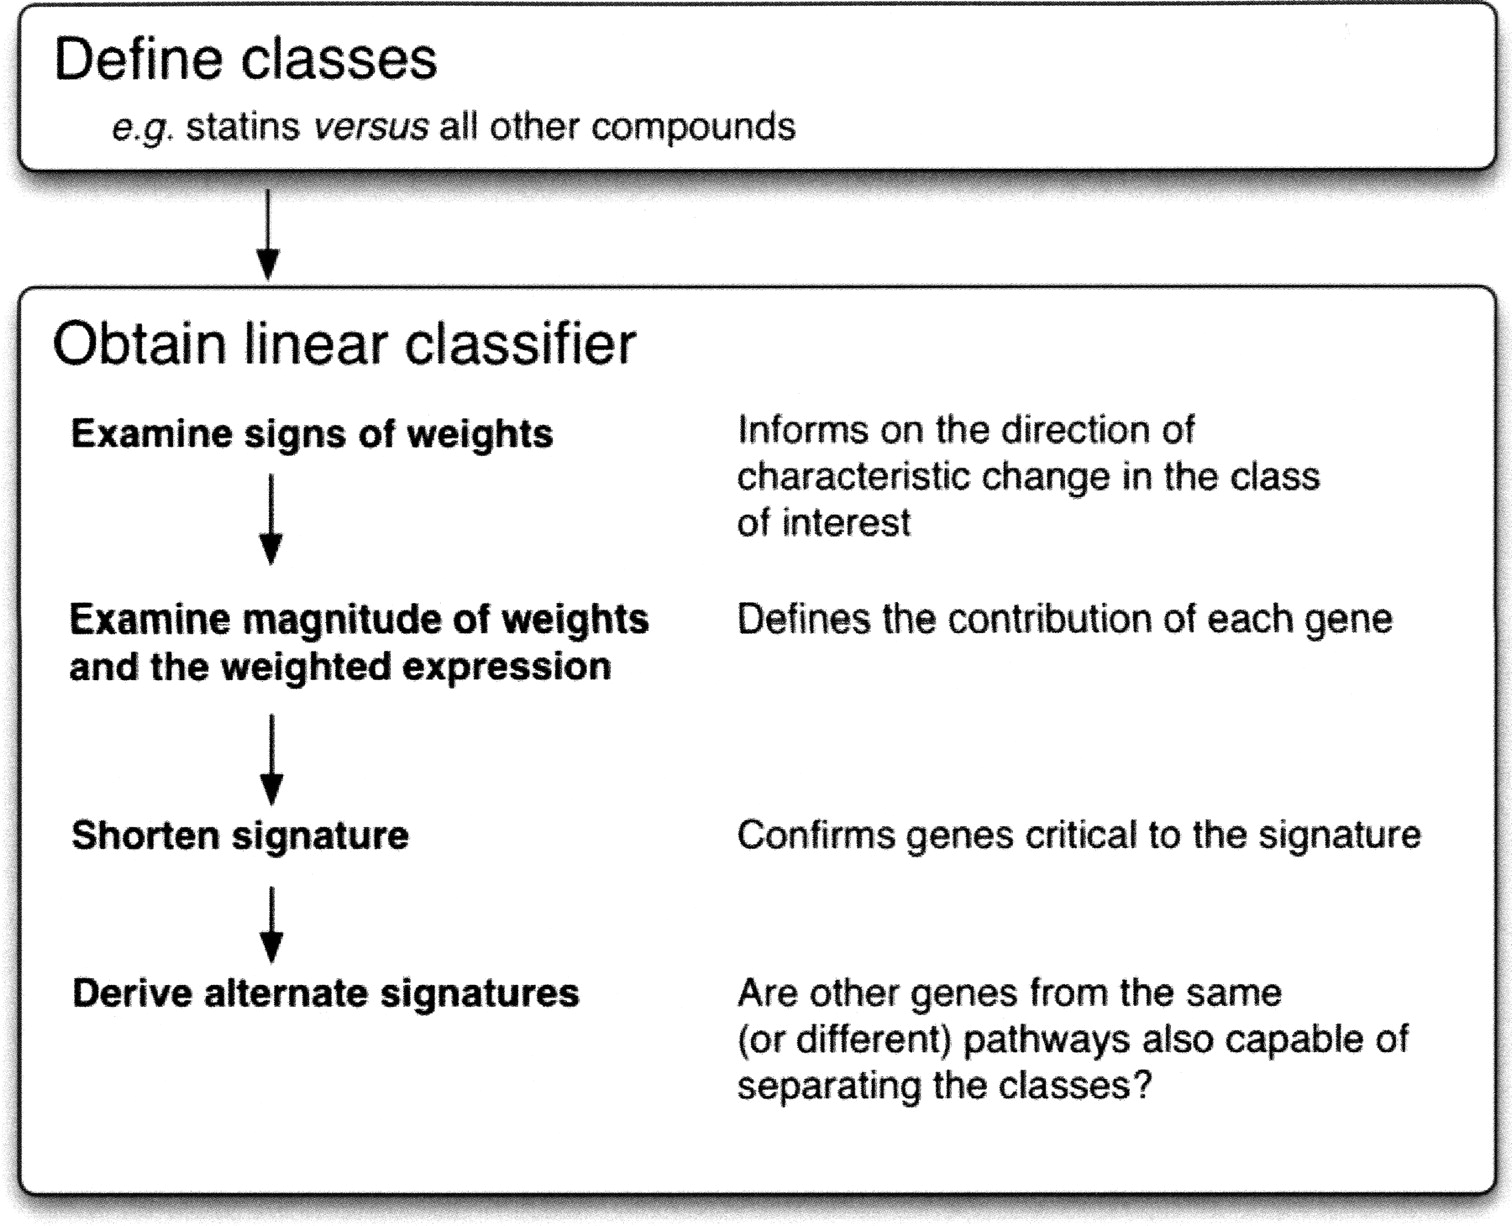
The performance of these linear classifier algorithms (SPLP, SPLR) is compared to that of several nonlinear alternatives (kernel SVMs, decision trees, and neural nets). Their behavior is then analyzed in greater detail. Signatures for two compound classes, fibrates and statins, are described and interpreted in biological terms. Evidence is provided that the specific genes used, the weights associated with these genes, and the weighted expression of these genes in the class-of-interest can all be used to extract valuable information (Fig. 1).
Use of short linear classifiers, a general outline for the interpretation of signatures.
Results
Data set description
Male Sprague-Dawley rats were treated daily with compounds at two doses and for several durations. The doses used were an estimate of the upper limits of toxicity as determined by a dose-range finding study (i.e., the maximum tolerated dose, MTD), and a dose intended to approximate the pharmacologically active dose (i.e., the fully effective dose, FED) estimated from literature information. Animals (three rats per dose group per timepoint) were dosed once daily and sacrificed after 0.25, 1, 3, 5, or 7 d. Up to 12 tissues were harvested, RNA was extracted, and microarray hybridization was performed with each biological sample. The microarray data for the three animals per time and dose group were averaged and were expressed as the log10 ratios relative to untreated controls. A random subset of the data was analyzed using PCA in order to illustrate the relative contribution of tissue differences versus drug-induced differences to the total variability of the data set. In addition, 597 arrays corresponding to 199 triplicate treatments with 22 drugs and toxicants were set aside for a detailed study of classification algorithms and the resulting signatures. The treatments (see Supplemental Table S1) correspond to four classes (fibrates, statins, azoles, and toxicants) based on literature descriptions of structural and mode of action similarities between compounds (Hardman et al. 2001; Klassen 2001). Three of the classes, azoles, fibrates, and statins, correspond to well known drugs with a defined mode of action, all targeting some aspect of lipid metabolism; the fourth, toxicants, is a class containing diverse structures and mechanisms but for which various kinds of toxicity is well documented in the literature. The four classes were chosen to represent what we know to be very-easy to very-hard classification challenges (fibrates easy, statins and azoles moderate, and toxicants hard). By selection of these ranges of difficulty we are able to show the generality of the conclusions and assessments made in this study.
Fibrates are a family of drugs used to treat hypercholesterolemia and lipidemia. Their pharmacologic effects are attributed to the direct receptor-ligand-mediated activation of the peroxisome proliferator activated receptor alpha (PPARα) (Kersten et al. 2000). One major transcriptional outcome resulting from activation of the PPARα receptor is the expression of a large number of genes belonging to the fatty acid β-oxidation pathway (FABO) (Schoonjans et al. 1996), and which localize to the mitochondria and the peroxisomes. FABO induction is likely responsible for the lowering of triglycerides and low-density lipoprotein (LDL) levels. In humans, fibrates also raise high-density lipoprotein (HDL) levels through the induction of its major apolipoprotein, apoAI. In rats the opposite effect is observed, i.e. a decrease in apoAI and in HDL, due to a nonfunctional response element in the rat apoAI promoter and repression by rev-erb α (Vu-Dac et al. 1998). In rodents, in particular rats and mice, fibrates stimulate proliferation of hepatic peroxisomes, recognizable at the transcriptional level by the induction of a large number of genes whose products are ultimately localized in the peroxisome (Lee et al. 1995).
Statins inhibit HMG-CoA reductase, the rate-limiting step of cholesterol biosynthesis (Alberts et al. 1980). Inhibition of endogenous cholesterol synthesis induces many cholesterol biosynthesis genes through a positive feedback mechanism. Statins lower blood cholesterol levels by inhibiting cholesterol synthesis, resulting in increased expression of the LDL receptor gene and decreased levels of circulating LDL. Specifically, decreased intracellular cholesterol triggers the proteolysis of membrane-bound sterol regulatory element-binding proteins (SREBPs), which translocate to the nucleus and bind to sterol-responsive elements (SREs) in the enhancers of many genes encoding enzymes of the cholesterol biosynthesis, fatty acid biosynthesis, triglyceride biosynthesis, and lipid uptake pathways (Brown and Goldstein 1999; Horton and Shimomura 1999).
Azole antimycotics inhibit fungal 14-α demethylase, a microsomal, cytochrome P450-dependent enzyme system. Inhibition of fungal 14-α demethylase impairs the synthesis of ergosterol, the main fungal membrane sterol, leading to the detrimental accumulation of lanosterol (van den Bossche et al. 1978). In mammals, azoles inhibit steroid biosynthesis and xenobiotic metabolism through inhibition of host cytochrome P450-dependent enzyme systems, which can result in a number of reproductive sequelae as well as clinically significant drug–drug interactions (Venkatakrishnan et al. 2000).
The fourth class, designated in this study as “toxicants,” does not represent drugs; instead, they are a heterogeneous class of hepatotoxic compounds with different modes of action. We included this broad class of toxicants to test the ability of each classification algorithm to derive classifiers for compounds with diverse modes of actions.
Although the induction of FABO and cholesterol genes is expected to form at least part of the fibrate and the statin signature, respectively, it is not certain whether these effects alone are sufficient to form the basis of the best-performing classifiers. The expected composition of an azole or a toxicant signature is more speculative. As described above, the azoles affect a variety of host P450-dependant enzymes in addition to their intended fungal target, and the compounds grouped under the “toxicant” label have different modes of action.
Tissue versus drug treatment-induced differences
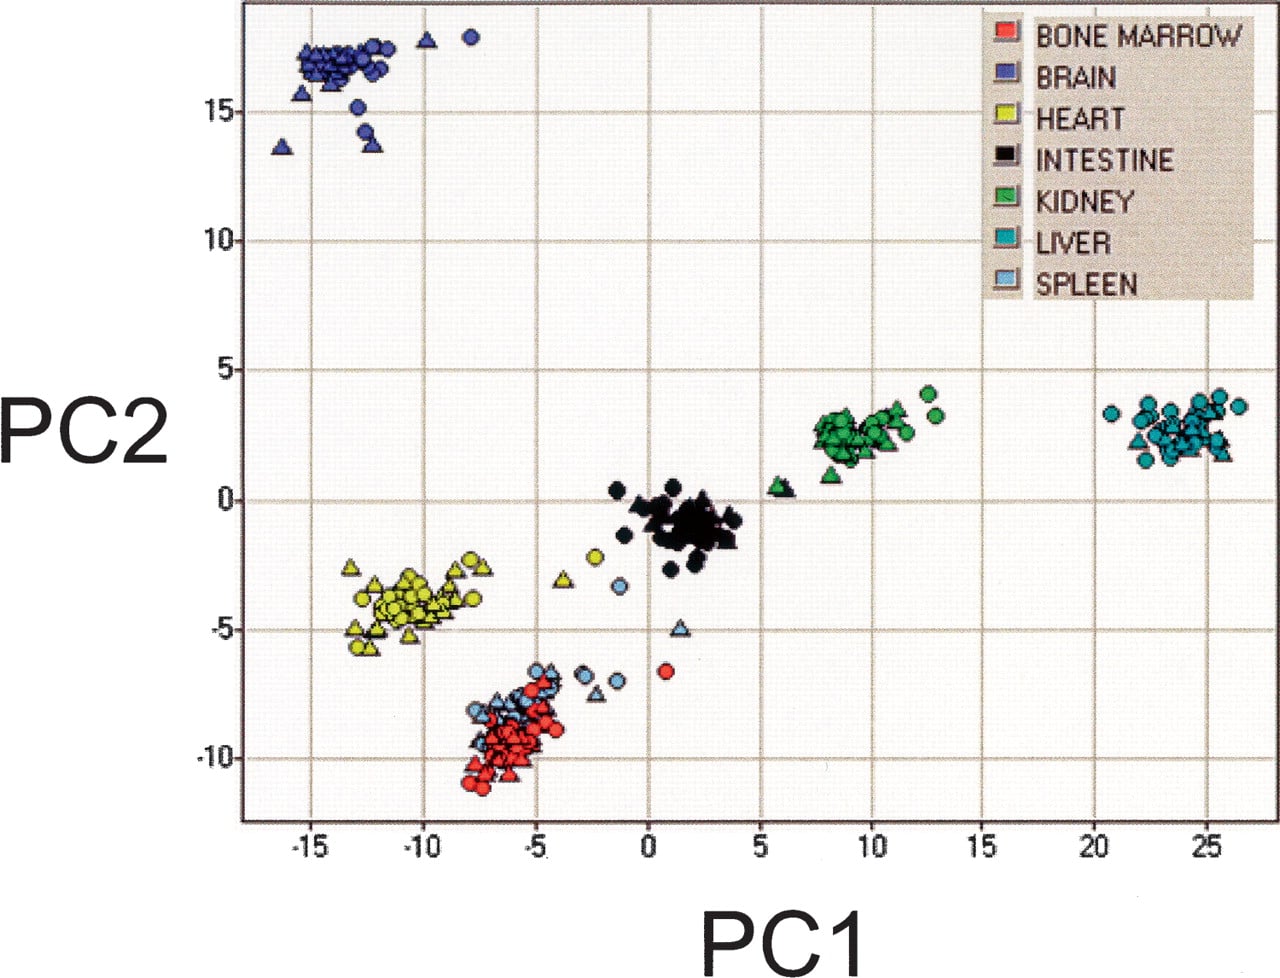
Twenty-five microarrays derived from untreated and 25 microarrays derived from treated animals were randomly selected from each of seven tissues to provide a general impression of the data landscape and to demonstrate some of the qualities of the data set. The signal intensities of the probes for these 350 arrays were clustered using two-dimensional (2D) PCA. Well resolved tissue-based clusters are evident (Fig. 2). As one might expect, as both are hematopoietic organs, spleen and bone marrow are partially overlapping. Treated and control arrays are not resolved using this analysis method. These data are a visual if not quantitative illustration that the differences in tissue expression are larger than drug-induced differences within a tissue. Resolving gene expression profiles induced by different classes of drugs within a tissue appears to be a more subtle question than resolving tissue- or cell-type differences. The complexity of this task is compounded by drug class heterogeneity, as each drug has unique pharmacokinetic, pharmacodynamic, and intrinsic efficacy properties. To provide some indication of these drug-specific features, we prepared a liver-derived data set comprised of several drugs from each class, and we tested them at multiple times and doses.
Two-dimensional principal component analysis (PCA) of log10 signal intensities in arrays derived from 25 treated and 25 untreated rats in seven tissues. The 500 genes with the highest standard deviation across the resulting 350 arrays were selected for this analysis. PCA was implemented in the Spotfire Decision Site software package (http://www.spotfire.com). Samples are colored by tissue of origin. Circles are samples derived from drug-treated animals, and triangles are from untreated controls.
Description of the SPLP and SPLR classification algorithms
Because all treatments were conducted in biological triplicate, every data point (treatment) can be represented by the smallest hyper-rectangle that encloses all three replicates. More formally, a nominal data matrix of treatments versus genes containing the average expression log-ratios can be formed, as can a standard error matrix of the same size that contains the corresponding standard errors. These provide an interval matrix model, in which each data point is unknown but bounded within a high-dimensional rectangle. This hyper-rectangle has as its center the nominal value, and its dimensions correspond to the respective standard errors for each gene in the expression measurement. To accurately classify data points into a class or exclude it from a class (binary classification), algorithms are used which seek a closer match between the available data and the class utilizing binary, linear classification methods based on an interval matrix uncertainty model for the data. In this way, the standard error matrix is exploited. A robust methodology is devised where the worstcase value of a loss function is minimized over all possible realizations of the data within given interval bounds.
Two specific choices of a loss function are considered. The first, the Hinge loss, is used in the context of soft-margin support vector machines (Cristianini and Shawe-Taylor 2000; Scholkopf and Smola 2002). The second loss function is the negative log likelihood function used in logistic regression (Hastie et al. 2001).
In each case we developed both a robust version of the algorithm, using the entire standard error matrix information, and a sparse version, optimizing an upper bound on the proposed loss function where only a summary of the standard error matrix is used, the average standard errors per gene in this case. The advantage of optimizing an upper bound on the loss function in the latter case is that it leads to an explicit 1-norm regularization on the weight vector. This type of regularization is known to give rise to a sparse classifier, i.e., many zeros in the optimal weight vector (El Ghaoui et al. 2003). In the robust algorithm, the size of the earlier mentioned hyper-rectangles can vary for each treatment, whereas in the sparse algorithm, this uncertainty region has the same shape for every treatment, given by the gene-wise average standard errors over all treatments. Preliminary tests showed that the robust algorithms have a slightly higher performance but result in longer classifiers. Because a premium is placed on interpretability and diagnostic device compatibility, we are focusing on the sparse algorithms, here referred to as sparse linear programming (SPLP) and sparse logistic regression (SPLR).
Description of the other algorithms used in the comparison
The performances of SPLP and SPLR were compared to that of a simpler method, the t-rank algorithm, and to several other more complex nonlinear classification methods, Gaussian kernel SVMs, decision trees, and neural nets. The t-rank algorithm creates signatures that consist of the genes with the largest average class differences measured by a version of the t-test. The gene selection in the algorithm is similar to the weighted voting scheme (Golub et al. 1999). This algorithm is included because of its immediate intuitive meaning; it identifies the genes with the largest change relative to their standard error. Decision trees have the advantage of producing simple rules but are known to be prone to overfitting, since they perform well on the training but poorly on the test data. We used the C4.5 algorithm in this comparison (Quinlan 1993). Neural nets are powerful classifiers and are included in the comparison. The multilayer perceptron neural network was used, as implemented in the SPSS-Clementine software package. Although neural nets are nonlinear classifiers and cannot be reduced to simple weighted gene lists, one can nevertheless perform a sensitivity analysis to evaluate the importance of each input (gene) in the final network (Fu 1994). Finally, SVMs for different kernel functions were evaluated. These state-of-the-art classifiers are known for their superior classification performance in a range of applications. The resulting classifier is nonlinear, where the type of nonlinearity is implicitly encoded in the choice of kernel function: A polynomial kernel of degree 2, for example, implicitly takes the squares and pairwise products of the gene expression levels into account in addition to the gene expression levels themselves, as a linear classifier does. Other kernels such as polynomial kernels of higher degree and Gaussian kernels implicitly take other nonlinearities into account. Polynomial and Gaussian kernels were tested; Gaussian kernels had lower test error rates, and thus we report here results obtained with Gaussian kernels. These kernel SVM classifiers, as is the case with neural nets, are not as interpretable as the linear classifiers described above.
Comparing performance of algorithms
Each algorithm was used to answer all four classification problems within the 22-compound liver-derived data set described above. The cross-validated performance of each algorithm is reported as the average training and the average test error rate over 20 (60% training, 40% test) random partitions of the data. As a global metric, the average of each rate over the four classification problems is presented (Table 1). Algorithms are ranked left to right according to their average test error. Decision trees have the worst test error, followed by the t-rank algorithm. Linear classifiers (SPLP and SPLR) perform much better than decision trees and the t-rank algorithm, but slightly worse than the two nonlinear methods. The improved performance of the nonlinear classifiers (Kernel SVM and NN) over the linear ones (SPLP, SPLR) results in large part from an improved performance in the toxicant class prediction. For the more mechanistically homogeneous classes (azoles, fibrates, and statins), the difference between the performance of the linear and the nonlinear methods is much smaller. In fact, SPLR yields the best azole signature.
Error rates of algorithms in four classification problems
Decision tree | t-rank | SPLPa | SPLRa | Gaussian Kernel SVM | Neural net | |
|---|---|---|---|---|---|---|
| Test errorb | ||||||
| Azoles | 7.2 | 10.3 | 5.8 | 4.1 | 6.8 | 4.4 |
| Fibrates | 14.6 | 4.0 | 1.6 | 2.8 | 1.3 | 1.1 |
| Statins | 23.7 | 9.3 | 6.4 | 5.6 | 6.5 | 5.4 |
| Toxicants | 14.1 | 18.0 | 10.7 | 11.9 | 5.6 | 5.7 |
| Average | 14.9 | 10.4 | 6.1 | 6.1 | 5.0 | 4.2 |
| Training error | ||||||
| Azoles | 0.2 | 6.0 | 0.0 | 0.0 | 0.0 | 0.0 |
| Fibrates | 0.9 | 5.0 | 0.5 | 0.0 | 0.0 | 0.0 |
| Statins | 0.7 | 9.0 | 3.0 | 0.0 | 0.0 | 0.0 |
| Toxicants | 0.7 | 15.1 | 0.0 | 0.0 | 0.0 | 0.0 |
| Average | 0.6 | 8.8 | 0.9 | 0.0 | 0.0 | 0.0 |
a SPLP and SPLR were run with ρ values of 0.08 and 0.0025, respectively.
b Test error is an average rate for each classification over 20 random partitions of the data.
Detailed analysis of SPLP and SPLR algorithms: Control of signature length, sensitivity and specificity, effect of data filtration, and gene preselection on classification performance
SPLR and SPLP methods are dependent on a single parameter, ρ. This parameter trades off the sparsity of the signature with the error rate on the training set. Both objectives are related to corresponding terms in the respective cost function for SPLP and SPLR. For higher values of ρ, more importance is given to the sparsity term. As ρ gets higher, the signatures shorten and the classifier can model less-complex separations, resulting in more errors on the training set. In contrast, a small training error requires a more complex classifier that has more genes that have non-zero weights: Sparsity must be sacrificed to decrease error (El Ghaoui et al. 2003).
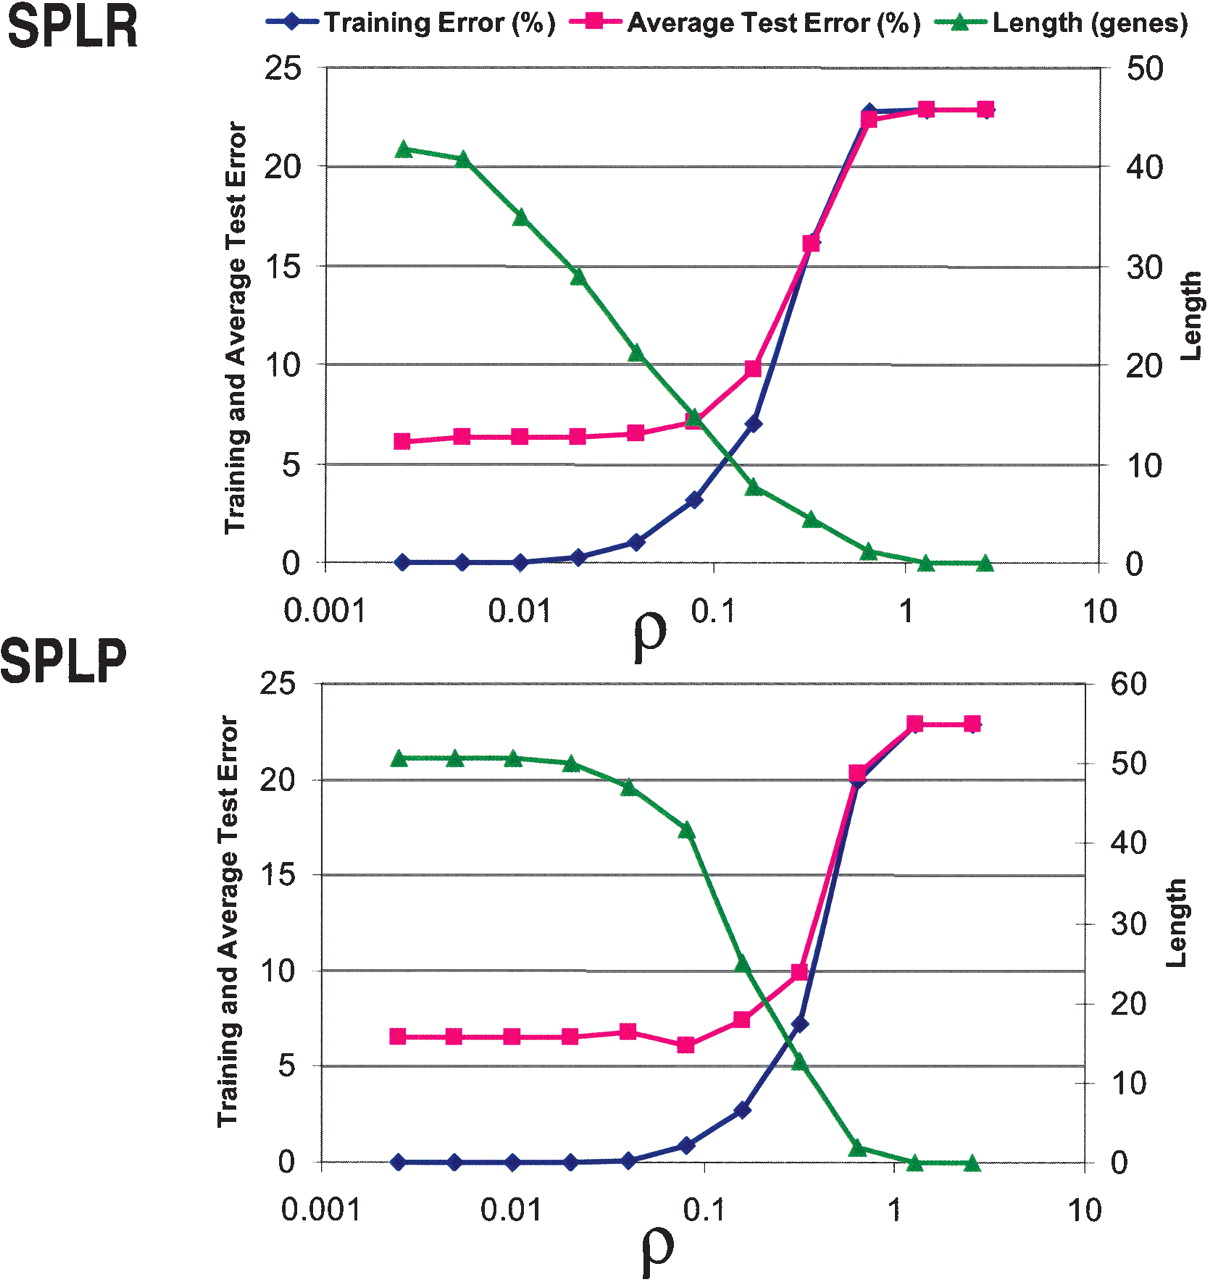
We investigated the behavior of SPLP and SPLR as a function of ρ. Figure 3 shows the average training error, average test error, and the average signature length across the four different signatures. Three ranges of ρ values can be defined. For values of ρ ≤ 0.02, SPLP and SPLR produce no training error. For ρ = 0.02 the average length of SPLR signatures is approximately half that of SPLP (29 vs. 50). For values of ρ between 0.02 and 0.08 (SPLR) or 0.16 (SPLP), the training error rate starts to rise but the test error remains close to its minimum. At the high end of this range of ρ, the average signature length is 15 for SPLR and 25 for SPLP. This condition is interesting because it minimizes signature length without compromising the test error rate. The overtraining gap (test error minus training error) is thus greatly reduced. For higher values of ρ, the overtraining gap disappears and both error rates rise substantially. Thus, a judicious choice of the ρ parameter can reduce the signature length by 50% with no loss in test performance. In practical applications, optimal tuning of the ρ parameter can be performed for a specific signature by using cross-validation. Note that the optimal ρ is not a characteristic of the algorithm, so for each signature, ρ needs to be re-optimized. However, ρ values between 0.02 and 0.16 in general provide drug signatures with short lengths and very good performance.
Average training error, test error, and length of four complete signatures as a function of ρ for two algorithms, SPLR (top) and SPLP (bottom). Both errors are expressed as percent 100 × ((FP+FN)/N) where FP is false positive, FN is false negative, and N is the total number of tests. Training error and length results are averages for the four complete signatures. Test errors are averages of four signatures cross-validated three times.
To better understand the behavior of SPLP and SPLR, the performance of both algorithms was expressed in terms of logodds ratio, sensitivity, and specificity (Table 2). The specificity of both algorithms is higher than their sensitivity. This is due to a combination of two factors. First, in each of the four signatures, a comparatively small class-of-interest (ône-quarter of the treatments) is separated from the rest of the data set. In addition, false positive and false negative errors are not distinguished in the loss functions of SPLP and SPLR. We are currently modifying the loss function of SPLP in order to introduce two error terms, one for each type of error. This modified algorithm should prove useful in cases where one seeks a highly sensitive signature for a rare event (G. Natsoulis, G. Lanckriet, L. El Ghaoui, and K. Jarnagin, in prep.).
Logodds ratio, sensitivity, and specificity of SPLP and SPLR
Fibrates vs. All | Statins vs. All | Azoles vs. All | Toxicants vs. All | ||
|---|---|---|---|---|---|
| SPLP | logodds ratio | 6.38 | 4.74 | 5.18 | 4.11 |
| sensitivity | 0.88 | 0.70 | 0.90 | 0.78 | |
| specificity | 0.99 | 0.98 | 0.96 | 0.95 | |
| SPLR | logodds ratio | 6.45 | 4.94 | 5.67 | 4.74 |
| sensitivity | 0.88 | 0.75 | 0.89 | 0.76 | |
| specificity | 0.99 | 0.98 | 0.98 | 0.97 |
The effect of filtering the individual log ratio data points and of preselecting genes on the performance of SPLP and SPLR was investigated. Filtration as used here is the process of resetting to zero the logratio of the expression levels that are not found to be significantly different from zero in the data matrix. The ratio of the variability of the logratio to the mean logratio was used to filter the data, resulting in matrices where 86% and 62% of the data points are reset to a logratio of zero. Preselection is the process by which a subset of initial variables is chosen prior to submission to the classification algorithm. The standard deviation of the mean logratio across all 199 experiments was used to select 1000, 5000, or all 9031 genes. Several combinations of gene preselection and data filtration were investigated. The average computation time per signature (threefold cross-validated) was 220 sec for SPLP, using all genes and a full data matrix. Computations were performed on an Intel Pentium IV, 1.5-Ghz desktop computer. The computation time was reduced fivefold when 86% of the data was filtered and all genes were used. The computation time was reduced eightfold when just 1000 genes were preselected and the data was not filtered. While both of these processes drastically reduce the computation time of the algorithms, we found that data filtration negatively impacts performance whereas gene preselection does not, at least within the ranges tested here (data not shown). These results suggest that in cases where rapid initial investigation of multiple signatures is needed, gene preselection strategies are preferable to data filtration strategies.
Classifying random label sets
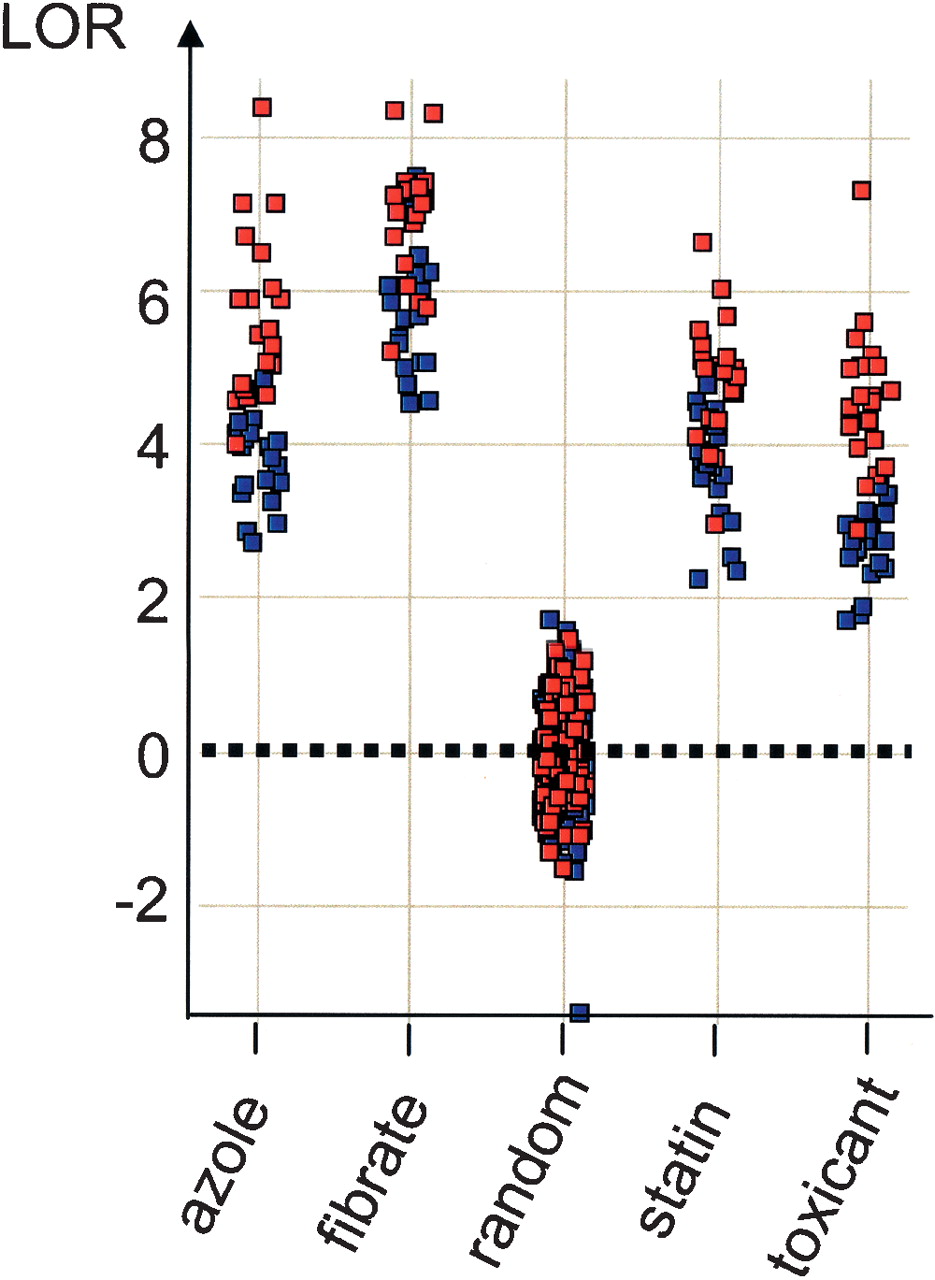
In order to show that the classifications are significant, the training and test errors produced by SPLP and t-rank when asked to classify random label sets were examined. Briefly, we generated 100 random label sets, keeping the size of the class-of-interest one-quarter of the total number of samples. This is commonly called a label permutation test. Each of the random label sets was split 60/40 as described in the Methods section. A signature was derived from the training set and used to classify both the training and the test sets. The distribution of the test errors, expressed here as logodds ratios (LORs), is presented in Figure 4. Twenty cross-validation runs of the same four “real” label sets used above are included for comparison. When classifying random labels, the test errors for both algorithms are indistinguishable and closely centered on LOR = 0, as expected by chance only. Both algorithms perform significantly better on real label sets, with SPLP clearly outperforming t-rank on all four classification tasks. These results demonstrate that both algorithms do indeed identify useful patterns in the true data but not in the random data. SPLP is clearly superior to the t-rank algorithm in terms of classification accuracy.
Test performance of SPLP (red) and t-rank (blue) algorithms classifying real and randomized label sets. Test logodds ratio (LOR) is plotted in 20 cross-validation runs against fibrates, statins, azoles, and toxicant label sets and in 100 cross-validation runs against 100 different random label sets. An LOR of zero, which is expected from random chance, is marked with a dotted line.
Analysis of signatures for drug classes
For any given signature, the equation of the hyperplane separating the two classes is Σwixi – b = 0, where wi are the weights assigned by the algorithm, xi is the log-ratio values for each signature gene in that sample, and b is the bias term. The decision to assign a sample to a given class is given by the scalar product: S= Σwixi – b. A scalar product greater than zero places a sample into the given class, whereas a scalar product less than zero places a sample out of the class. The weights, wi, determine the orientation of the hyperplane in the space of the signature genes, and the bias term, b, determines its position along an axis perpendicular to the hyperplane. Intuitively the bias term can be understood as a threshold along the direction of the signature.
To understand the biological basis on which the linear classifier-based signatures gain their predictivity, we analyzed in greater detail some of the fibrate and statin signatures produced by the SPLR algorithm. SPLR was chosen because it produces shorter signatures. The fibrate and the statin signature derived from the first random partition are presented in Table 3. The first signature, fibrate_SPLR/1, is eight genes long, produces no training errors, and produces just two test errors. Six genes are positively weighted and comprise several FABO genes (acyl-CoA oxidase, acetyl-CoA acyltransferase, enoyl-CoA hydratase, and acyl-CoA dehydrogenase). One of the two negatively weighted genes, acetoacetyl-CoA synthetase, is a cholesterol biosynthesis gene and is up-regulated by statin treatments; thus this gene penalizes statin treatments, improving performance by reducing false identifications of a statin as a fibrate. The other is not annotated, but its pattern of expression is highly correlated with that of acetoacetyl-CoA synthetase; thus, this gene may also be a cholesterol biosynthesis gene.
A fibrate and a statin SPLR-derived signature
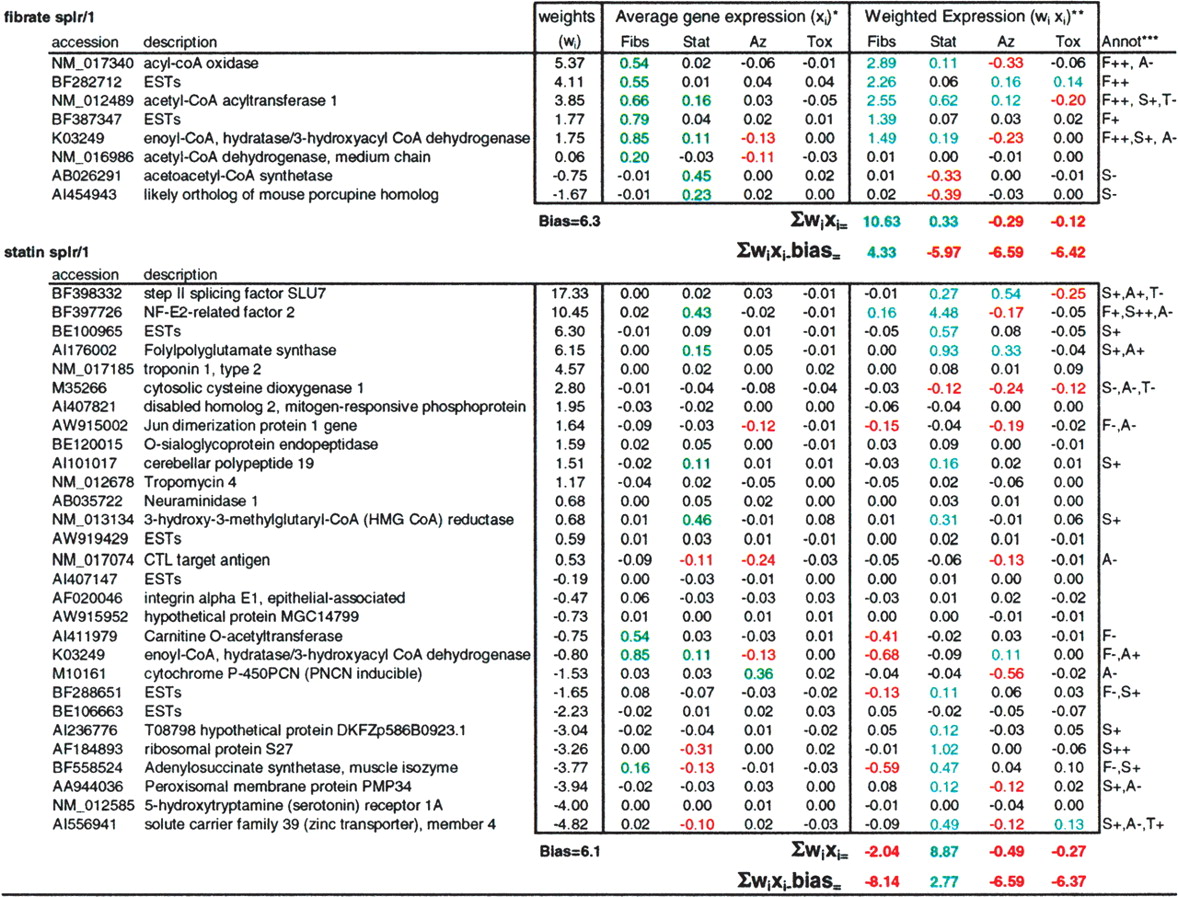
[i] The fibrate and statin signatures obtained using SPLR from the first partition of the data. Figure 1 describes the general process being followed.
Both signatures are “training signatures” in that they derived from a randomly selected 60% of the data.
Neither signatures produce training errors. The test set comprises 81 treatments of which 14 are fibrates and 15 are statins.
The fibrate signature produce two test errors and the statin signature produces four test errors. All test errors are false negatives for both signatures.
Genes are designated by their accession number, and a short description is provided.
The bias term is indicated below the weight column. Σwixi is the average weighted expression summed over all signature genes. Σwixi-bias, substracts the bias term.
*Average gene expression (logratio) of each signature gene in each of the four classes.
**Average gene expression over all members of the class multiplied by the gene specific weight. Values > 0.1 (Reward) are in green. Values < –0.1 (Penalty) are in red.
***Annotation of each signature gene. The letter designates the affected class, and the superscript sign designates the direction of the effect (reward or penalty).
One can further analyze the mechanics of each signature gene by creating a weighted expression table. It is informative to consider the average of the weighted expression (weighted expression = wixi) over the class-of-interest and the average weighted expression of the out-of-class samples grouped according to meaningful categories (we use here the same statin, azole, and toxicant classes). Each gene can now be annotated as to its positive (“reward”) or negative (“penalty”) contribution to the overall decision (Table 3, right panel). Note that the concept of reward and penalty refers to the sign of the weighted expressions, not the sign of weight. Five of the six positively weighted genes are strong reward genes for the average fibrate treatment. In doing so we observe that acyl-CoA oxidase is not only a strong reward for fibrate treatments but also a weaker reward for statin and a penalty for azole treatments. This analysis illuminates the role of the negatively weighted genes in this signature. Both of the negatively weighted genes act as penalties for statins, which tend to be weakly rewarded by several positively weighted FABO genes. It is striking to note that neither of these two genes is regulated by fibrate treatments (Table 3, left panel). The algorithm makes use of genes showing no regulation in the class-of-interest as penalty genes in order to avoid producing false positive calls. T-rank-derived signatures cannot capture genes with this type of behavior, and thus at least part of this method's weak performance is easily explained. As noted above, the concept of reward and penalty genes refers to the sign of the weighted expression. Therefore a negatively weighted down-regulated gene is also a reward gene. An example of this situation is seen with the statin_SPLR/1 signature (Table 3). The adenylosuccinate synthetase gene acts as an even stronger reward for statins than does the up-regulated HMG CoA reductase. Of all the genes in this signature, HMG CoA reductase is the most up-regulated by statins; however, NF-E2-related factor 2 acts as a stronger reward gene for statins. HMG CoA reductase shows 20% as much up-regulation in toxicant as in statin treatments. NF-E2-related factor 2, on the other hand, is down-regulated by both azoles and toxicants and shows very minor up-regulation by fibrates. This may explain why the algorithm weighs NF-E2-related factor 2 fifteen times more than it does the HMG CoA reductase gene in the statin signature. Finally, whereas cholesterol pathway genes were used as penalty for statin treatments in the fibrate SPLR/1 signature, FABO genes (enoyl CoA hydratase and carnitine O-acetyltransferase) are strong penalty genes for fibrate treatments in the statin SPLR/1 signature. In some sense these two signatures could be viewed as mirror images of each other.
We performed a sensitivity analysis of the neural net-derived fibrate and statin signatures. Sensitivity analysis ranks all genes by their importance in the network. The top 30 ranked genes for each analysis are presented in the Supplemental material (Table S2). There are obvious similarities between the neural net sensitivity lists and the SPLR-based signatures described above. For instance enoyl-CoA hydratase, a FABO gene and mevalonate kinase, a cholesterol biosynthesis gene are ranked 7th and 24th, respectively, in the fibrate signature sensitivity list. The classification rule used by the network cannot however be deduced from the examination of the sensitivity list. Any assumption that these genes perform for the network a role similar to what has been described above for genes in the same pathway in the SPLR-based fibrate signature (Table 3) would be speculative.
It is interesting to note that when we re-derive a signature using SPLP and ρ = 0.005 for the same classes within the context of all the liver treatments (∼1400 treatments) as opposed to the restricted 199 treatment subset, the test logodds ratios are approximately the same. However, the sensitivity of the signature tends to decrease, the specificity tends to increase, and the length of the signature more than doubles. For example, in the fibrate case we obtain sensitivity and specificity values of 0.50 and 0.998, respectively and a logodds ratio of 6.2. The length of the signature is 65 genes. This behavior is what would be anticipated when one moves from a small restricted data set to a much more varied and larger data set. The number of variables needed to separate the classes increases.
Short signatures
One of our goals is to produce interpretable and diagnostic device-friendly signatures involving as few genes as possible. However, directly optimizing this objective, i.e., minimizing the number of non-zero-weights (the “0-norm” of the weight vector), is a mathematically difficult problem. The proposed sparse algorithms approximate this objective by minimizing the smallest convex upper bound on this quantity, i.e., the 1-norm of the weight vector. This results in a problem that can be solved significantly more easily. A compromise arises since the approximation will deliver a suboptimal solution: although the resulting signature will clearly be quite sparse already—we showed how to vary the value of ρ in order to produce shorter signatures without compromising test performance—it might well not yet be the shortest one possible. Therefore, feature selection techniques could be used in conjunction with our algorithms to trim the resulting signatures further. To illustrate this for our experiments, an ad hoc technique was selected where signatures are further trimmed by using a previously computed signature as input for a second round of calculations. The approach is illustrated on the eight-gene fibrate SPLR/1 and on the 29-gene statin SPLR/1 signatures presented in Table 3, above. Briefly, the genes of a “first-pass” signature are ranked by the value of their weights. A series of gene lists is created in which the first list consists of the highest- and lowest-weighted genes, the second list consists of the two highest- and the two lowest-weighted genes, and so on. The same algorithm was run using each gene list, and the same training set was used to derive the first-pass signatures. The number of test errors was determined on the corresponding test set.
Examination of the results (Table 4, panel A) suggests a simple procedure. The shortest signature producing no training errors identifies a three-gene fibrate signature producing two test errors. This is the same number of test errors as the starting eightgene signature. For the statin signature, the same selection algorithm identifies a seven-gene signature producing just three test errors, one less than the starting 29-gene signature. A three-gene fibrate or a seven-gene statin signature of equal test performance could not be produced in a single pass of the algorithm where different values of ρ are tested and all the genes are submitted to the algorithm (Table 4, panel B).
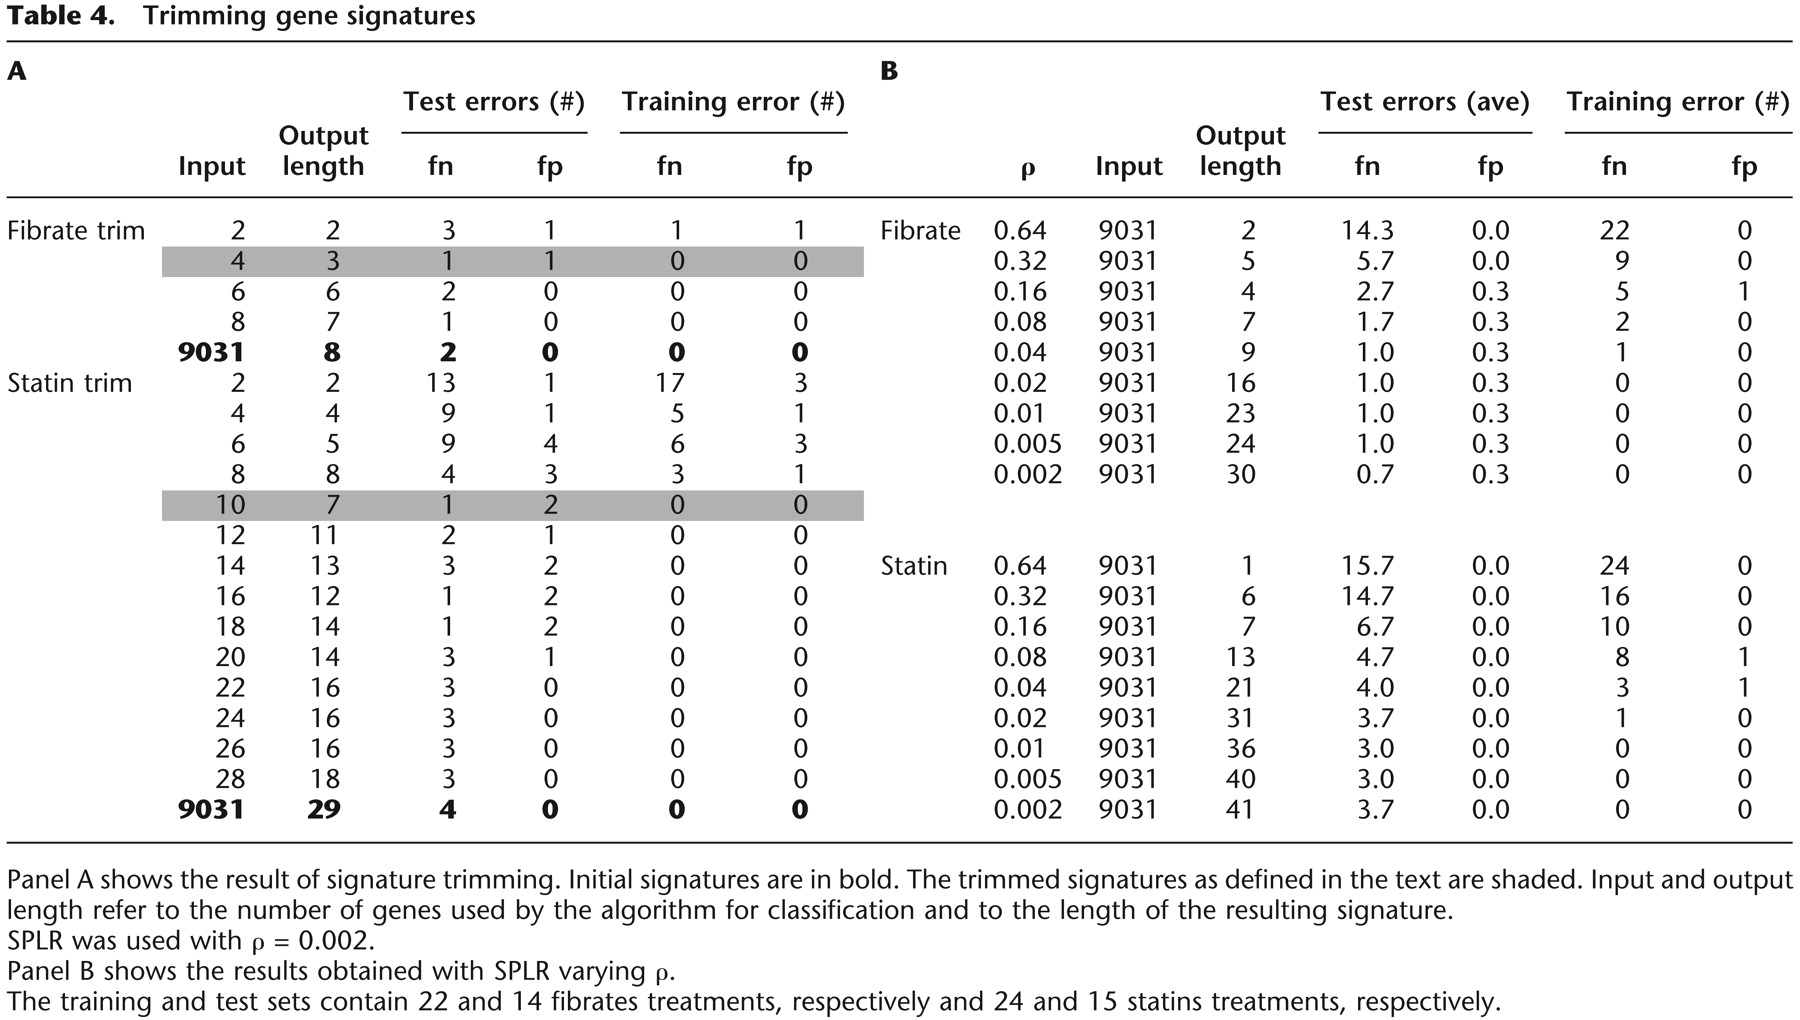
This “trimming” procedure is conceptually very simple, as it iteratively eliminates genes with small weights from a previously generated signature. The process stops when training errors are produced. The procedure is introduced here solely to illustrate the point that simple methods can be used in conjunction with the algorithms we present here in order to significantly shorten signatures. Other methods of feature selection (Xiong et al. 2001; Guyon et al. 2002) could be adapted for the same purpose. Interestingly, the two-gene fibrate signature, obtained when the two most weighted genes of signature SPLR/1 are used as input, produces just two training errors and four test errors (Table 4, panel A). We illustrate (Fig. S3) the resulting classifier together with the expression values of the 199 treatments in this two-dimensional space. The distribution of the four treatment classes and the shallow slope of the SPLR-derived two-gene classifier suggests that a decision tree-like rule such as (NM_017340 Up) AND NOT (AI454943 Up) would perform well. As NM_017340 (acyl-coA oxidase) is just one of many coregulated FABO genes, and AI454943 is coregulated with acetoacetyl-CoA synthase, we may express the previous rule as: (FABO genes Up-regulated) AND NOT (Cholesterol biosynthesis Up-regulated).
Alternate signatures
Throughout this analysis we sought to illustrate that certain types of linear classifiers can produce short interpretable signatures. Although it is clear that linearity is a desirable attribute from an interpretation point of view, one may argue that very short signatures may focus on a handful of possibly unannotated genes and thus preclude interpretation altogether.
To address some of these issues, SPLR was used iteratively to derive signatures for the same classification problem. Initially all genes were used to address the classification question. The genes appearing in this first round of signature generation were eliminated from the data set, and the signature was rederived. The procedure was continued until the cross-validated performance of the resulting signature dropped below some threshold.
Applying this procedure to the fibrate signature and using LOR = 4.0 as a threshold, 33 separate signatures were generated. The first two signatures are presented in Table 5 and were analyzed as previously described. Comparing the types of genes used in these two signatures is biologically informative because, by design, they have no genes in common. In both cases, FABO and peroxisomal genes are used as strong rewards for the fibrate class. Enoyl-CoA hydratase and acetyl-CoA acyltransferase 1 are used in fibrate_1st, and acyl-coA oxidase, acetyl-CoA dehydrogenase, and acetyl-CoA acyltransferase 2 are used in fibrate_2nd. As was the case in the fibrate SPLR/1 signature (Table 3), statin treatments on average tend to partially up-regulate some of the same genes. Thus the two signatures (Table 5) incorporate several genes acting as penalties for the statin class of treatments. The strongest statin penalty gene in fibrate_1st is AI454953 (an unannotated gene), as was the case in the fibrate SPLR/1 signature. Interestingly, the strongest statin penalty gene in fibrate_2nd is NF-E2-related factor 2. This gene was the strongest reward in the statin SPLR/1 signature (Table 3). Other genes such as those coding for guanine nucleotide binding protein 13, γ- and Ras-related protein P23 are also used as penalty for statin treatments. None of these genes are part of the cholesterol biosynthesis pathway. However, all are induced by statin treatments but not by fibrates.
Two fibrate signatures with no genes in common
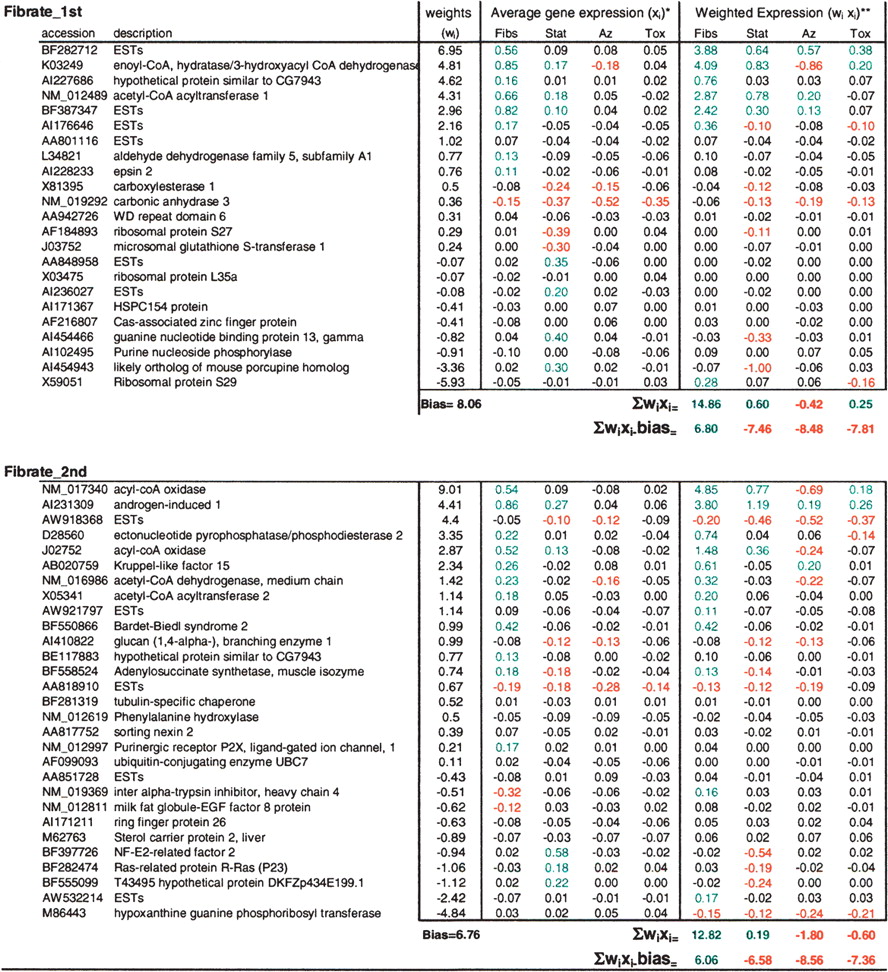
Together these results suggest that several nonoverlapping short linear classifiers can resolve the fibrate class of treatments with similar performance. These classifiers tend to use positively weighted FABO genes as rewards. Because statin treatments tend to partially induce some of the same FABO genes, several other genes are used as penalty in order to avoid scoring statin treatments as false positives. Cholesterol biosynthesis genes can act as statin penalty genes. Other genes, strongly induced by statins but not fibrates, can also perform that function (e.g., NF-E2-related factor 2, guanine nucleotide-binding protein 13, Ras-related protein, P23, and others).
Effect of individual treatments on the β-oxidation and cholesterol biosynthesis pathways
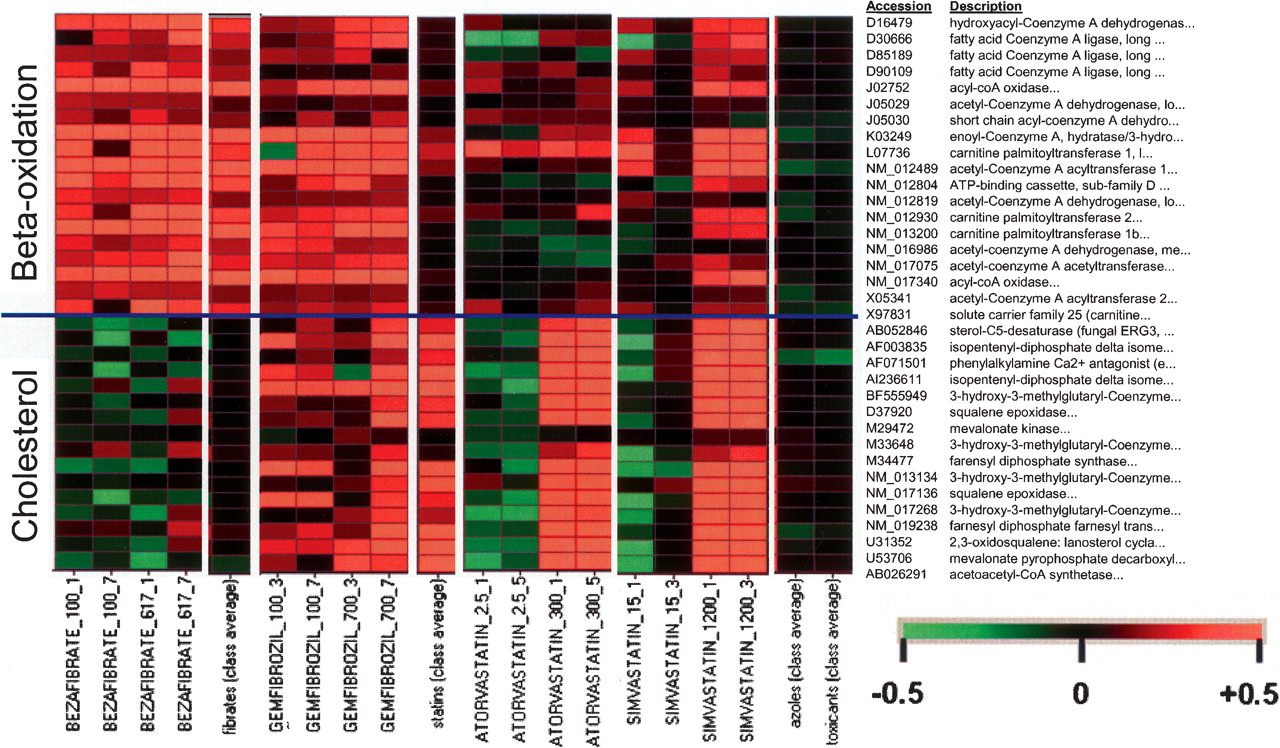
Having established that both the β-oxidation and the cholesterol biosynthetic pathway are important to resolve fibrates from statins, we now examine the effects individual members of these two classes of compounds have on those two pathways. Treatments with bezafibrate, gemfibrozil, atorvastatin, and simvastatin were chosen for this analysis because of their different misclassification rate during cross-validation. Bezafibrate and atorvastatin treatments are almost always correctly classified, whereas some gemfibrozil and simvastatin treatments are sometimes misclassified as statins and fibrates, respectively. Direct analysis of the gene expression changes (Fig. 5) induced by these four drugs on the fatty acid β-oxidation and cholesterol pathway genes confirmed that bezafibrate and atorvastatin behave like typical members of their class, whereas gemfibrozil and simvastatin share properties of both classes. Gemfibrozil treatments induce cholesterol biosynthesis much more than the average fibrate treatment. Simvastatin treatments tend to induce β-oxidation more than the average statin treatment.
Gene expression changes induced by bezafibrate, gemfibrozil, simvastatin, and atorvastatin on the β-oxidation and cholesterol biosynthesis pathways. The accession numbers and a short description of the genes present on the RU1 chip and belonging to the two pathways are shown on the left. Four treatments for each drug are shown. Treatments are labeled as drug name_dose_time. The gemfibrozil and simvastatin panels are placed between the columns corresponding to the fibrate and statin class averages, to highlight the fact that they share properties from both classes.
Discussion
We generated a very large microarray data set derived from treating rats with drugs, withdrawn drugs, failed drug candidates, toxicants, and various biochemicals.
We investigated the possibility of creating signatures capable of resolving samples treated with drugs belonging to a particular drug class. We seek to strike a balance between good predictive power, the ability to interpret the signature in biological terms, and the possibility of obtaining a gene list short enough to be useable in a robust diagnostic test device. A set of four classification questions (class-of-interest vs. the rest of the data set) was posed to a variety of classification algorithms. At the poor performing end of the spectrum was the t-rank algorithm, a simple intuitive algorithm that uses the genes most significantly different between the classes under consideration. Although the results from t-rank-based signatures are readily interpretable, they are mediocre classifiers of the groups and only successful on the groups with many, large, and distinct gene expression changes; few drug classes provide large and distinct gene expression changes. At the other end of the spectrum, Gaussian kernel SVMs and NN are powerful classifiers. These algorithms were the best classifiers for the heterogeneous toxicant class, the most difficult group to classify in the data set. However, when used to classify mechanistically more homogeneous classes (fibrates, statins, azoles), linear and nonlinear methods performed similarly.
The behavior of two linear classifier algorithms, SPLP and SPLR, was investigated further. The single parameter ρ, which determines the penalty associated with training errors, can be used to indirectly control the length of the signature. There is a range of ρ values for which the training error starts to increase but the test error remains constant and close to its absolute minimum. The length of the signature tends to decrease in that range of ρ values. Thus, a narrow range of ρ values can be identified that simultaneously minimize the test error, the overtraining gap, and the length of the signatures.
The fibrate and statin signatures were analyzed to reveal why SPLR signatures differ from t-rank signatures and why these differences result in better performance. T-rank-based fibrate signatures rely primarily on FABO genes to delineate fibrates from other classes. Several statin treatments up-regulate FABO genes, too, and thus are often misclassified as false positives by t-rank-based signatures. In contrast, SPLR signatures use both positively weighted genes (in this case, FABO genes) and negatively weighted genes (in this case, cholesterol biosynthesis genes) in order to reduce the error rate. Thus, SPLR signatures use gene expression information from both classes of compounds (i.e., class-of-interest and out-of-class compounds) to increase performance. We show for example how different fibrate signatures can be expressed as: (FABO genes Up-regulated) AND NOT (Cholesterol biosynthesis genes Up-regulated). The ability to make such simple statements as “fibrate drugs induce the FABO pathway, but unlike statins do not induce the cholesterol pathway” should prove useful from an interpretation point of view.
We show that the length of signatures can be further trimmed without loss of predictive power by simply using the genes of an initial signature computation as input for a second round of calculations. It is worth noting that even the space of very short signatures is not exhaustively searchable. There are ∼108 two-gene combinations and 1012 three-gene combinations in a space of ∼10,000 genes. Thus a two-step method as presented here that can create a 29-gene statin signature out of 9031 initial variables and then, in one simple step, further trim this signature to seven genes without loss of test performance ought to prove valuable as we move forward to create diagnostic tests for the mechanism and mode of toxicity of drug candidates. In the context of this study however, the main application of trimming signatures is to help focus on a small number of genes that are sufficient to classify the data.
Very short signatures may be less interpretable than longer ones when the algorithm focuses on a small number of poorly annotated genes. In those situations it is biologically informative to ask whether other signatures composed of different genes, belonging to the same or to different pathways, can classify the same data set with equivalent performance. We show that different FABO genes tend to be used as rewards for fibrate treatments in various fibrate signatures. However, although cholesterol biosynthesis genes can be used as penalty to avoid scoring statin treatments as false positives, genes from other pathways can also perform that role. This leads to a broadening of the understanding of what characterizes a fibrate treatment in the context of this data set.
We used the misclassification rate to identify typical and atypical fibrates and statins. We show that gemfibrozil, unlike other fibrates, partially up-regulates the cholesterol biosynthesis pathway. It is not known whether this induction occurs in response to decreased intracellular cholesterol, as is the case with statin treatments (Brown and Goldstein 1999). Unlike statins, gemfibrozil is not an HMG-CoA inhibitor. Therefore this induction of the cholesterol biosynthetic pathway may result in increased hepatic cholesterol synthesis in these rats. Simvastatin, relative to other statins, results in higher levels of induction of the β-oxidation pathway. This fibrate-like effect may point to additional beneficial effects of statins in general and simvastatin in particular.
In conclusion, we have shown that the performance of SPLP and SPLR, two types of linear classifiers, is comparable to that of nonlinear methods when used to classify mechanistically homogeneous classes of compounds. Analyses of the signature genes, their associated weights, as well as the comparison between multiple signatures for the same class of compounds can all be used to derive insights into the mode of action of the entire class and the idiosyncratic behavior of some of its members.
Methods
The full protocol for preparing of the database is described in (Ganter et al. 2005). Brief highlights of the protocol are included here to aid the reader. The gene expression data supporting this publication are available at NCBI's Gene Expression Omnibus (http://www.ncbi.nlm.nih.gov/geo/) under accession no. GSE2187. Additional information is also available at http://www.iconixpharm.com.
Animal details
The rats used for these studies were Sprague Dawley rats (age 6–7 wks and weighing 200–260 g), purchased from Charles River Laboratories. They were housed in plastic cages for 1 wk to acclimate to the laboratory environment of a ventilated room (temperature 22°C±3°C, humidity 30%–70%; light/dark cycle, 12 h/d, 6:00 a.m.–6:00 p.m.) before starting the experimental study.
Compound dosing
The two doses selected for studies were based on the maximum tolerated dose (MTD) and the fully effective dose (FED). The MTD dose was empirically determined using a preliminary range-finding study. The MTD was then selected as the dose at which the animals put on 50% less body weight than the untreated controls. Vehicle-dosed control animals generally put on 10%–15% body weight during this period. The FED is determined as the dose that is fully efficacious in an animal model of disease for which the compound is used in human therapy. When disease models are in species other than rat, accepted pharmacokinetic conversion are applied (Wallace-Hayes 2001). When no such model exists, the compound is administered at 1/10 the MTD dose. Each compound was administered daily to three individual male Sprague-Dawley rats using two doses (MTD and FED) for four treatment durations (0.25, 1, 3, 5, or occasionally 7 d).
Tissue harvest and handling
Five (5) tissues were collected from animals treated once with the test compound after either 0.25 or 1 d. The tissues collected were liver, kidney, heart, bone marrow, and one additional tissue. The latter was selected on the basis of literature reports on the compound's toxicology. Twelve (12) tissues were collected from the animals dosed daily for 3, 5, or 7 days; the tissues collected were liver, kidney, heart, bone marrow, spleen, brain, stomach-fore, stomach-glandular, intestine, muscle, lung, and gonads. Blood was collected and analyzed using a traditional clinical chemistry and hematology assay panel. All tissues were harvested using tissue punches in a way that produced samples of ∼100 mg in size and then were flash-frozen in liquid nitrogen and stored at –80°C until use.
Isolation and purification of mRNA using the MagNA Pure robot
This method is described in the Methods section of (Ganter et al. 2005). Briefly, poly A(+)-enriched RNA from tissue samples was isolated using the MagNA Pure LC robot (Roche) in combination with the MagNA Pure LC RNA Isolation kit II (Roche). Each isolated RNA sample was concentrated using a standard ethanol precipitation protocol in the presence of glycogen (50 μg/mL). After precipitation, the final purified RNA sample was resuspended in 7 μL DEPC-H2O and quantified using a Ribogreen high-range assay (Molecular Probes, Eugene, OR) on the Wallac Victor2 Fluorometer (Perkin-Elmer). The integrity of each RNA sample was determined using an Agilent 2100 BioAnalyzer (Agilent Technologies) in combination with an RNA 6000 Nano Lab Chip kit (Agilent Technologies). Degraded or poor-yielding samples were rejected and prepared again from a new tissue sample.
Hybridization
The methods used for cRNA preparation are described in the CodeLink manual v2.1 supplied by Amersham Biosciences (Dorris et al. 2002). The QIAGEN BioRobot 9604 was used. The resulting cRNA yield was quantified using a UV spectrophotometer at a wavelength of 260 nm. The integrity of the cRNA sample was determined using the Agilent 2100 BioAnalyzer.
Hybridization to microarrays
The methods used are essentially as described in the CodeLink manual v2.1 supplied by Amersham Biosciences, using the protocol described in (Dorris et al. 2002).
Microarray data collection
Processed slides were scanned using an Axon GenePix Scanner (Axon Instruments) with the laser set to 635 nm, the photomultiplier tube (PMT) voltage to 600, and the scan resolution to 10 microns. Slides were scanned using CodeLink Expression Scanning Software (Amersham Biosciences).
In order to assure that all of the data set was of high quality, a number of quality metrics and tests were employed (Ganter et al. 2005). Failure on any test resulted in rejection of the array and exclusion from the data set.
Data processing and normalization
Data collected from the scanner were processed using a nonlinear normalization procedure similar to the centralization approach reported by Zien et al. (2001) and adapted specifically for the CodeLink microarray platform. The procedure utilizes detrending algorithms to adjust for nonbiological trends and nonlinear patterns in signal response, leading to significant improvements in array data quality. The mean logratio is computed for each gene in each treatment as the difference of the averaged Log10 of the experimental signals from (usually) three drug-treated animals and the averaged Log10 of the control signals from (usually) 10 mock vehicle-treated animals. The variability of the logratio was computed as the standard deviation of the paired differences of the treated and control Log10 signal intensities.
Classification algorithms
The t-rank algorithm ranks all genes by the value
SPLP and SPLR have been described in detail elsewhere (El Ghaoui et al. 2003). They are based respectively on support vector machines (SVMs) and logistic regression (LR). These methods are linear classification algorithms in that they determine the optimal hyperplane separating a positive and a negative class. This hyperplane H can be characterized by a vectorial parameter w (the weight vector) and a scalar parameter b (the bias): H = {x | wTx + b = 0}. For all proposed algorithms, determining the optimal hyperplane eventually reduces to optimizing the error on the provided training data points, computed according to some loss function—the Hinge loss (loss function used in 1-norm SVMs) or the LR loss—augmented with a 1-norm regularization on the signature w. This regularization helps realize our goal of a sparse, short signature. Moreover, this 1-norm penalty on the signature is weighted by the average standard error per gene. Genes that have been measured with less certainty will be less likely to get a high weight in the signature. Thus, the proposed algorithms lead to sparse signatures and take the average standard error information into account. Mathematically, the algorithms can be described by the cost function that they actually minimize to determine the parameters w and b. This is as follows.
The kernel SVM implementation presented in Table 2 employed a Gaussian kernel. The Gaussian kernel defines the inner product between pairs of data points according to the following kernel function: k(x, y) = exp(–0.5∥x – y∥22/σ), where x and y are data points, σ is the width-parameter of the Gaussian kernel (Scholkopf and Smola 2002), and ∥ ∥2 is Euclidean 2-norm. The multilayered perceptron neural network (Fu 1994) was used in conjunction with the Prune algorithm, both of which are available through SPSS. Sensitivity analysis is used to rank genes in order of importance. Each gene is considered in turn. The sensitivity of a gene is calculated by varying the values of that gene for each case in the data set. After varying the values in a single case, the maximum difference in the outputs is calculated. This value is summed across all cases, and then normalized. All genes are ranked by this value. The C4.5 decision tree algorithm has been described elsewhere (Quinlan 1993).
Cross-validation
For cross-validation, the data set is randomly split. A training signature is derived from the training set composed of 60% of the samples and used to classify both the training set and the remaining 40% of the data, referred to here as the test set. In addition, a complete signature is derived using all the data. The performance of these signatures can be measured in terms of log odds ratio (LOR) or the error rate (ER) defined as LOR = ln(((TP+0.5)*(TN+0.5))/((FP+0.5)*(FN+0.5))) and ER = (FP+FN)/N where TP, TN, FP, FN, and N are true positives, true negatives, false positives, false negatives, and total number of samples to classify, respectively, summed across all the cross-validation trials. Sensitivity and specificity are defined respectively as: Sens = TP/(TP+FN) and Spec = TN/(TN+FP). The performance measures are used to characterize the complete signature, the average of the training, or the average of the test signatures. In this paper, training error or training performance refers to the complete signature that was trained using all the data. The cross-validated test error and test performance measures are unbiased estimates of performance of the signature if it were constructed based on a data set that is 60% of the full size. Hence, they are somewhat conservative estimates of the true future performance of the signature based on all data. However, they form a fairer basis for comparison of signature performance than the overly optimistic evaluations that result from reapplying the complete signature to its own training data.
Notes
[4] [Supplemental material is available online at www.genome.org.]
[5] Article and publication are at http://www.genome.org/cgi/doi/10.1101/gr.2807605.
[6] Corresponding author. E-mail [email protected]; fax (650) 567-5540.
We thank Mark Fielden, Kyle Kolaja, David O'Reilly, and Ken Zaret for critical reading of the manuscript, and the members of the Iconix array facility and informatics teams—B. Ganter, E. Ayanoglu, S. Baumhueter, L. Brady, J. Calvin, G.-J. Day, N. Brenckenridge, J. Ferng, S. Fujimoto, L. Gong, C. Hu, R. Idury, M. Judo, M. Lee, C. McSorley, R. Nair, P. Nguyen, S. Nicholson, H. Pham, A. Roter, S. Tan, S. Thode, A. Vladimirova, J. Yang, and Z. Zhou—for generating and processing array data.
References
- ↵Alberts, A.W., Chen, J., Kuron, G., Hunt, V., Huff, J., Hoffman, C., Rothrock, J., Lopez, M., Joshua, H., Harris, E., et al. 1980. Mevinolin: A highly potent competitive inhibitor of hydroxymethylglutaryl-coenzyme A reductase and a cholesterol-lowering agent. Proc. Natl. Acad. Sci. 77: 3957–3961.
- ↵Brown, M.S. and Goldstein, J.L. 1999. A proteolytic pathway that controls the cholesterol content of membranes, cells, and blood. Proc. Natl. Acad. Sci. 96: 11041–11048.
- ↵Cristianini, N. and Shawe-Taylor, J. 2000. An introduction to support vector machines. Cambridge University Press, Cambridge, UK.
- ↵Dorris, D.R., Ramakrishnan, R., Trakas, D., Dudzik, F., Belval, R., Zhao, C., Nguyen, A., Domanus, M., and Mazumder, A. 2002. A highly reproducible, linear, and automated sample preparation method for DNA microarrays. Genome Res. 12: 976–984.
- ↵Eisen, M.B., Spellman, P.T., Brown, P.O., and Botstein, D. 1998. Cluster analysis and display of genome-wide expression patterns. Proc. Natl. Acad. Sci. 95: 14863–14868.
- ↵El Ghaoui, L., Lanckriet, G.R.G., and Natsoulis, G. 2003. Robust classifiers with interval data. Report # UCB/CSD-03-1279. Computer Science Division (EECS), University of California, Berkeley, CA.
- ↵Fu, L.M. 1994. Neural networks in computer intelligence. McGraw Hill, New York.
- ↵Ganter, B., Tugendreich, S., Pearson, C., Ayanoglu, E., Baumhueter, S., Bostian, K., Brady, L., Breckenridge, N., Browne, L., Calvin, J., et al. 2005. Development of a large-scale chemogenomics database to improve drug candidate selection and to understand mechanisms of chemical toxicity and action. J. Biotechnol. (in press).
- ↵Golub, T.R., Slonim, D.K., Tamayo, P., Huard, C., Gaasenbeek, M., Mesirov, J.P., Coller, H., Loh, M.L., Downing, J.R., Caligiuri, M.A., et al. 1999. Molecular classification of cancer: Class discovery and class prediction by gene expression monitoring. Science 286: 531–537.
- ↵Gunther, E.C., Stone, D.J., Gerwien, R.W., Bento, P., and Heyes, M.P. 2003. Prediction of clinical drug efficacy by classification of drug-induced genomic expression profiles in vitro. Proc. Natl. Acad. Sci. 100: 9608–9613.
- ↵Guyon, I., Weston, J., Barnhill, S., and Vapnik, V. 2002. Gene selection for cancer classification using support vector machines. Machine Learning 46: 389–422.
- ↵Hardman, J.G., Limbird, L.E., and Gilman, A.G. 2001. Goodman & Gilman's The pharmacological basis of therapeutics. McGraw Hill, New York.
- ↵Hastie, T., Tibshirani, R., and Friedman, J. 2001. Elements of statistical learning: Data mining, inference and prediction. Springer-Verlag, Berlin, Germany.
- ↵Horton, J.D. and Shimomura, I. 1999. Sterol regulatory element-binding proteins: Activators of cholesterol and fatty acid biosynthesis. Curr. Opin. Lipidol. 10: 143–150.
- ↵Kersten, S., Desvergne, B., and Wahli, W. 2000. Roles of PPARs in health and disease. Nature 405: 421–424.
- ↵Klassen, C.D. 2001. Casarett and Doull's Toxicology: The basic sciences of poisons. McGraw-Hill, New York.
- ↵Lee, S.S., Pineau, T., Drago, J., Lee, E.J., Owens, J.W., Kroetz, D.L., Fernandez-Salguero, P.M., Westphal, H., and Gonzalez, F.J. 1995. Targeted disruption of the α isoform of the peroxisome proliferator-activated receptor gene in mice results in abolishment of the pleiotropic effects of peroxisome proliferators. Mol. Cell Biol. 15: 3012–3022.
- ↵Quinlan, J.R. 1993. C4.5: Programs for machine learning. Morgan Kaufman, San Francisco.
- ↵Ramaswamy, S., Tamayo, P., Rifkin, R., Mukherjee, S., Yeang, C.H., Angelo, M., Ladd, C., Reich, M., Latulippe, E., Mesirov, J.P., et al. 2001. Multiclass cancer diagnosis using tumor gene expression signatures. Proc. Natl. Acad. Sci. 98: 15149–15154.
- ↵Scholkopf, B. and Smola, A. 2002. Learning with kernels. MIT Press, Cambridge, MA.
- ↵Schoonjans, K., Staels, B., and Auwerx, J. 1996. Role of the peroxisome proliferator-activated receptor (PPAR) in mediating the effects of fibrates and fatty acids on gene expression. J. Lipid Res. 37: 907–925.
- ↵Thomas, R.S., Rank, D.R., Penn, S.G., Zastrow, G.M., Hayes, K.R., Pande, K., Glover, E., Silander, T., Craven, M.W., Reddy, J.K., et al. 2001. Identification of toxicologically predictive gene sets using cDNA microarrays. Mol. Pharmacol. 60: 1189–1194.
- ↵van den Bossche, H., Willemsens, G., Cools, W., Lauwers, W.F., Le Jeune, L., Venkatakrishnan, K., von Moltke, L.L., and Greenblatt, D.J. 1978. Biochemical effects of miconazole on fungi. II. Inhibition of ergosterol biosynthesis in Candida albicans. Effects of the antifungal agents on oxidative drug metabolism: Clinical relevance. Chem. Biol. Interact. 21: 59–78.
- ↵Venkatakrishnan, K., von Moltke, L.L., and Greenblatt, D.J. 2000. Effects of the antifungal agents on oxidative drug metabolism: Clinical relevance. Clin. Pharmacokinet. 38: 111–180.
- ↵Vu-Dac, N., Chopin-Delannoy, S., Gervois, P., Bonnelye, E., Martin, G., Fruchart, J.C., Laudet, V., and Staels, B. 1998. The nuclear receptors peroxisome proliferator-activated receptor α and Rev-erb α mediate the species-specific regulation of apolipoprotein A-I expression by fibrates. J. Biol. Chem. 273: 25713–25720.
- ↵Wallace-Hayes, A. 2001. Principles and methods of toxicology, Chapter 8. Taylor & Francis, New York.
- ↵Waring, J.F., Ciurlionis, R., Jolly, R.A., Heindel, M., and Ulrich, R.G. 2001. Microarray analysis of hepatotoxins in vitro reveals a correlation between gene expression profiles and mechanisms of toxicity. Toxicol. Lett. 120: 359–368.
- ↵Xiong, M., Fang, X., and Zhao, J. 2001. Biomarker identification by feature wrappers. Genome Res. 11: 1878–1887.
- ↵Zien, A., Aigner, T., Zimmer, R., and Lengauer, T. 2001. Centralization: A new method for the normalization of gene expression data. Bioinformatics (Suppl.) 1: S323–S331.
Web site references
- http://www.iconixpharm.com; Iconix Pharmaceuticals' company Web site.
- http://www.ncbi.nlm.nih.gov/geo/; Gene Expression Omnibus database, hosted by NCBI.
- http://www.spotfire.com; Spotfire company Web site, a provider of statistical tools for scientific applications.