
Abstract
Research with budding yeast (Saccharomyces cerevisiae) has been transformed by the publication, nearly a decade ago, of the entire genome DNA sequence. The introduction of this first eukaryotic genomic sequence changed the yeast research environment significantly, not just because of dramatic progress in technical means but also because the sequence made accessible a new class of scientific questions. A central goal of yeast research remains the determination of the biological role of every sequence feature in the yeast genome. The most remarkable change has been the shift in perspective from focus on individual genes and functionalities to a more global view of how the cellular networks and systems interact and function together to produce the highly evolved organism we see today.
The first complete nucleotide sequence of a eukaryotic genome, that of budding yeast (Saccharomyces cerevisiae), was published in 1996 (Goffeau et al. 1996). It was the result of a broad international effort, stimulated by a consensus reached in the United States, nearly a decade earlier, that there should be an extraordinary 15-year effort to sequence the human genome, supported by funding of the order of $3 billion. A particularly significant feature of the National Academy of Sciences report (Alberts et al. 1988) that announced this consensus was the recommendation that the genomic sequences of a few other eukaryotes should be determined first. The eukaryotic genomes chosen were those of the leading “model organisms,” because their genomes are significantly smaller than that of the human, and because substantial and successful molecular genetics research communities had already been developed to study them. Largely because of the efforts of these communities, it was already known that many of the proteins carrying out basic cellular functions are highly conserved among all the eukaryotes, suggesting that knowing the sequences of both the model genomes and the human genome would be an important path to understanding them both. Explicitly named were yeast (Saccharomyces cerevisiae), a nematode worm (Caenorhabditis elegans), and a fruitfly (Drosophila melanogaster). The yeast genome, containing ∼12 million bp, is only 0.4% the length of the 3-billion-bp human genome, and the worm and fly genomes are ∼3.3% and 5.5% the length of the human genome, respectively (numbers from Saccharomyces Genome Database [SGD; http://www.yeastgenome.org], UCSC Gold Path [http://genome.brc.mcw.edu/goldenPath/stats.html], GSC at Washington University [http://www.genome.wustl.edu/projects/celegans/], and FlyBase [http://www.flybase.org/annot/release.html#releases], respectively).
Thus, the yeast genome became the pioneer eukaryotic genome, and the yeast research community was the first to profit from knowledge of the complete genome sequence. A dramatic transformation of yeast research ensued that presaged similar transformations of research in the other model organisms, the mouse and the human, as each of these genome sequences became available. The transformation began with technical improvements that greatly accelerated research, especially any research involving identification of pieces of DNA cloned, for example, after a biological selection from clone libraries. Whereas before the sequence, yeast researchers identified clones by mainly genetic and/or physical mapping methods, now a single sequence run sufficed. Technologies unimaginable before (e.g., DNA microarrays containing each and every yeast gene) became commonplace. The same European-led consortium that initiated the sequencing effort undertook to produce the deletion of every yeast open reading frame (ORF) (Winzeler et al. 1999; Giaever et al. 2002), and development of a whole class of genome-scale genetic methods began, a development that is still far from complete.
Today we are seeing the beginning of an even more profound transformation of yeast research, one that is more than technical. The availability of the entire genome sequence has made possible the asking of new kinds of research questions, questions that can be answered only when one has truly comprehensive information about an organism. For example, once the entire genome sequence became known, it became possible, for the first time, to study expression of all the genes at once, where before one could study genes only a few at a time. The very idea of what constitutes “specificity,” has been changed by the ability to study expression of all the genes without exception. It is now routine to enumerate, in a single experiment, all the genes in an organism that respond to a specific stimulus or stress.
Comparative analyses of the complete genome sequences of the yeast, worm, fly, mouse, and human genomes forcefully validated the expectation of extreme conservation of sequence and function over evolutionary time (see Chervitz et al. 1998; Rubin et al. 2000; Lander et al. 2001; Venter et al. 2001). There has been, as a result, a “grand unification” in molecular biology, as it became clear that, at least for proteins, sequence similarity more often than not leads to an unambiguous assessment of functional similarity. Thus, through comparative genomics much, if not quite all, of the experimental work elucidating gene or protein function done in one organism illuminates them all, and transfer of annotation from the organism where the experimental data were collected to other organisms has become routine. Since yeast is still, for many basic cellular functions, the most tractable experimental system, much of the annotation of basic cellular functions in all eukaryotes, including especially the human, can be traced back to experiments done in yeast. As described below, the genome databases, especially Gene Ontology (GO), are continuing to facilitate the transfer of annotation so that a newly discovered gene function in yeast soon appears as an annotation for the orthologs in the other eukaryotes.
From the parts list to the system level: Goals of post-genome-sequence yeast research
The most obvious goal of genomic science arose directly from knowing complete genomic sequences: to decipher, annotate, and understand the role of each and every feature of the DNA sequence in the life of the organism. Put another way, we want to understand the reasons that each genomic DNA sequence feature was selected over evolutionary time.
The knowledge of the entire genomic sequences of organisms has motivated a new kind of biological analysis that looks beyond individual genes to the ensemble of all the genes. A second, more ambitious goal of genomic science has thereby emerged: to understand not only what every gene and gene product does for the organism but also how all of these genes, gene products, and functions and their regulation interact together to produce the properties of the organism. The ultimate aim of this new “system-level” biological research (Hartwell et al. 1999; Ideker et al. 2001a), not really practical before genomic sequences, is to account for and to model, in a fully quantitative way, not just how each of the genes participates in the biology of the organism but also how their interactions are controlled to maintain homeostasis over the entire life cycle and environmental range experienced by the organism.
Saccharomyces cerevisiae, by dint of its small genome and its experimental tractability, has become the pioneer in a new era of biology, where all the individual “parts” of the organism (conveniently encoded in the genome) are specified, and where research is aimed at understanding fully and quantitatively how the ensemble of the parts, subassemblies, and regulatory networks work together to produce the robust living organisms we see.
Genes and their biological roles
In 1995, the total number of yeast genes about whose function something was understood was of the order of two thousand (Hughes et al. 2004); virtually all that was known about these genes derived directly from experiments by inference from mutant phenotypes or direct biochemical assays. The information about these genes began to be collected into the SGD (www.yeastgenome.org) (Balakrishnan et al. 2005) at about this time; as the genomic sequence became available, other databases also came into existence (see Table 1; Mewes et al. 1997; Costanzo et al. 2000; Guldener et al. 2005). SGD remains the primary source for updates to the genome sequence, primary annotation, gene names, and nomenclature, as well as the basic functional information about each gene, which is continually culled from the experimental literature. In what follows we refer the reader to SGD for details about individual genes and global statistics about genes.
Some sources of functional genomics data collections for S. cerevisiae
[i] List of the major sources of yeast functional genomics data; in addition to the main SGD site, yeast genome data are also distributed via SGD Lite (http://sgdlite.princeton.edu), a lightweight yeast genome database, which is built from GMOD components and can be downloaded and installed locally.
Currently, the best estimate for the number of yeast ORFs that actually encode proteins is 5773, of which 1474 (25%) are listed by SGD as “uncharacterized.” This means that something biological is known about 4299 yeast genes, approximately a twofold increase since the genome sequence became available. However, for many genes the biological information available is still very limited, and quite a bit of the new information about biological function derives from sequence comparisons; a gene never studied in yeast but apparently orthologous to a well-characterized gene in another organism acquires functional annotation by inference.
Development of diverse genome-scale experimental technologies raised considerable expectations of an acceleration in the discovery rate for the functional roles of individual poorly characterized genes. Surprisingly, this promise still remains largely unfulfilled. Although each of the technologies (i.e., two-hybrid analyses, synthetic lethality methods, and gene coexpression using DNA microarrays) has had many significant successes, most of the new functional annotations of genes continue to derive from research papers describing experiments focused on just a few genes at a time. A major symptom of the problem has been the startlingly limited overlap in the predictions of different genome-scale methods. The reader is referred to an excellent recent summary of these issues (Hughes et al. 2004). Thus the most elementary goal of post-genome research, to annotate the biological role of every gene, remains a challenge.
Gene expression technology and the emergence of system-level biology
In the mid to late 1990s, technology that allowed one for the first time to simultaneously assess gene expressions for the entire genome was developed. DNA microarrays, on which each ORF or other sequence feature is represented (DeRisi et al. 1997; Brown and Botstein 1999), has been the dominant approach used in yeast research; at the same time, Serial Analysis of Gene Expression (SAGE), an alternative sequence-based method, was also developed (Velculescu et al. 1997). Although gene expression technology has yet to make a big impact on the rate of biological annotation of yeast genes, it has nevertheless transformed yeast research, by studying gene expression associated with relatively simple biological experiments in a fully comprehensive way. This comprehensiveness has stimulated both experimental and theoretical approaches to understanding regulatory networks and other features of yeast biology at the system level (Hartwell et al. 1999; Ideker et al. 2001a). Rather than attempt a review of all this research (SGD lists, at the time of writing, 299 published genome-scale expression studies), we will limit ourselves to a few paradigm examples, often from our own experience.
Defining functional or regulatory subsystems, or “modules”
The gene expression technology provided a direct and simple way to enumerate genes whose expression respond to individual stimuli or stresses. Early examples follow: Gasch and colleagues (2000, 2001) studied all the genes responding to a number of diverse stresses, and they defined a generic “environmental stress response” that underlies all stress responses, including temperature change, starvation, oxidative stress, and radiation; Roberts and colleagues (2000) studied all the genes that respond to α-factor; and Ideker et al. (2001b) studied nutritional perturbations to cells growing on galactose. Similarly, genes with characteristic expression changes during sporulation (Chu et al. 1998) or the cell division cycle (Cho et al. 1998; Spellman et al. 1998) were systematically determined. Such studies have associated genes with each other and with particular biological activities, although further work has been required to provide detailed understanding.
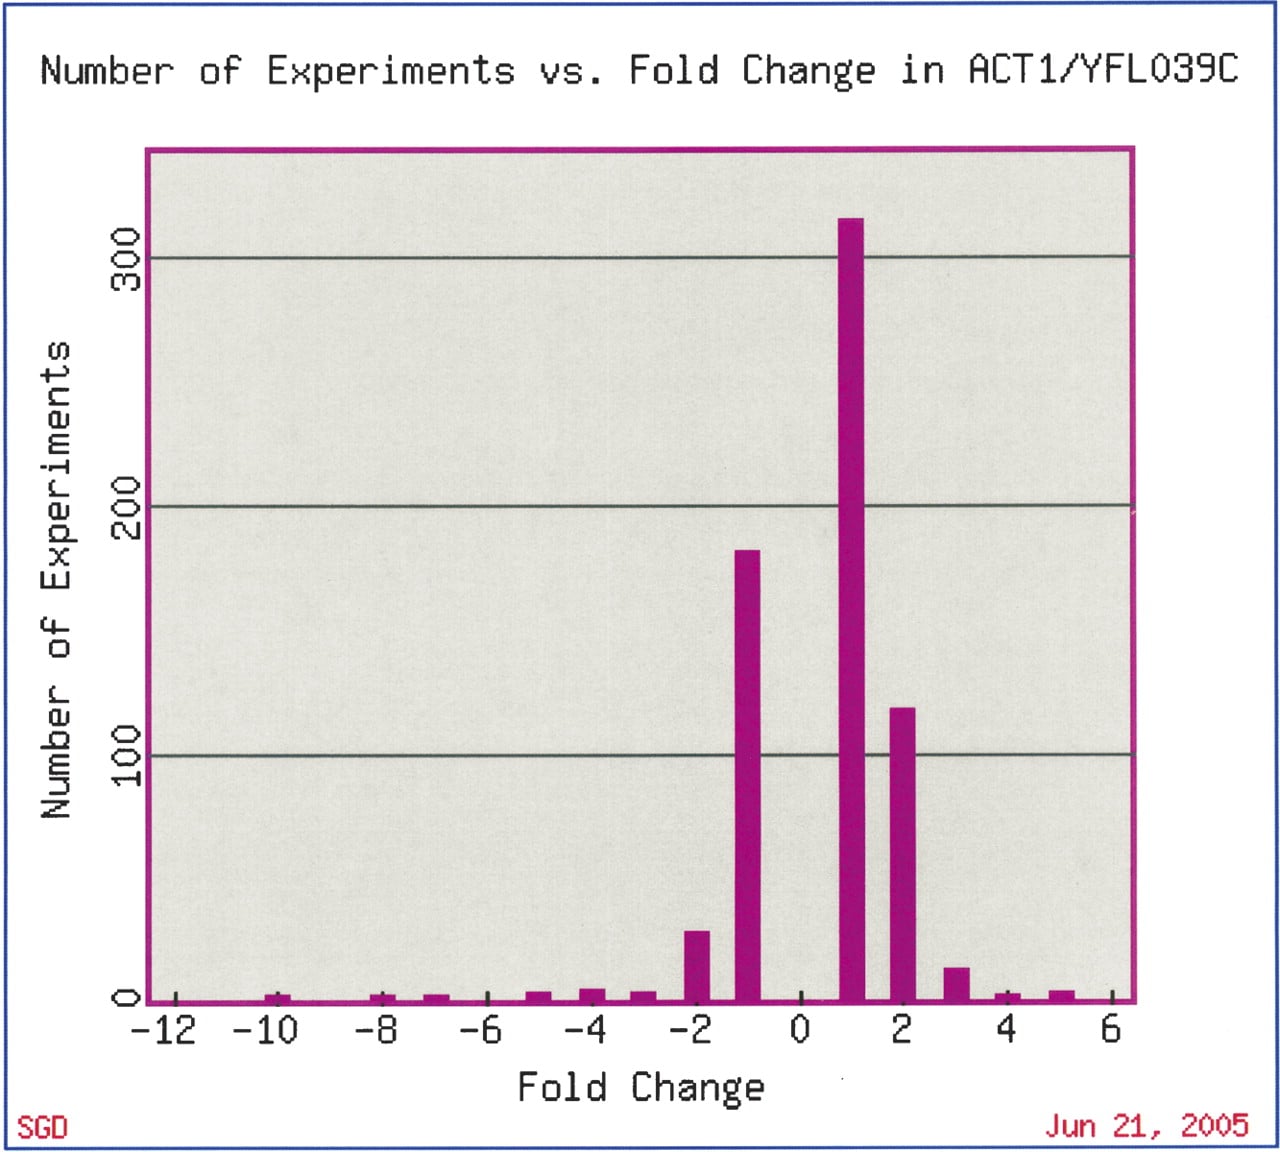
However, studies of this kind have provided important new clues to which sets of genes might act together, in concert or in sequence, in a common biological process. For instance, the ribosomal genes comprise one of the most tightly coregulated groups of functionally related genes. In experiments that examine processes as diverse as sporulation (Chu et al. 1998) to response to arsenic (Haugen et al. 2004), the ribosomal genes (both mitochondrial and nuclear) are often the most significantly coregulated genes in the data set. Genome-wide expression technology has confirmed existing and discovered novel components of other major transcriptional networks in yeast, including clusters of genes involved in amino acid metabolism, energy pathways, DNA replication, and the stress response (Eisen et al. 1998; Chua et al. 2004), all of which are, as are the ribosomal proteins, frequently the most significant groups of coregulated genes in a data set. We have also learned that it is quite rare for genes to have unchanging expression levels across different experiments; for example, expression of the yeast actin (ACT1) gene, which was traditionally used as a control in Northern blots to ensure that equivalent levels of RNA were loaded in each well, changes significantly in several diverse types of microarray experiments (Fig. 1).
In many cases, later studies have not only confirmed the functional associations among genes based on coexpression but also found the regulators that are responsible; the study by Zhu and colleagues (2000) is one example. These studies not only have resulted in further experimental work, but also, as we summarize below, have stimulated many successful theoretical and analytical efforts in defining and understanding regulatory network behavior in yeast, making yeast once again the leading organism in an emerging field of biology.
Analysis and display of genome-scale data
The comprehensiveness of these methods led to a new problem: How can such a vast amount of data be analyzed, managed, and presented? Biologists were no longer able to examine these results individually; each of the aforementioned studies was comprised of hundreds of thousands of individual gene expression measurements. A key development in the field was applying clustering algorithms and data visualization tools to allow for analysis and presentation of the large volume of microarray results. An early approach, which is still probably one of the most popular, is the application of hierarchical clustering to group similarly expressed genes together, representing their relative expression levels graphically with colored boxes (Fig. 2A; Weinstein et al. 1997; Eisen et al. 1998; Wen et al. 1998). Several other methods of analyzing gene expression have since been applied, including self organizing maps (SOM) (Tamayo et al. 1999), simulated annealing clustering (Lukashin and Fuchs 2001), graph-theoretic approaches (Sharan and Shamir 2000), biclustering (Cheng and Church 2000; Tanay et al. 2002; Kluger et al. 2003), and other sophisticated approaches (see Ihmels et al. 2002).
Fold change of ACT1 gene expression in microarray experiments available at SGD. This figure was generated by the SGD Expression Connection tool at http://db.yeastgenome.org/cgi-bin/expression/expressionConnection.pl. The outlying values (–10, +fivefold) are experiments from the Mnaimneh et al. (2004) data set that profiled expression in strains with essential genes under control of titratable promoters. Other conditions that led to at least fourfold change in ACT1 expression include expression during sporulation (less than fourfold) (Chu et al. 1998) and prolonged stationary phase (–4.3 fold) (Gasch et al. 2000).
Gene ontology
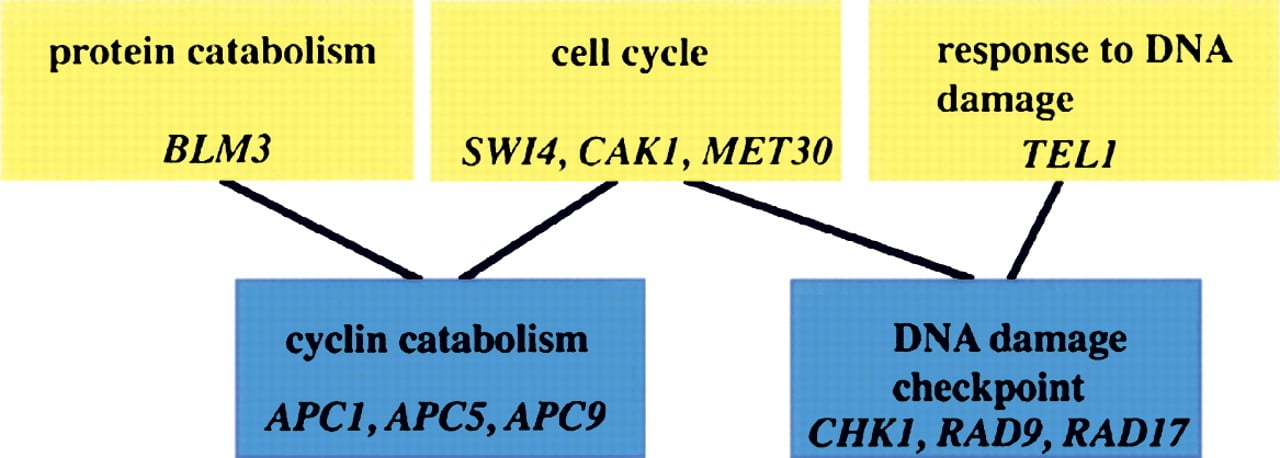
As genome-scale data accumulated, it quickly became clear that interpretation would depend critically on high-quality functional annotation. Without reliable underlying annotation, even the best clustering algorithm will not allow one to make sense of the data. Not only was some description needed for as many genes as possible, but that description needed to be written by using a controlled vocabulary, so that it was easy to search and find, for example, all transcription factors known in the genome. For this task, the GO was developed. GO is a structured, controlled vocabulary that describes the biological processes, functions, and locations of gene products (Ashburner et al. 2000). The GO is structured such that broad, general terms are parents of more specific terms, child terms can have more than one parent term, and these parent-child relationships are captured in the ontology (Fig. 3).
The initial goal of GO was to improve queries of orthologous genes across different organism databases without having to deal with nomenclature differences. For example, with GO, one would not need to know that “CDC25” is the yeast homolog of “son of sevenless” to link from the yeast CDC25 entry in SGD to the son of sevenless entry in FlyBase; instead one could bridge the databases by using the GO-controlled vocabulary term “Ras guanyl-nucelotide exchange factor.” Soon after its inception, GO was also applied to provide succinct descriptions of genes in expression clusters, facilitating visualization of the biological importance of the data during analysis by, for instance, the Eisen TreeView program (Eisen et al. 1998; Saldanha 2004).
Computing and validating inferences from experiments
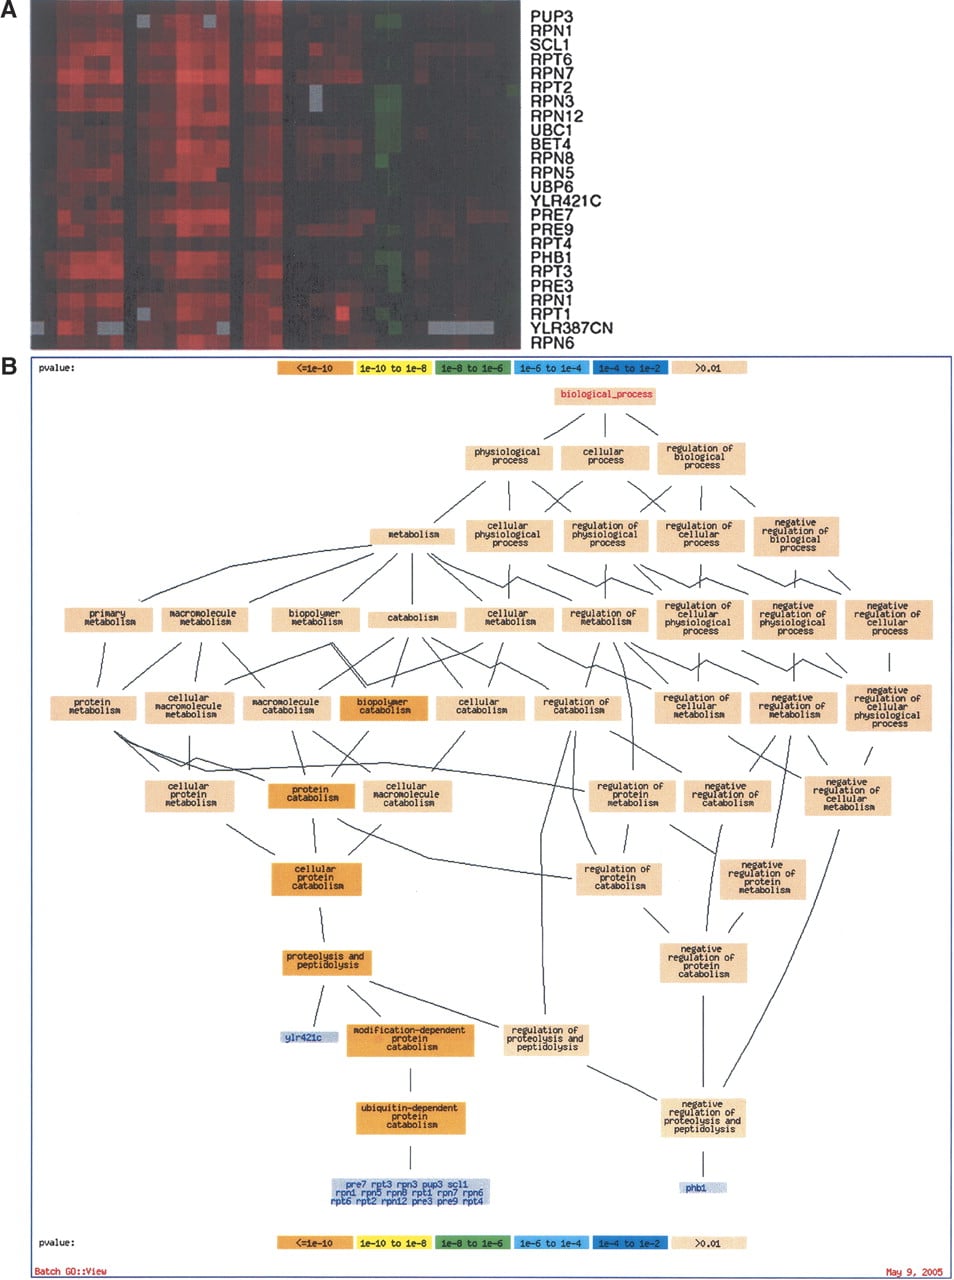
The real power of GO emerged when computational biologists began to use it to validate inferences made from analysis of expression data. GO Term Finder is an early tool that facilitates automated analysis of the biological roles of groups of genes. It searches for significant shared GO terms used to describe any group of genes, such as genes that are coexpressed in a microarray experiment (Boyle et al. 2004). For example, a tight cluster of coexpressed genes from the aforementioned study of stress responses (Gasch et al. 2000) is shown in Figure 2A. When these genes are analyzed by using the GO Term Finder, it is clear that this cluster consists of genes involved in proteolysis (Fig. 2B). There are several other tools that similarly utilize GO for analyzing groups of genes (see the GO home page at http://www.geneontology.org). With these tools in hand, yeast researchers began to make several new biological insights.
(A) Display of a group of genes that exhibit similar expression during the DNA damage response as described in Gasch et al. (2001). Red indicates increased expression, while green indicates decreased expression levels. Each gene's expression is represented by a single row of colored boxes, while each sample is represented by a single column. (B) GO Term Finder results with the cluster from A as input; the most significant enriched GO Term is “proteolysis and peptidolysis,” with a P-value of 1.26–28.
Insights into the global transcriptional network
These advances stimulated the use of DNA microarray technology to address questions of global gene regulation, using what has turned out to be a powerful combination of computation and experiment (for a recent review, see Chua et al. 2004). Computational methods were developed that go well beyond clustering coregulated genes to identify short DNA sequences that might be cis-acting regulatory elements shared among the coregulated genes and the transcription factors that may bind them; an early example is that of Bussemaker et al. (2001). In later studies, probabilistic methods were used to identify regulatory “modules” by using combinations of upstream regulatory sequence and expression data (Wang et al. 2002, 2005; Segal et al. 2003).
The Gene Ontology: a structured, controlled vocabulary to describe gene products. The diagram above is a small part of the biological process ontology. Parent terms are yellow boxes, child terms are blue boxes, and a sampling of genes associated with each GO term are in italics. Note that child terms can have multiple parents, allowing for more accurate representation of complex relationships among different biological processes.
Comparative genomics have also been used successfully to examine transcriptional networks. In two independent comparative genomics studies, conserved regulatory elements were identified by aligning the intergenic regions of closely related Saccharomyces species and then searching within them for conserved sequence motifs (Cliften et al. 2003; Kellis et al. 2003). Pritsker et al. (2004) identified putative transcription factor binding motifs by using Gibbs sampling to search for significant regulatory elements within promoters of orthologous genes from 13 hemiascomycetous yeasts.
Transcription factor binding sites are now also being globally identified via experimental means by using a combination of chromatin-immunoprecipitation (chIP) and microarray technology. In these experiments, DNA bound to a given transcription factor is isolated by chIP of the epitope-tagged transcription factor; these DNA fragments are then hybridized to a microarray of intergenic regions (chip). These chIP-chip experiments have now identified binding sites for many transcription factors involved in a variety of biological processes (see Khodursky et al. 2000; Iyer et al. 2001; Lieb et al. 2001; Raghuraman et al. 2001; Kurdistani et al. 2002; Lee et al. 2002; Ng et al. 2003).
With traditional microarrays, chIP-chip experiments, and genomic sequence available, several methods have been developed to elucidate transcriptional networks by integrating these different data sources. Lee et al. (2002), Bar Joseph et al. (2003), and Gao et al. (2004) are all prominent examples where chIP-chip and expression data were combined to generate regulatory modules. In the most comprehensive study to date, Harbison and colleagues (2004) used a combination of experimental (chIP-chip), comparative genomics, and motif discovery methods to identify putative DNA binding sites for >200 transcription factors in yeast.
Most impressively, Beer and Tavazoie (2004) recently applied a probabilistic framework to predict gene expression based on sequence information. In their elegant approach, a Bayesian network takes as input different properties of sequence elements upstream of a gene and outputs the likelihood of that gene exhibiting a particular expression pattern. Their combinatorial rules correctly predicted patterns of gene expression for 73% of the yeast genes studied (1898 of 2587 genes in five test sets), with 27% predicted to be in an expression pattern different than their actual expression pattern; the P-value for the prediction of 73% is <10–127. They were then able to use their method to predict regulatory elements in the worm.
Interaction networks
With the completed genome also came the opportunity to generate comprehensive genetic and physical interaction maps. Synthetic Genetic Array (SGA) analysis (Tong et al. 2001) uses the comprehensive ORF-deletion collection (Winzeler et al. 1999; Giaever et al. 2002) and a clever genetic selection as the basis for systematically generating double mutants. Assessment of the growth properties of the double mutants generates large-scale genetic interaction maps based on the concept of “synthetic lethality.” Synthetic lethality, described first in Drosophila by Dobzhansky (1946) and Sturtevant (1956) and in yeast by Novick et al. (1989), occurs when the combination of two mutations causes lethality, while neither mutation by itself is lethal. The SGA technique has provided a means to perform genetic interaction analysis on a large scale, yielding a genetic interaction network containing ∼1000 genes and ∼4000 interactions (Tong et al. 2004; see also Pan et al. 2004). Large-scale protein-protein interaction networks have also been generated by using the two-hybrid system and mass spectrometry (Ito et al. 2000, 2001; Uetz et al. 2000; Gavin et al. 2002; Ho et al. 2002; Hazbun et al. 2003).
These results have generated increasing theoretical efforts aimed at characterizing regulatory and functional interaction networks. For example, Yeger-Lotem and colleagues (2004) adapted and extended methods that Shen-Orr et al. (2002) applied in Escherichia coli to discover significant network motifs in a combined network of regulatory and physical interactions. Shen-Orr et al. (2002) examined interactions between E. coli transcription factors and the operons that they regulate to discover “network motifs,” or patterns of connections among genes in the network that occur significantly more frequently than in randomized networks. Yeger-Lotem and colleagues (2004) extended this concept to analyze a network that is comprised of both transcription factor-target interactions and protein-protein physical interactions. They found a few two- and three-protein motifs (e.g., two transcription factors interacting to regulate a third gene) and many (63) four-protein motifs, which in almost all cases were combinations of the smaller motifs. These results suggest that smaller motifs serve as building blocks to construct the larger cellular network.
While already having generated much useful biological data, the large-scale methods for profiling genetic and physical interactions for the entire genome (i.e., all 6000 genes by all 6000 genes) are still labor intensive and, as with all high-throughput methods, generate both false-positive and false-negative results. Also, as noted above, there is distressingly poor concordance among results of the several large-scale studies (Hughes et al. 2004). In the studies where authors systematically compared their high-throughput results with those from individual experiments, the amount of overlap between the two is surprisingly low (Ito et al. 2001; Ho et al. 2002). This type of bench marking, while extremely useful, has been rare thus far because of the lack of a comprehensive collection of individual experimental results culled from the literature. Computational methods that integrate multiple types of experimental evidence to verify results, associate interactions with probability scores, and predict novel interactions or gene functions based on these combined interactions can address some of the limitations inherent with these high-throughput methods. Triosh and Barkai (2005) described a method to verify protein-protein interactions by examining whether orthologs of the interaction partners are coexpressed. Similarly, Yu et al. (2004) assessed whether protein-protein or DNA-protein interactions can be confidently transferred from one organism to another by examining “joint” sequence conservation of the interacting proteins. In another approach, Bayesian frameworks have been applied to integrate different types of functional genomics data (e.g., genetic and physical interactions and correlated expression) to generate the probability of a functional link for all possible gene pairs (Jansen et al. 2003; Troyanskaya et al. 2003; Lee et al. 2004). These pair-wise correlations can then be used to cluster functionally related genes together and thus can predict functions for previously uncharacterized genes. A different computational approach uses probabilistic decision trees to integrate different types of data in order to predict phenotypes (King et al. 2003) or synthetic lethal interactions (Wong et al. 2004), also meant to lead to functional predictions for uncharacterized genes. For all of these methods, the number of confirmed successful predictions for as-yet-uncharacterized genes is still too small to constitute a robust test of their efficacy.
Public resources for yeast genomics
We are confident that the genome-scale experimentation and the integrative analytical approaches sketched above will provide increasing insights into the biology of yeast and, as we have indicated, other eukaryotes. However, if the data are not publicly available in forms that are machine parsable, these studies will not reach their full potential in terms of generating useful biological knowledge. Toward that end, standards for several types of functional genomics data have been created. The Open Biological Ontologies (OBO; http://obo.sourceforge.net/) site is a Web page that provides links to various standards and controlled vocabulary projects, including the Microarray Gene Expression Data (MGED) Society (Spellman et al. 2002; Causton and Game 2003), the GO project (Ashburner et al. 2000), the Proteomics Standards Initiative (standards for protein-protein interactions and mass spectrometry data) (Hermjakob et al. 2004a), and BioPAX (a common exchange format for pathways data).
In addition to data format standards, public databases that provide data in these formats for bulk download are also needed. Table 1 lists some of the public databases that provide genomics data sets for bulk download by various means. The Generic Model Organism Database (GMOD) project is a collaboration among the model organism databases to develop reusable software components suitable for sharing across different database groups; many useful, freely available software components are available at the GMOD Web site (http://www.gmod.org).
Conclusion and some thoughts about the future
In the decade since the release of the yeast genome DNA sequence, there has been the expected change in the technology of yeast research as well as a rather surprising change in its goals. Indeed, as we have outlined, most of the new understanding of individual yeast gene functions has come from comparative genomics and relatively little from the high-throughput genomic technologies. The latter have, however, fueled the changes in goals, from a focus on individual genes and their interactions to a focus on the system-level transactions that make the robustly functioning organisms we find in nature.
The future of genome-scale technologies is, nevertheless, very promising. It is not clear whether the slow rate at which new annotations are verified is caused by problems in the data, data analysis and representation, or by a more simple lack of focus on the need for such verification. Some methods, now in early stages of development, will no doubt help: Among these are methods based on natural variation (examples include Brem et al. 2002; Steinmetz et al. 2002; Fay et al. 2004), methods that are not limited to nonessential genes (e.g., synthetic lethality with conditional alleles) (see Tong et al. 2004) or titratable promoter alleles (Mnaimneh et al. 2004), methods that study the locations and movements of intracellular molecules (Ghaemmaghami et al. 2003; Huh et al. 2003), and methods that use more biological information from other species (for example, Harbison et al. 2004).
We seem to be just at the dawn of the ability to construct truly quantitative, let alone comprehensive, models of functional and regulatory network interactions at the system level. The apparently simplest case might well be understanding metabolism at this level (a nascent field already being called “metabolomics”; (see Famili et al. 2003; Forster et al. 2003; for a review, see Smedsgaard and Nielsen 2005). To this end, it is clear that we lack most of the required basic measurements, such as the concentrations of metabolites in real time after perturbations in the style of Gasch et al. (2000) and Idecker et al. (2001b). Fortunately, in the post-genome-sequence era, it is much easier to acquire this kind of information on a comprehensive scale, and we believe that this will be the path forward. Another challenge of this nature is to understand the basis on which selection acts on the ensemble of genes, proteins, networks, and systems to produce organisms capable of surviving in new environments.
Finally, there remains the eternal issue of verification. We expect that the need for tests of hypotheses generated by genome-scale experiments and quantitative models will persist for a very long time. As has always been the case, every model (and the data used to generate it) must be tested, and to be tested, it must be specified in full and available to the public. The yeast community has an excellent record in this regard, one that we believe is a major reason that yeast continues to be the very model of a model organism.
Notes
[2] Article and publication are at http://www.genome.org/cgi/doi/10.1101/gr.3727505.
[3] Corresponding author. E-mail [email protected]; fax (609) 258-7070.
References
- ↵Alberts, B.M., Botstein, D., Brenner, S., Cantor, C.R., Doolittle, R.F., Hood, L., McKusick, V.A., Nathans, D., Olson, M.V., Orkin, S. 1988. Mapping and sequencing the human genome. In National Resource Council. National Academy Press, Washington, DC.
- ↵Ashburner, M., Ball, C.A., Blake, J.A., Botstein, D., Butler, H., Cherry, J.M., Davis, A.P., Dolinski, K., Dwight, S.S., Eppig, J.T., et al. 2000. Gene ontology: Tool for the unification of biology. Nat. Genet. 25: 25-29.
- ↵Bader, G.D., Betel, D., and Hogue, C.W. 2003. BIND: The Biomolecular Interaction Network Database. Nucleic Acids Res. 31: 248-250.
- ↵Balakrishnan, R., Christie, K.R., Costanzo, M.C., Dolinski, K., Dwight, S.S., Engel, S.R., Fisk, D.G., Hirschman, J.E., Hong, E.L., Nash, R., et al. 2005. Fungal BLAST and Model Organism BLASTP Best Hits: New comparison resources at the Saccharomyces Genome Database (SGD). Nucleic Acids Res. 33: D374-D377.
- ↵Ball, C.A., Jin, H., Sherlock, G., Weng, S., Matese, J.C., Andrada, R., Binkley, G., Dolinski, K., Dwight, S.S., Harris, M.A., et al. 2001. Saccharomyces Genome Database provides tools to survey gene expression and functional analysis data. Nucleic Acids Res. 29: 80-81.
- ↵Bar-Joseph, Z., Gerber, G.K., Lee, T.I., Rinaldi, N.J., Yoo, J.Y., Robert, F., Gordon, D.B., Fraenkel, E., Jaakkola, T.S., Young, R.A., and Gifford, D.K. 2003. Computational discovery of gene modules and regulatory networks. Nat. Biotechnol. 21: 1337-1342.
- ↵Beer, M.A. and Tavazoie, S. 2004. Predicting gene expression from sequence. Cell 117: 185-198.
- ↵Boyle, E.I., Weng, S., Gollub, J., Jin, H., Botstein, D., Cherry, J.M., and Sherlock, G. 2004. GO::TermFinder: Open source software for accessing Gene Ontology information and finding significantly enriched Gene Ontology terms associated with a list of genes. Bioinformatics 20: 3710-3715.
- ↵Brazma, A., Parkinson, H., Sarkans, U., Shojatalab, M., Vilo, J., Abeygunawardena, N., Holloway, E., Kapushesky, M., Kemmeren, P., Lara, G.G., et al. 2003. ArrayExpress: A public repository for microarray gene expression data at the EBI. Nucleic Acids Res. 31: 68-71.
- ↵Breitkreutz, B.J., Stark, C., and Tyers, M. 2003. The GRID: The General Repository for Interaction Datasets. Genome Biol. 4: R23.
- ↵Brem, R.B., Yvert, G., Clinton, R., and Kruglyak, L. 2002. Genetic dissection of transcriptional regulation in budding yeast. Science 296: 752-755.
- ↵Brown, P.O. and Botstein, D. 1999. Exploring the new world of the genome with DNA microarrays. Nat. Genet. 21: 33-37.
- ↵Bussemaker, H.J., Li, H., and Siggia, E.D. 2001. Regulatory element detection using correlation with expression. Nat. Genet. 27: 167-171.
- ↵Causton, H.C. and Game, L. 2003. MGED comes of age. Genome Biol. 4: 351.
- ↵Cheng, Y. and Church, G.M. 2000. Biclustering of expression data. Proc. Int. Conf. Intell. Syst. Mol. Biol. 8: 93-103.
- ↵Chervitz, S.A., Aravind, L., Sherlock, G., Ball, C.A., Koonin, E.V., Dwight, S.S., Harris, M.A., Dolinski, K., Mohr, S., Smith, T., et al. 1998. Comparison of the complete protein sets of worm and yeast: orthology and divergence. Science 282: 2022-2028.
- ↵Cho, R.J., Campbell, M.J., Winzeler, E.A., Steinmetz, L., Conway, A., Wodicka, L., Wolfsberg, T.G., Gabrielian, A.E., Landsman, D., Lockhart, D.J., et al. 1998. A genome-wide transcriptional analysis of the mitotic cell cycle. Mol. Cell 2: 65-73.
- ↵Chu, S., DeRisi, J., Eisen, M., Mulholland, J., Botstein, D., Brown, P.O., and Herskowitz, I. 1998. The transcriptional program of sporulation in budding yeast. Science 282: 699-705.
- ↵Chua, G., Robinson, M.D., Morris, Q., and Hughes, T.R. 2004. Transcriptional networks: Reverse-engineering gene regulation on a global scale. Curr. Opin. Microbiol. 7: 638-646.
- ↵Cliften, P., Sudarsanam, P., Desikan, A., Fulton, L., Fulton, B., Majors, J., Waterston, R., Cohen, B.A., and Johnston, M. 2003. Finding functional features in Saccharomyces genomes by phylogenetic footprinting. Science 301: 71-76.
- ↵Costanzo, M.C., Hogan, J.D., Cusick, M.E., Davis, B.P., Fancher, A.M., Hodges, P.E., Kondu, P., Lengieza, C., Lew-Smith, J.E., Lingner, C., et al. 2000. The yeast proteome database (YPD) and Caenorhabditis elegans proteome database (WormPD): Comprehensive resources for the organization and comparison of model organism protein information. Nucleic Acids Res. 28: 73-76.
- ↵DeRisi, J.L., Iyer, V.R., and Brown, P.O. 1997. Exploring the metabolic and genetic control of gene expression on a genomic scale. Science 278: 680-686.
- ↵Dobzhansky, T. 1946. Genetics of natural populations, XIII: Recombination and variability in populations of Drosophila pseudoobscura. Genetics 31: 269-290.
- ↵Edgar, R., Domrachev, M., and Lash, A.E. 2002. Gene Expression Omnibus: NCBI gene expression and hybridization array data repository. Nucleic Acids Res. 30: 207-210.
- ↵Eisen, M.B., Spellman, P.T., Brown, P.O., and Botstein, D. 1998. Cluster analysis and display of genome-wide expression patterns. Proc. Natl. Acad. Sci. 95: 14863-14868.
- ↵Famili, I., Forster, J., Nielsen, J., and Palsson, B.Ø. 2003. Saccharomyces cerevisiae phenotypes can be predicted by using constraint-based analysis of a genome-scale reconstructed metabolic network. Proc. Natl. Acad. Sci. 100: 13134-13139.
- ↵Fay, J.C., McCullough, H.L., Sniegowski, P.D., and Eisen, M.B. 2004. Population genetic variation in gene expression is associated with phenotypic variation in Saccharomyces cerevisiae. Genome Biol. 5: R26.
- ↵Forster, J., Famili, I., Fu, P., Palsson, B. Ø., and Nielsen, J. 2003. Genome-scale reconstruction of the Saccharomyces cerevisiae metabolic network. Genome Res. 13: 244-253.
- ↵Gao, F., Foat, B.C., and Bussemaker, H.J. 2004. Defining transcriptional networks through integrative modeling of mRNA expression and transcription factor binding data. BMC Bioinformatics 5: 31.
- ↵Gasch, A.P., Spellman, P.T., Kao, C.M., Carmel-Harel, O., Eisen, M.B., Storz, G., Botstein, D., and Brown, P.O. 2000. Genomic expression programs in the response of yeast cells to environmental changes. Mol. Biol. Cell 11: 4241-4257.
- ↵Gasch, A.P., Huang, M., Metzner, S., Botstein, D., Elledge, S.J., and Brown, P.O. 2001. Genomic expression responses to DNA-damaging agents and the regulatory role of the yeast ATR homolog Mec1p. Mol. Biol. Cell 12: 2987-3003.
- ↵Gavin, A.C., Bosche, M., Krause, R., Grandi, P., Marzioch, M., Bauer, A., Schultz, J., Rick, J.M., Michon, A.M., Cruciat, C.M., et al. 2002. Functional organization of the yeast proteome by systematic analysis of protein complexes. Nature 415: 141-147.
- ↵Ghaemmaghami, S., Huh, W.K., Bower, K., Howson, R.W., Belle, A., Dephoure, N., O'Shea, E.K., and Weissman, J.S. 2003. Global analysis of protein expression in yeast. Nature 425: 737-741.
- ↵Giaever, G., Chu, A.M., Ni, L., Connelly, C., Riles, L., Veronneau, S., Dow, S., Lucau-Danila, A., Anderson, K., Andre, B., et al. 2002. Functional profiling of the Saccharomyces cerevisiae genome. Nature 418: 387-391.
- ↵Goffeau, A., Barrell, B.G., Bussey, H., Davis, R.W., Dujon, B., Feldmann, H., Galibert, F., Hoheisel, J.D., Jacq, C., Johnston, M., et al. 1996. Life with 6000 genes. Science 274: 546, 563-567.
- ↵Gollub, J., Ball, C.A., Binkley, G., Demeter, J., Finkelstein, D.B., Hebert, J.M., Hernandez-Boussard, T., Jin, H., Kaloper, M., Matese, J.C., et al. 2003. The Stanford Microarray Database: Data access and quality assessment tools. Nucleic Acids Res. 31: 94-96.
- ↵Guldener, U., Munsterkotter, M., Kastenmuller, G., Strack, N., van Helden, J., Lemer, C., Richelles, J., Wodak, S.J., Garcia-Martinez, J., Perez-Ortin, J.E., et al. 2005. CYGD: The Comprehensive Yeast Genome Database. Nucleic Acids Res. 33: D364-D368.
- ↵Harbison, C.T., Gordon, D.B., Lee, T.I., Rinaldi, N.J., Macisaac, K.D., Danford, T.W., Hannett, N.M., Tagne, J.B., Reynolds, D.B., Yoo, J., et al. 2004. Transcriptional regulatory code of a eukaryotic genome. Nature 431: 99-104.
- ↵Hartwell, L.H., Hopfield, J.J., Leibler, S., and Murray, A.W. 1999. From molecular to modular cell biology. Nature 402: C47-C52.
- ↵Haugen, A.C., Kelley, R., Collins, J.B., Tucker, C.J., Deng, C., Afshari, C.A., Brown, J.M., Ideker, T., and Van Houten, B. 2004. Integrating phenotypic and expression profiles to map arsenic-response networks. Genome Biol. 5: R95.
- ↵Hazbun, T.R., Malmstrom, L., Anderson, S., Graczyk, B.J., Fox, B., Riffle, M., Sundin, B.A., Aranda, J.D., McDonald, W.H., Chiu, C.H., et al. 2003. Assigning function to yeast proteins by integration of technologies. Mol. Cell 12: 1353-1365.
- ↵Hermjakob, H., Montecchi-Palazzi, L., Bader, G., Wojcik, J., Salwinski, L., Ceol, A., Moore, S., Orchard, S., Sarkans, U., von Mering, C., et al. 2004a. The HUPO PSI's molecular interaction format: A community standard for the representation of protein interaction data. Nat. Biotechnol. 22: 177-183.
- ↵Hermjakob, H., Montecchi-Palazzi, L., Lewington, C., Mudali, S., Kerrien, S., Orchard, S., Vingron, M., Roechert, B., Roepstorff, P., Valencia, A., et al. 2004b. IntAct: An open source molecular interaction database. Nucleic Acids Res. 32: D452-D455.
- ↵Ho, Y., Gruhler, A., Heilbut, A., Bader, G.D., Moore, L., Adams, S.L., Millar, A., Taylor, P., Bennett, K., Boutilier, K., et al. 2002. Systematic identification of protein complexes in Saccharomyces cerevisiae by mass spectrometry. Nature 415: 180-183.
- ↵Hughes, T.R., Robinson, M.D., Mitsakakis, N., and Johnston, M. 2004. The promise of functional genomics: Completing the encyclopedia of a cell. Curr. Opin. Microbiol. 7: 546-554.
- ↵Huh, W.K., Falvo, J.V., Gerke, L.C., Carroll, A.S., Howson, R.W., Weissman, J.S., and O'Shea, E.K. 2003. Global analysis of protein localization in budding yeast. Nature 425: 686-691.
- ↵Ideker, T., Galitski, T., and Hood, L. 2001a. A new approach to decoding life: Systems biology. Annu. Rev. Genomics Hum. Genet. 2: 343-372.
- ↵Ideker, T., Thorsson, V., Ranish, J.A., Christmas, R., Buhler, J., Eng, J.K., Bumgarner, R., Goodlett, D.R., Aebersold, R., and Hood, L. 2001b. Integrated genomic and proteomic analyses of a systematically perturbed metabolic network. Science 292: 929-934.
- ↵Ihmels, J., Friedlander, G., Bergmann, S., Sarig, O., Ziv, Y., and Barkai, N. 2002. Revealing modular organization in the yeast transcriptional network. Nat. Genet. 31: 370-377.
- ↵Ito, T., Tashiro, K., Muta, S., Ozawa, R., Chiba, T., Nishizawa, M., Yamamoto, K., Kuhara, S., and Sakaki, Y. 2000. Toward a protein-protein interaction map of the budding yeast: A comprehensive system to examine two-hybrid interactions in all possible combinations between the yeast proteins. Proc. Natl. Acad. Sci. 97: 1143-1147.
- ↵Ito, T., Chiba, T., Ozawa, R., Yoshida, M., Hattori, M., and Sakaki, Y. 2001. A comprehensive two-hybrid analysis to explore the yeast protein interactome. Proc. Natl. Acad. Sci. 98: 4569-4574.
- ↵Iyer, V.R., Horak, C.E., Scafe, C.S., Botstein, D., Snyder, M., and Brown, P.O. 2001. Genomic binding sites of the yeast cell-cycle transcription factors SBF and MBF. Nature 409: 533-538.
- ↵Jansen, R., Yu, H., Greenbaum, D., Kluger, Y., Krogan, N.J., Chung, S., Emili, A., Snyder, M., Greenblatt, J.F., and Gerstein, M. 2003. A Bayesian networks approach for predicting protein-protein interactions from genomic data. Science 302: 449-453.
- ↵Kellis, M., Patterson, N., Endrizzi, M., Birren, B., and Lander, E.S. 2003. Sequencing and comparison of yeast species to identify genes and regulatory elements. Nature 423: 241-254.
- ↵Khodursky, A.B., Peter, B.J., Schmid, M.B., DeRisi, J., Botstein, D., Brown, P.O., and Cozzarelli, N.R. 2000. Analysis of topoisomerase function in bacterial replication fork movement: use of DNA microarrays. Proc. Natl. Acad. Sci. 97: 9419-9424.
- ↵King, O.D., Lee, J.C., Dudley, A.M., Janse, D.M., Church, G.M., and Roth, F.P. 2003. Predicting phenotype from patterns of annotation. Bioinformatics 19(Suppl 1): i183-i189.
- ↵Kluger, Y., Basri, R., Chang, J.T., and Gerstein, M. 2003. Spectral biclustering of microarray data: Coclustering genes and conditions. Genome Res. 13: 703-716.
- ↵Kurdistani, S.K., Robyr, D., Tavazoie, S., and Grunstein, M. 2002. Genome-wide binding map of the histone deacetylase Rpd3 in yeast. Nat. Genet. 31: 248-254.
- ↵Lander, E.S., Linton, L.M., Birren, B., Nusbaum, C., Zody, M.C., Baldwin, J., Devon, K., Dewar, K., Doyle, M., FitzHugh, W., et al. 2001. Initial sequencing and analysis of the human genome. Nature 409: 860-921.
- ↵Lee, T.I., Rinaldi, N.J., Robert, F., Odom, D.T., Bar-Joseph, Z., Gerber, G.K., Hannett, N.M., Harbison, C.T., Thompson, C.M., Simon, I., et al. 2002. Transcriptional regulatory networks in Saccharomyces cerevisiae. Science 298: 799-804.
- ↵Lee, I., Date, S.V., Adai, A.T., and Marcotte, E.M. 2004. A probabilistic functional network of yeast genes. Science 306: 1555-1558.
- ↵Lieb, J.D., Liu, X., Botstein, D., and Brown, P.O. 2001. Promoter-specific binding of Rap1 revealed by genome-wide maps of protein-DNA association. Nat. Genet. 28: 327-334.
- ↵Lukashin, A.V. and Fuchs, R. 2001. Analysis of temporal gene expression profiles: Clustering by simulated annealing and determining the optimal number of clusters. Bioinformatics 17: 405-414.
- ↵Marc, P., Devaux, F., and Jacq, C. 2001. yMGV: A database for visualization and data mining of published genome-wide yeast expression data. Nucleic Acids Res. 29: E63-E63.
- ↵Mewes, H.W., Albermann, K., Heumann, K., Liebl, S., and Pfeiffer, F. 1997. MIPS: A database for protein sequences, homology data and yeast genome information. Nucleic Acids Res. 25: 28-30.
- ↵Mnaimneh, S., Davierwala, A.P., Haynes, J., Moffat, J., Peng, W.T., Zhang, W., Yang, X., Pootoolal, J., Chua, G., Lopez, A., et al. 2004. Exploration of essential gene functions via titratable promoter alleles. Cell 118: 31-44.
- ↵Ng, H.H., Robert, F., Young, R.A., and Struhl, K. 2003. Targeted recruitment of Set1 histone methylase by elongating Pol II provides a localized mark and memory of recent transcriptional activity. Mol. Cell 11: 709-719.
- ↵Novick, P., Osmond, B.C., and Botstein, D. 1989. Suppressors of yeast actin mutations. Genetics 121: 659-674.
- ↵Pan, X., Yuan, D.S., Xiang, D., Wang, X., Sookhai-Mahadeo, S., Bader, J.S., Hieter, P., Spencer, F., and Boeke, J.D. 2004. A robust toolkit for functional profiling of the yeast genome. Mol. Cell 16: 487-496.
- ↵Prince, J.T., Carlson, M.W., Wang, R., Lu, P., and Marcotte, E.M. 2004. The need for a public proteomics repository. Nat. Biotechnol. 22: 471-472.
- ↵Pritsker, M., Liu, Y.C., Beer, M.A., and Tavazoie, S. 2004. Whole-genome discovery of transcription factor binding sites by network-level conservation. Genome Res 14: 99-108.
- ↵Raghuraman, M.K., Winzeler, E.A., Collingwood, D., Hunt, S., Wodicka, L., Conway, A., Lockhart, D.J., Davis, R.W., Brewer, B.J., and Fangman, W.L. 2001. Replication dynamics of the yeast genome. Science 294: 115-121.
- ↵Roberts, C.J., Nelson, B., Marton, M.J., Stoughton, R., Meyer, M.R., Bennett, H.A., He, Y.D., Dai, H., Walker, W.L., Hughes, T.R., et al. 2000. Signaling and circuitry of multiple MAPK pathways revealed by a matrix of global gene expression profiles. Science 287: 873-880.
- ↵Rubin, G.M., Yandell, M.D., Wortman, J.R., Gabor Miklos, G.L., Nelson, C.R., Hariharan, I.K., Fortini, M.E., Li, P.W., Apweiler, R., Fleischmann, W., et al. 2000. Comparative genomics of the eukaryotes. Science 287: 2204-2215.
- ↵Saldanha, A.J. 2004. Java Treeview: Extensible visualization of microarray data. Bioinformatics 20: 3246-3248.
- ↵Segal, E., Shapira, M., Regev, A., Pe'er, D., Botstein, D., Koller, D., and Friedman, N. 2003. Module networks: Identifying regulatory modules and their condition-specific regulators from gene expression data. Nat. Genet. 34: 166-176.
- ↵Sharan, R. and Shamir, R. 2000. CLICK: A clustering algorithm with applications to gene expression analysis. Proc. Int. Conf. Intell. Syst. Mol. Biol. 8: 307-316.
- ↵Shen-Orr, S.S., Milo, R., Mangan, S., and Alon, U. 2002. Network motifs in the transcriptional regulation network of Escherichia coli. Nat. Genet. 31: 64-68.
- ↵Smedsgaard, J. and Nielsen, J. 2005. Metabolite profiling of fungi and yeast: From phenotype to metabolome by MS and informatics. J. Exp. Bot. 56: 273-286.
- ↵Spellman, P.T., Sherlock, G., Zhang, M.Q., Iyer, V.R., Anders, K., Eisen, M.B., Brown, P.O., Botstein, D., and Futcher, B. 1998. Comprehensive identification of cell cycle-regulated genes of the yeast Saccharomyces cerevisiae by microarray hybridization. Mol. Biol. Cell 9: 3273-3297.
- ↵Spellman, P.T., Miller, M., Stewart, J., Troup, C., Sarkans, U., Chervitz, S., Bernhart, D., Sherlock, G., Ball, C., Lepage, M., et al. 2002. Design and implementation of microarray gene expression markup language (MAGE-ML). Genome Biol. 3: research0046.
- ↵Steinmetz, L.M., Sinha, H., Richards, D.R., Spiegelman, J.I., Oefner, P.J., McCusker, J.H., and Davis, R.W. 2002. Dissecting the architecture of a quantitative trait locus in yeast. Nature 416: 326-330.
- ↵Sturtevant, A.H. 1956. A highly specific complementary lethal system in Drosophila melanogaster. Genetics 41: 118-123.
- ↵Tamayo, P., Slonim, D., Mesirov, J., Zhu, Q., Kitareewan, S., Dmitrovsky, E., Lander, E.S., and Golub, T.R. 1999. Interpreting patterns of gene expression with self-organizing maps: Methods and application to hematopoietic differentiation. Proc. Natl. Acad. Sci. 96: 2907-2912.
- ↵Tanay, A., Sharan, R., and Shamir, R. 2002. Discovering statistically significant biclusters in gene expression data. Bioinformatics 18(Suppl 1): S136-S144.
- ↵Tirosh, I. and Barkai, N. 2005. Computational verification of protein-protein interactions by orthologous co-expression. BMC Bioinformatics 6: 40.
- ↵Tong, A.H., Evangelista, M., Parsons, A.B., Xu, H., Bader, G.D., Page, N., Robinson, M., Raghibizadeh, S., Hogue, C.W., Bussey, H., et al. 2001. Systematic genetic analysis with ordered arrays of yeast deletion mutants. Science 294: 2364-2368.
- ↵Tong, A.H., Lesage, G., Bader, G.D., Ding, H., Xu, H., Xin, X., Young, J., Berriz, G.F., Brost, R.L., Chang, M., et al. 2004. Global mapping of the yeast genetic interaction network. Science 303: 808-813.
- ↵Troyanskaya, O.G., Dolinski, K., Owen, A.B., Altman, R.B., and Botstein, D. 2003. A Bayesian framework for combining heterogeneous data sources for gene function prediction (in Saccharomyces cerevisiae). Proc. Natl. Acad. Sci. 100: 8348-8353.
- ↵Uetz, P., Giot, L., Cagney, G., Mansfield, T.A., Judson, R.S., Knight, J.R., Lockshon, D., Narayan, V., Srinivasan, M., Pochart, P., et al. 2000. A comprehensive analysis of protein-protein interactions in Saccharomyces cerevisiae. Nature 403: 623-627.
- ↵Velculescu, V.E., Zhang, L., Zhou, W., Vogelstein, J., Basrai, M.A., Bassett Jr., D.E., Hieter, P., Vogelstein, B., and Kinzler, K.W. 1997. Characterization of the yeast transcriptome. Cell 88: 243-251.
- ↵Venter, J.C., Adams, M.D., Myers, E.W., Li, P.W., Mural, R.J., Sutton, G.G., Smith, H.O., Yandell, M., Evans, C.A., Holt, R.A, et al. 2001. The sequence of the human genome. Science 291: 1304-1351.
- ↵Wang, W., Cherry, J.M., Botstein, D., and Li, H. 2002. A systematic approach to reconstructing transcription networks in Saccharomyces cerevisiae. Proc. Natl. Acad. Sci. 99: 16893-16898.
- ↵Wang, W., Cherry, J.M., Nochomovitz, Y., Jolly, E., Botstein, D., and Li, H. 2005. Inference of combinatorial regulation in yeast transcriptional networks: A case study of sporulation. Proc. Natl. Acad. Sci. 102: 1998-2003.
- ↵Weinstein, J.N., Myers, T.G., O'Connor, P.M., Friend, S.H., Fornace Jr., A.J., Kohn, K.W., Fojo, T., Bates, S.E., Rubinstein, L.V., Anderson, N.L., et al. 1997. An information-intensive approach to the molecular pharmacology of cancer. Science 275: 343-349.
- ↵Wen, X., Fuhrman, S., Michaels, G.S., Carr, D.B., Smith, S., Barker, J.L., and Somogyi, R. 1998. Large-scale temporal gene expression mapping of central nervous system development. Proc. Natl. Acad. Sci. 95: 334-339.
- ↵Winzeler, E.A., Shoemaker, D.D., Astromoff, A., Liang, H., Anderson, K., Andre, B., Bangham, R., Benito, R., Boeke, J.D., Bussey, H., et al. 1999. Functional characterization of the S. cerevisiae genome by gene deletion and parallel analysis. Science 285: 901-906.
- ↵Wong, S.L., Zhang, L.V., Tong, A.H., Li, Z., Goldberg, D.S., King, O.D., Lesage, G., Vidal, M., Andrews, B., Bussey, H., et al. 2004. Combining biological networks to predict genetic interactions. Proc. Natl. Acad. Sci. 101: 15682-15687.
- ↵Xenarios, I., Salwinski, L., Duan, X.J., Higney, P., Kim, S.M., and Eisenberg, D. 2002. DIP, the Database of Interacting Proteins: A research tool for studying cellular networks of protein interactions. Nucleic Acids Res. 30: 303-305.
- ↵Yeger-Lotem, E., Sattath, S., Kashtan, N., Itzkovitz, S., Milo, R., Pinter, R.Y., Alon, U., and Margalit, H. 2004. Network motifs in integrated cellular networks of transcription-regulation and protein-protein interaction. Proc. Natl. Acad. Sci. 101: 5934-5939.
- ↵Yu, H., Luscombe, N.M., Lu, H.X., Zhu, X., Xia, Y., Han, J.D., Bertin, N., Chung, S., Vidal, M., and Gerstein, M. 2004. Annotation transfer between genomes: Protein-protein interologs and protein-DNA regulogs. Genome Res. 14: 1107-1118.
- ↵Zanzoni, A., Montecchi-Palazzi, L., Quondam, M., Ausiello, G., Helmer-Citterich, M., and Cesareni, G. 2002. MINT: A Molecular INTeraction database. FEBS Lett. 513: 135-140.
- ↵Zhu, G., Spellman, P.T., Volpe, T., Brown, P.O., Botstein, D., Davis, T.N., and Futcher, B. 2000. Two yeast forkhead genes regulate the cell cycle and pseudohyphal growth. Nature 406: 90-94.
Web site references
- ↵http://genome.brc.mcw.edu/goldenPath/stats.html; UCSC Gold Path.
- ↵http://www.genome.wustl.edu/projects/celegans/; GSC at Washington University.
- ↵http://www.geneontology.org; Gene Ontology home page.
- ↵http://obo.sourceforge.net/; Open Biological Ontologies.
- ↵http://www.gmod.org; Generic Model Organism Database.
- ↵http://db.yeastgenome.org/cgi-bin/expression/expressionConnection.pl; SGD Expression Connection tool.