
Predicting Gene Ontology Biological Process From Temporal Gene Expression Patterns
- Astrid Lægreid1,4,
- Torgeir R. Hvidsten2,
- Herman Midelfart2,
- Jan Komorowski2,3,4, and
- Arne K. Sandvik1
- 1Department of Cancer Research and Molecular Medicine, Norwegian University of Science and Technology, N-7489 Trondheim, Norway; 2Department of Information and Computer Science, Norwegian University of Science and Technology, N-7491 Trondheim, Norway; 3The Linnaeus Centre for Bioinformatics, Uppsala University, SE-751 24 Uppsala, Sweden
Abstract
The aim of the present study was to generate hypotheses on the involvement of uncharacterized genes in biological processes. To this end, supervised learning was used to analyze microarray-derived time-series gene expression data. Our method was objectively evaluated on known genes using cross-validation and provided high-precision Gene Ontology biological process classifications for 211 of the 213 uncharacterized genes in the data set used. In addition, new roles in biological process were hypothesized for known genes. Our method uses biological knowledge expressed by Gene Ontology and generates a rule model associating this knowledge with minimal characteristic features of temporal gene expression profiles. This model allows learning and classification of multiple biological process roles for each gene and can predict participation of genes in a biological process even though the genes of this class exhibit a wide variety of gene expression profiles including inverse coregulation. A considerable number of the hypothesized new roles for known genes were confirmed by literature search. In addition, many biological process roles hypothesized for uncharacterized genes were found to agree with assumptions based on homology information. To our knowledge, a gene classifier of similar scope and functionality has not been reported earlier.
[Supplemental material is available online atwww.genome.org. All annotations, reclassifications of known genes, and classifications of uncharacterized genes are available online athttp://www.lcb.uu.se/∼hvidsten/fibroblast.]
One of the main goals of the postgenomic era is to understand the multiple biological roles of genes and gene products, and their interaction in complex networks in living organisms. With the scarce and fragmented status of present knowledge, this is an enormous challenge. It requires substantial new developments in experimental biology and computer science to extract, translate, and integrate experimental observations into functional molecular biological models. DNA-microarray technology (Schena et al. 1995) allows parallel measurement of thousands of genes in different biological settings. Genes coding for gene products involved in the same biological process are likely to be regulated in a coordinated manner. Therefore, when searching for the roles of a gene in terms of involvement in biological processes, measurements of changes in gene expression throughout the time course of a given biological response are of particular interest.
Clustering methods (unsupervised learning) offer efficient ways of finding overall patterns and tendencies in microarray gene expression data. Such methods can discover classes of expression patterns and identify groups of genes that are regulated in a similar manner and can therefore indicate along which lines biological interpretations may be sought in a given experiment (Eisen et al. 1998; Iyer et al. 1999). On the other hand, unsupervised learning methods usually do not use existing biological knowledge in finding the clusters, and they do not offer well-established methods for classifying uncharacterized genes according to their biological roles. By including biological knowledge in the learning process, supervised methods can generate gene-expression-based models that can be used for classification of unknown genes. Furthermore, such models can be objectively evaluated with respect to classification quality.
Although hierarchical clustering has shown that similarity in biological roles often corresponds to expression similarity (Eisen et al. 1998), biologically related genes in many instances show dissimilar expression profiles and may even be inversely coregulated (Eisen et al. 1998; Iyer et al. 1999; Shatkay et al. 2000; Stanton et al. 2000). Moreover, gene products often have multiple actions. The relations between temporal changes in gene transcript levels and the multiple biological roles of the gene products are so complex that, given our present knowledge, it may only be possible to use learning from examples to create models.
The Gene Ontology (GO) (http://www.geneontology.org; The Gene Ontology Consortium 2000) provides a valuable source of structured knowledge of protein function in terms of molecular function,biological process, and cellular component. In each of these three ontologies, the classifications are arranged in a hierarchy in which the components may have more than one parent component (directed acyclic graph). Use of GO in analysis of experimental data from high-throughput methods enables integration of biological background data in a controlled manner.
Our particular research goal was to model the relationships betweengene expression as a function of time and involvement of a gene in a given biological process and to use this model to predict the biological roles of unknown genes. We built anif-then rule model using a supervised learning method based on Rough Sets (Pawlak 1991; Komorowski 1999; Skowron et al. 2002). It associated Gene Ontology (GO) classes of biological processes (The Gene Ontology Consortium 2000) with minimal features of temporal gene transcript profiles from the fibroblast serum response in a data set provided by Iyer et al. (1999). Gene profiles of 497 unknown and known genes in the fibroblast serum response were then subjected to the model to classify (reclassify, respectively) the genes. The process provided hypotheses about multiple roles of the genes in terms of GO biological process. Our method generated a high-precision model that produced a substantial number of new hypotheses about biological roles of both characterized and uncharacterized genes. Methods like the one presented here may be pivotal in future research by permitting a more focused experimental approach to elucidate the biological roles of genes.
RESULTS
Construction of Training Examples
We used a data set provided by Iyer et al. (1999;http://genome-www.stanford.edu/serum) that describes the transcript levels of genes detected by 517 different gene probes during the first 24 h of the serum response in serum-starved human fibroblasts. The 517 gene probes corresponded to 497 unique genes, because 20 genes were represented by more than one probe according to Unigene clustering of cDNA sequences (http://www.ncbi.nlm.nih.gov/UniGene/index.html; 2002). For each gene, biological processes were assigned at the lowest possible (most specific) level of GO (The Gene Ontology Consortium 2000; http://www.geneontology.org/). Information for annotations was extracted manually from UniGene (http://www.ncbi.nlm.nih.gov/UniGene/index.html), LocusLink (http://www.ncbi.nlm.nih.gov/LocusLink/index.html), SWISS-PROT (http://us.expasy.org/sprot), GENATLAS (http://bisance.citi2.fr/GENATLAS), and from the literature. For 284 of the 497 genes, information for GO annotations was found (Table1). No biological process information was found on the biological roles of the remaining 213 genes, and these were termed unknown or uncharacterized. After the completion of our annotation work, human gene GO annotations have been made available by LocusLink. There is good agreement between our annotations and those at LocusLink. However, in general, we obtained a higher number of annotations per gene, and many of our annotations were at a more detailed level.
Annotation of Known Genes
The annotated genes formed learning examples from which a rule model was trained. Because supervised learning requires a nontrivial number of examples from each class from which to learn, the genes were grouped into classes of at least 4 elements. To achieve this, the more specific annotations were moved upward in the ontology so that the learning examples were grouped into 23 broad classes of biological processes (e.g., stress response, transport, cell proliferation; see Table 1). Thus, a class is a set of genes that all have an annotation with a common ancestor in the GO hierarchy. Of the 284 known genes, 273 belonged to these 23 broad classes of GO biological process.
The 273 genes of the 23 broad GO classes gave rise to 549 training examples because for 167 genes more than one biological process was annotated to the same gene (see Table 2B). There are several reasons for this coannotation. One reason is that some biological processes have more than one parent in the GO hierarchy. For instance, DNA replication is a child of bothDNA metabolism and of cell cycle. Moreover, many of the encoded proteins have multiple biological roles, like ribosomal proteins, which are involved in protein synthesis (process:protein metabolism and modification) as well as being structural components of ribosomes (process: cell organization and biogenesis; see, e.g., RPL5 in Table 1). Another example is cell adhesion proteins, which are often found also to play a role in cell motility, cell proliferation, and development (e.g.,CLDN11 in Table 1). Furthermore, one type of molecular function may have two or more different descriptions at the biological process level in GO. For example, kinases and phosphatases involved inintracellular signaling cascade are coannotated withprotein metabolism and modification because they modify other proteins by phosphorylation and dephosphorylation.
Summary of the Rule Model
The temporal expression profiles of the genes in each GO class are shown in Figure 1 and Figure 3 below. It can be seen that many of the biological processes involve genes that are up-regulated when other genes involved in the same process are down-regulated. These genes can be said to be inversely coregulated (see, e.g., cell motility and defense (immune) response in Fig. 1). By using agglomerative hierarchical clustering, Iyer et al. (1999) detected 10 major gene expression profile clusters (A–J) among the differentially expressed genes of the serum response. Figure 2 shows that three biological process classes (cell proliferation, protein metabolism and modification, and oncogenesis) contain genes whose expression profiles are distributed among all the 10 expression profile clusters. Another 6 processes included genes with expression profiles distributed among 9 of the 10 expression profile clusters. This observation points out the high complexity of the expression profiles of genes participating in one biological process.
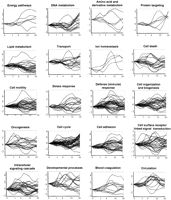
Expression profiles for different biological process function-class training example genes. The x-axis shows time, and they-axis shows log2-transformed gene expression ratios (serum treated vs. control). Expression profiles for the three processes not shown in this figure are shown in Figure 3A.
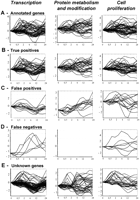
Expression profiles of annotated and classified genes for the processestranscription, protein metabolism and modification, and cell proliferation. The x-axis shows time, and the y-axis shows log2-transformed gene expression ratios (serum treated vs. control). For each process the following expression profiles are shown: (A) training example genes annotated with the process; (B) training example genes correctly classified to the process, that is, true positives; (C) training example genes classified but not annotated to the process, that is, false positives; (D) training example genes that the rule model failed to classify with the biological process to which they were annotated, that is, false negatives; and (E) unknown (uncharacterized) genes classified to the process.
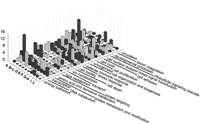
Distribution of training example genes annotated with different biological processes across expression profile clusters. Genes annotated with the 23 broad biological processes used in the present work distributed across the 10 expression profile clusters (A–J) as determined by Iyer et al. (1999) using hierarchical clustering.
Generating the Rule Model
A Rough Set-based supervised learning method (Pawlak 1991;Komorowski 1999; Skowron et al. 2002) was used to generate the model from the 549 training examples represented by their GO biological process annotations and by their gene expression levels. To accommodate the high complexity of the temporal gene expression profiles observed for genes in one biological process class (see Figs. 1 and3), numerical gene expression data were transformed into template data in which each gene expression profile was described as a combination of templates “increase”, “decrease”, and “constant” over time intervals of at least 3 or 4 time points. The combination of templates and time intervals created 55 different features. Because of this relatively large number, most genes had a unique combination of the 55 features. The template approach allows us to focus on the relative changes in transcript levels and to regard the temporal expression profile of each gene as a combination of several subinterval profiles. Thus, we can discover similarities of changes in transcript levels within shorter time frames than the whole 24-h period.
The trained model defines relationships between the gene expression profiles observed during the fibroblast response (measured data) and the involvement of the genes in GO biological processes (biological background knowledge). It consisted of 18,064 rules and is summarized in Table 2. The if-then rules of the model that define a particular biological process (see examples in Table3) describe minimal expression profile properties (features) that discern genes participating in one process from genes participating in all other processes. On the average, 3 out of 55 original features were used in each rule. This shows that minimization effectively removed the insignificant features to obtain general rules that can classify unseen gene profiles. The rules are approximate and define the relationship between gene expression and biological role only with some confidence level. Comparing thetranscription gene rule examples in Table 3 with thetranscription gene expression profiles in Figure 3A shows that the variety of profiles is much greater than described by the rules in Table 3. The few rules shown in Table 3 are far from sufficient to completely describe the relationships between expression profiles and the biological role of transcription genes. A high number of rules (for transcription there were 5402 rules) is needed to define these relationships.
Examples of Rules Induced for transcription
Classifications produced by the model are a direct consequence of the rules. However, only the rules that match the gene to be classified contribute to the classification. For example, the first rule in Table3 is only used when confronted with an expression profile that meets the requirement of constant transcript levels from 30 min to 4 h, decreasing levels from 1–8 h, and increasing levels from 16–24 h. The final classifications are then sorted out among all the processes indicated by all the rules matching the gene using a voting procedure (see Methods for details).
A 10-fold cross-validation showed that the model exhibited high classification quality (average AUC value 0.88; Table4). This demonstrates that our model captures the complexity of expression profiles among genes participating in one biological process, and that it is able to apply it successfully in the classification process. The values for sensitivity and specificity were chosen to allow for a high number of true positives at the price of a relatively large number of false positives. With a sensitivity of 84% (Table 4), 49% of the classifications during cross-validation were correct. A proportion of correct classifications of 90% can be achieved by using stricter requirements, but this will result in a decrease in sensitivity to 39% (data not shown). This illustrates how the predictive model can be adjusted to fit the goals of the analysis with respect to specificity and sensitivity.
Classification Quality During Cross-Validation
Using the Model to Reclassify Known Genes
We used a model trained from all the example genes to classify unknown genes and to reclassify the known genes (Table5). This model was trained with the parameters used during cross-validation shown in Table 4. By this approach, the classification quality from cross-validation is normally interpreted as the expected quality of the classifications of uncharacterized genes (unseen cases). The ability of the rule model to recognize and reconstruct the complex expression profiles for genes participating in one biological process is illustrated with an analysis of three sample processes: cell proliferation,transcription, and protein metabolism and modification (Fig. 3). The expression profiles of the correctly classified genes (Fig. 3B) reflect a very broad range of different expression profiles within the annotated genes of one biological process (Fig. 3A).
Classifications Obtained With the Model
By reclassification of the annotated genes (Table6), we obtained one or more correct classifications for 272 of the 273 known genes. Of the total of 738 classifications, 519 (70%) agreed with the annotations. Reclassification hence generated 219 false-positive classifications, that is, classifications of genes to classes with which they were not annotated. Some of these classifications will appear to be incorrect. However, a share of the false-positive classifications may represent new knowledge in the sense that this knowledge may have been unrecognized during the annotation process (i.e., missing annotations). In other instances, the involvement of a gene in the classified biological processes may not have been reported at the time of annotation. In the latter case, we hypothesized new biological roles of known genes.
Reclassification of Known Genes
An examination of the literature for false-positive reclassifications of training examples showed that some of them, indeed, represent existing knowledge. Examples of such missing annotations will be given in the sequel. Of the 14 genes with a false-positive classification for DNA metabolism, 4 were found to participate in this process. These genes are CCNA2 (cyclin A2; Ravnik and Wolgemuth 1996),CENPF (Centromere protein F; Zhu et al. 1995), CKS2(CDC28 protein kinase 2; Zhang et al. 1995), and XPO1(Exportin 1), which is a homolog of the yeast CRM1 gene involved in chromosome maintenance (Adachi and Yanagida 1989). Another process with a high proportion of false-positive classifications wasoncogenesis. All 17 genes annotated with this process were correctly classified. However, our model predicted that another 24 genes participate in oncogenesis. A literature search revealed that 12 of these 24 false-positive classifications represented missing annotations (Table 7). The genes with missing annotations for oncogenesis include the tumor suppressors CDKN1C (cyclin-dependent kinase inhibitor 1C),EGR1 (early growth response 1), and proto-oncogenesNR4A3 (nuclear receptor subfamily 4, group A, member 3) andCOPEB (core promoter element binding protein). This result shows that the model was able to hypothesize (or to rediscover) existing knowledge that was not included in the initial annotation process.
False Positives for oncogenesis:Missing Annotations
False-negative classifications are annotations of known genes that our model failed to reproduce as classifications. This means that the expression profiles of the genes could not be matched to the training examples of the annotated biological process. Examples of such expression profiles are shown in Figure 3D. False negatives may arise from (1) incorrect annotations, (2) insufficient representative learning examples, or (3) no involvement of the genes in question in the annotated biological process in the specific context of the fibroblast serum response. For cell proliferation, there were seven false negatives, including genes correctly classified to participate in cell death (KIT, BMP1) andcirculation (BMP1, VEGF). Although these gene products may participate in cell proliferation in other biological responses or in other cell types, they need not be involved in this biological process during the fibroblast serum response.
Coclassification Reveals Coregulation of Biological Processes
Biological processes occurring during the fibroblast serum response may be related in the sense that genes participating in these processes are transcriptionally coregulated. Coregulation may be discovered by our model by coclassifications of more than one process to the same gene. These coclassifications were generated wherever the model identified a similarity of the expression profile of the classified gene with the profiles of training example genes of two or more different biological processes. High frequencies of coclassifications were obtained for some pairs of processes during reclassification (Table 8), indicating that many training genes from these pairs of processes display similar temporal expression profiles. Our model therefore hypothesized that some biological processes are related via transcriptional coregulation during the fibroblast serum response. Many such pairs of processes, for example,DNA metabolism–cell cycle, cell organization and biogenesis–cell cycle, and cell motility–defense (immune) response, were frequently annotated to the same gene. This indicated that these processes are also related in the sense that they involve proteins that are known to participate in both processes. Consequently, our model rediscovered several pairs of processes that are also linked by coannotations. Additionally, the model discovered transcriptional coregulation of pairs of biological processes that do not involve high numbers of genes known to participate in both processes, such as transcription–intracellular signaling cascade and transcription–lipid metabolism. These pairs of processes show a low dependency between coannotations and coclassifications to the same gene (Table 8). Our results indicate that in each of these pairs the biological processes follow similar time courses even though each of the processes is mainly carried out by proteins not directly involved in the other process of the pair. The processes transcription and lipid metabolism are not known to cooperate in a general sense even though lipid metabolism is partly regulated by transcription. However, for the process pairtranscription–intracellular signaling cascade, our model has discovered coregulation of genes involved in two processes that are known to cooperate because transcription in most cases is regulated by intracellular signaling cascades.
Pairs of Biological Processes With High Frequency of Coclassifications to the Same Gene
Use of the Model to Predict Biological Roles of Unknown Genes
We obtained a total of 548 classifications for 211 genes out of the 213 unknown (uncharacterized) genes (Table9). These classifications should be regarded as hypotheses about the biological roles of these genes. The quality of such predictions is estimated using cross-validation over the training examples (known genes; Table 4). We also searched for homology information that could be used to make assumptions about the biological processes in which the uncharacterized genes may participate. Of the 24 genes for which such assumptions could be made, 11 genes had one or more classifications that matched this assumption (Table 10). These genes includeLOC55977, which shows some homology to the thromboxane A-2 receptor known to be involved in the LOC55977-classified processes blood coagulation (Halushka et al. 1995) and indevelopmental processes (development of the retina; Hardy et al. 2000). FLJ10217, homologous to oxysterol-binding protein, was classified with cell death and blood coagulation, which are biological processes in which oxysterol-binding protein is known to participate (Schroepfer Jr. 2000). H-l(3)mbt-l is a human homolog of a Drosophilatumor-suppressor protein (Koga et al. 1999) involved in chromosome segregation and was classified with the processes cell proliferation and oncogenesis. An EST, highly similar to SMHU1B metallothionein 1B, was classified with the processes ion homeostasis and stress response, which are the biological processes annotated to metallothioneins (Davis and Cousins 2000).
Classification of Uncharacterized Genes
Uncharacterized Genes With Classifications That Match Biological Functions Deduced From Homology Information
DISCUSSION
Supervised learning methods in the analysis of gene expression offer a complementary approach to unsupervised methods such as cluster analysis. Instead of first discovering new classes of expression-wise related genes and then evaluating them according to known classes of biological process, this approach builds models from training examples of genes previously known to be involved in specific biological processes and uses the models both for reclassification of the known genes and for classification of uncharacterized genes.
The annotation process provides a link between biological knowledge and gene expression profiles. Our method handles multiple annotations and multiple classifications, which is important because there are many genes that encode proteins that play a role in more than one biological process. The learning examples are very complex also from a different perspective: Although genes that constitute one class (e.g., a GO biological process) are biologically related, their corresponding temporal expression profiles can be very different including, for instance, inverse coregulation or coregulation with a time lag or a combination of both (see Figs. 1 and 3). Our method accommodates this complexity of temporal gene expression profiles by focusing on relative changes in gene transcript profiles over shorter time intervals. With a supervised learning approach, we can use the learning examples to find characteristic properties (features) of each class, which are given a priori “increasing”, “decreasing”, “constant”, and GO annotations, and then use these features in model construction. Our results therefore demonstrate how supervised methods may contribute in generating hypotheses about gene biological roles. Establishing the optimal supervised learning method for biological role classification from gene expressions was not among the aims of this work, and it is possible that other supervised approaches and systems might be used with comparable success.
The legible nature of if-then rules makes our approach particularly suitable for practical application in gene expression analysis because biologists can inspect the rules and get a clear intuition about how the approach works. This is opposed to, for example, neural networks and support vector machines. Of course, large rule sets are still difficult to comprehend, and methods for rule pruning and graphical displaying still have to be developed further. Also, other supervised methods produce legible models, such as decision trees. Decision trees, however, select features individually by ranking them, whereas our approach considers the discriminatory capability of several features combined. This might prove advantageous in biological applications, although it comes with a price of higher computational demands (the time consumed by the algorithm grows proportional to the square of the number of examples). Whereas most supervised learning algorithms use expression ratios directly, our Rough Set-based approach requires discrete values. Several algorithms for discretization exist, but finding something that works can quite often be a difficult task. Being able to handle discrete values, however, can be advantageous in biological application because, for example, sequence-derived data may easily be added as a part of the basis for inducing models.
The results demonstrate that our method is robust. Even training example genes with incomplete annotations may be used for learning. Many false-positive reclassifications for the known genes were found to represent true knowledge. Existing knowledge that had not been included in the annotation process could now be found by a literature search guided by the hypotheses generated by our model. This illustrates how the training examples may be updated through a reclassification process. It follows that an enhanced model may be obtained from the iteratively improved (and validated) annotations of the genes used as examples for learning.
A considerable proportion of hypotheses generated for unknown genes agreed with assumptions based on homology information available for a small number of these genes. This confirms the cross-validation estimates, suggesting that hypotheses produced for unknown genes are of high quality. The hypotheses created by our classification process should be validated experimentally. However, this task was outside the scope of the present work.
Few clustering studies provide a quantitative measure of the agreement between clusters and biological categories. Thus, most clustering studies cannot specify to which degree we can trust assignment of biological role to uncharacterized genes in these clusters. Cho et al. (2001) used a semisupervised method in which class knowledge was used to help find clusters in an analysis of gene expression profiles during human fibroblast cell cycle. Hypothesis testing was used to determine whether biologically related genes were statistically overrepresented in the expression clusters. Although Cho et al. did not explore the possible use of their clusters for classification of genes, this has recently been reported by Wu et al. (2002) using a similar semisupervised methodology. Statistically significant overlapping clusters were annotated with biological process and subsequently used for prediction of the involvement of 1644 of 3020 uncharacterized yeast genes. Because the clusters were overlapping, one gene could be predicted to several processes. Validation on known genes showed that the method could provide high-quality classifications for some of the processes represented in the training set.
To the best of our knowledge, Brown et al. (2000) have done the only study in which the biological roles of genes are classified from expression data in a supervised manner. They used 2467 annotated yeast genes to train support vector machines to recognize six different classes of biological roles containing 230 of the 2467 genes. Five of these classes had earlier been shown to exhibit homogenous temporal expression profiles using hierarchical clustering (Eisen et al. 1998), but for the last class this was not true. They then used the model to provide hypotheses on the biological roles for 15 uncharacterized genes.
In our study, 23 different biological process classes with 273 of the 284 known genes were used to train a model. These classes were not selected according to their suitability toward learning; the only requirement was that the class contained at least 4 annotated genes. We may thus claim that our method is close to giving a complete classifier for genes involved in a biological response such as the fibroblast serum response.
Finally, our work shows that Gene Ontology (The Gene Ontology Consortium 2000) emulates biological knowledge that may be associated with gene expression profiles. These associations may be effectively used in discovering new biological roles of unknown and known genes. Future research will include full use of the hierarchy of biological processes given by GO (Midelfart et al. 2001).
METHODS
Annotation Sources
The Gene Ontology version used for annotations was revision 1.1152 released August 25, 2000. Annotations used to represent the 23 classes for learning were according to revision 2.158 released December 4, 2001. Unigene data were from build #145 released in 2001. All homology data were taken from this Unigene build. SWISS-PROT, LocusLink, and GENATLAS data were mainly from the database versions of January 2001 with some occasional newer entries used for some annotations.
The Rule Model
Data
The initial gene expression data (Iyer et al. 1999;http://genome-www.stanford.edu/serum) consisted of expression level ratios for 497 differentially expressed genes measured at 12 time points during the serum response. The ratios were log2-transformed, and the moving average transformationti = (ti − t i − 1)/2 was used to smoothen out spikes because such spikes often are artifacts and easily influence the template language used to describe the time profiles.
Feature Synthesis
To enable focus on relative changes in gene transcript levels over subintervals of the biological response, the expression data were transformed using three templates, “increase”, “decrease”, and “constant” over time intervals of at least three or four time points (see supplemental Table 11). The “increase/decrease” templates required a log2 ratio increase/decrease of at least 0.6 over at least three consecutive time points. The template “constant” required a maximum log2 ratio deviation from the mean value smaller than 0.2 over at least four consecutive time points. The parameter values were selected to optimize classification quality over several cross-validation trials in terms of average AUC over all classes and all trials (different cross-validation trials were produced by randomly dividing the data into different training and test sets). A different trial was run to produce the final cross-validation estimates in Table 4. Hence, reasonably realistic estimates were produced without using a separate test set for fine-tuning algorithmic parameters.
Training the Rule Model
The rule model was trained from examples of template-transformed expression profiles annotated with biological process using a Rough Set-based framework for rule induction. The concept of the method was originally introduced in Hvidsten et al. (2001). The present version used ROSETTA kernel version 1.0.1 and was further developed to meet the requirements of knowledge discovery in molecular biology. Rough Set theory (Pawlak 1991; Komorowski 1999; Skowron et al. 2002) constitutes a mathematical framework for inducing minimal decision rules (if-then rules) from examples. The general idea is to use Boolean reasoning to obtain minimal sets of features with the same discriminatory properties as the full set of features. The problem of finding such minimal sets, called reducts, is computationally very demanding and is known to be in the class of so-called NP-hard problems. We therefore used genetic algorithms to find approximate reducts that only preserve the discriminatory properties for a large fraction of the examples. Such approximate reducts may provide better classification rules as they tend to avoid the pitfalls of overtraining, that is, of being too specific and thus not being able to classify related but not identical cases. The reducts are used to generate if-then rules that associate a minimal number of characteristic features with a particular class. A large number of such rules put together constitutes a model capable of predicting the class(es) of an unknown gene based solely on its expression profile. Predictions are obtained by letting each rule matching the example to be classified cast a number of votes in favor of the biological process modeled by this rule. The number of votes is proportional to the support of the rule (i.e., the number of examples annotated with the process in the right-hand side of the rule that also has a time profile that matches the left-hand side of the rule). Classifications are selected among the processes that have a higher fraction of votes than an experimentally chosen selection threshold available for each class.
Validation of the Model
A 10-fold cross-validation over the training examples was used to assess the classification quality of the method. This corresponds to dividing the set of training examples randomly into 10 nonoverlapping equally sized subsets. One subset is used for testing, whereas the others are used to train a model. This is repeated 10 times so that each subset is a test set once and a part of the training set 9 times. The cross-validation performance estimates constitute the average classification quality of each submodel on the 10 test sets. In Table 4we report the area under the ROC curve (AUC) for each biological process. AUC is an estimate of the discriminatory power of the classifier independent of the threshold values. When unseen cases are classified, we need to choose fixed thresholds. Sensitivity and specificity for the “best” selection thresholds according to some optimization criterion are shown in Table 4. Using these thresholds, 84% of all annotations for the training examples could be classified correctly (sensitivity). Of all classifications, 49% were correct. Using a stricter criterion (higher selection thresholds) enabled us to increase the fraction of correct classifications to >90%, with a corresponding drop in sensitivity to 39%.
All computations were done using the ROSETTA toolkit kernel version 1.0.1 (Komorowski et al. 2002) for Rough Set analysis.
WEB SITE REFERENCES
http://bisance.citi2.fr/GENATLAS; GENATLAS.
http://genome-www.stanford.edu/serum; Web supplement to Iyer et al. (1999).
http://us.expasy.org/sprot; SWISS-PROT protein database.
http://www.geneontology.org; Gene Ontology Consortium.
http://www.lcb.uu.se/∼hvidsten/fibroblast; author Web site.
http://www.ncbi.nlm.nih.gov/LocusLink/index.html; LocusLink.
Acknowledgments
The contributions of Dag Kristian Rognlien, Vladimir Yankovski, Dyre Tjeldvoll, and Tor-Kristian Jenssen to the annotation process are greatly appreciated. We also thank Mette Langaas for valuable advice and assistance in statistical analysis.
The publication costs of this article were defrayed in part by payment of page charges. This article must therefore be hereby marked “advertisement” in accordance with 18 USC section 1734 solely to indicate this fact.
Footnotes
-
↵4 Corresponding authors.
-
E-MAIL astrid.lagreid@medisin.ntnu; FAX 47 73 59 86 13.
-
E-MAIL jan.komorowski{at}lcb.uu.se; FAX 46 18 471 66 98.
-
Article and publication are at http://www.genome.org/cgi/doi/10.1101/gr.1144503. Article published online before print in April 2003.
-
- Received June 5, 2002.
- Accepted January 28, 2003.
- Cold Spring Harbor Laboratory Press


