
Abstract
Core histone hyperacetylation, in particular of H4, is concentrated in the promoter–upstream regions of active genes and in certain cases is locuswide. Antibodies to hyperacetylated H4 were used to immunoprecipitate dinucleosomal chromatin derived from K562 human erythroleukemic cells by micrococcal nuclease digestion. The extracted DNA was made into a genomic library and was expected to contain sequences from genes active in K562 cells (an active, ‘aDNA’ library). Clones (180) were randomly selected from the library; 24 of 103 tested (23%) contained highly repeated sequences, as determined by their hybridization to total genomic DNA, and were not analyzed further. An additional 10 clones (6%) were shown to contain no insert DNA. The remaining 146 were sequenced and compared with the nucleic acid databases and in all six frames to the protein databases: Sixeen clones could be assigned to known genes, the majority of which (12) were tissue specific. All but 2 of these 16 corresponded to segments 5′ of the coding sequences, as expected if H4 acetylation is concentrated at promoter regions. Thirty-three clones (23%) displayed high sequence identity to cDNAs in the expressed sequence tag database (dbEST). Northern blots and reverse transcription (RT)—PCR were used to determine the proportion of clones representing sequences expressed in K562 cells: Although only 1 of 34 tested clones showed a band in Northern hybridization, RT–PCR demonstrated that at least 12 of 40 tested clones (30%) were present in the mRNA population. Because a further 8 of these 40 clones were identified as gene fragments by database sequence comparisons, it follows that about half of this subset of 40 clones is derived from genes. The aDNA library is thus very gene rich and not skewed toward the most highly expressed sequences, as in mRNA libraries. The aDNA library is also rich in promoters and could be a valuable source of such sequences, particularly those that lack CpG islands or other features that allow their specific selection.
A disadvantage of standard cDNA libraries as a source for the isolation of all gene sequences in the human genome is their biased representation toward the most highly expressed genes in the cell type used to prepare the library. This can be partially overcome by suppressing abundant messages, but in practice, high-throughput sequencing is the method of choice. When a message has been identified, it is necessary to isolate genomic clones for a full characterization and study of gene function, also a time consuming process. If it were possible to generate a genomic library that consisted of predominantly gene–promoter sequences, without any bias toward those that are more abundantly expressed, this would simplify the task. A biochemical feature of active genes is that the histones in their nucleosomes become acetylated: The distribution of acetylated histones in the genome is currently under active investigation using chromatin immunoprecipitation (CHIP) assays (Crane-Robinson and Wolffe 1998). Studies of the distribution of hyperacetylated histones H3 and H4 have shown that under certain circumstances the modification is concentrated in promoter regions (Kuo et al. 1998; Krebs et al. 1999; Parekh and Maniatis 1999) but in other cases can be locuswide (Hebbes et al. 1994). This situation has been exploited here by making a library from the DNA extracted from chromatin fragments immunoselected using antibodies recognizing highly acetylated histone H4 and also having some activity against the epitope ɛ-acetyl lysine. An initial intention was also to generate genomic sequences for possible use as STSs: Dinucleosomal chromatin fragments, of average length ∼400 bp, were therefore generated from the cell line K562 using micrococcal nuclease and used as input chromatin for immunoprecipitation. If hyperacetylated H4 is truly located only at transcriptionally active genes and genes poised for activation (Hebbes et al. 1992), the resulting genomic library would be a concentration of sequences “active” in the donor cell, what we have termed an aDNA library. Although such a library would be restricted to genomic sequences derived only from genes expressed in the source cells, clones from the aDNA library could be used directly with conventional phage genomic libraries to isolate long clones from the same gene. Here, we show that ∼50% of the clones in the aDNA library arise from gene sequences.
RESULTS
Dinucleosomal chromatin fragments were prepared by micrococcal nuclease (MNase) digestion of nuclei. Because active genes or parts of active genes can show preferential digestion by MNase, it was critical to select digestion conditions that generate chromatin fragments for immunoprecipitation that are not severely depleted in active genes but are properly representative of total genomic chromatin. The most appropriate conditions were found to be as follows: nuclei at a DNA concentration of 5 mg/ml with 300 units of MNase per mg of DNA, digesting for 2 min at 20°C.
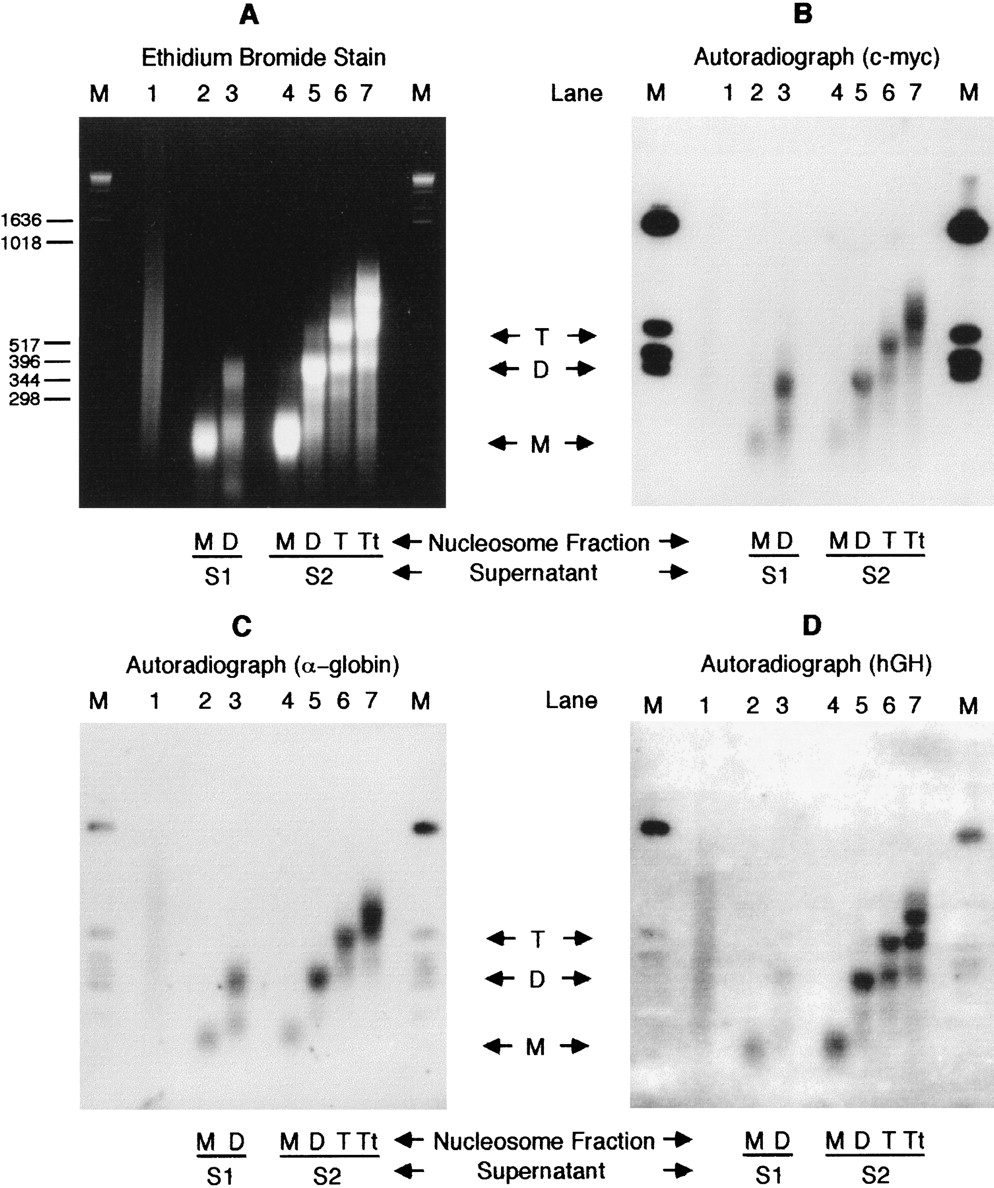
Following nuclease digestion, nuclei were pelleted, and the immediately released chromatin was taken (supernatant S1). The nuclei were then lysed at low ionic strength, and nuclear debris was pelleted by centrifugation to leave a second supernatant (S2). S1 and S2 were separately centrifuged in exponential sucrose gradients, and mono-, di-, tri-, and tetramer nucleosomal fractions were collected. DNA from these fractions was Southern transferred and probed with sequences from genes that are active and inactive in K562. Figure 1shows the results of probing with c-myc, a housekeeping gene in these cells, with α-globin, an active tissue-specific gene, and with human growth hormone, an inactive gene. Comparison of the autoradiograph with the ethidium stained gel shows that the dinucleosome fractions from both S1 and S2 contain a significant concentration of the two active genes: The dinucleosome fractions from both S1 and S2 were therefore pooled for the immunoprecipitation experiment and together denoted the “Input” chromatin.
(A) Ethidium bromide-stained 2% agarose gel of 10 μg DNA from sucrose gradient purified nucleosome oligomers in supernatants S1 and S2 generated by MNase digestion of K562 nuclei. Nuclei were digested at a concentration of 5 mg/ml using 300 units of MNase/mg DNA at 20°C for 2 min. (Lane 1) Sonicated genomic DNA; (lanes2,3) mono- and dinucleosomal DNA of S1, respectively; (lanes 4–7) mono-, di-, tri-, and tetranucleosomal DNA of S2, respectively. (B–D) Autoradiographs of Southern blot transfers of A hybridized with [α-32P]dCTP-labeled c-myc, α-globin, and hGH gene sequences, respectively. M denotes a DNA size marker.
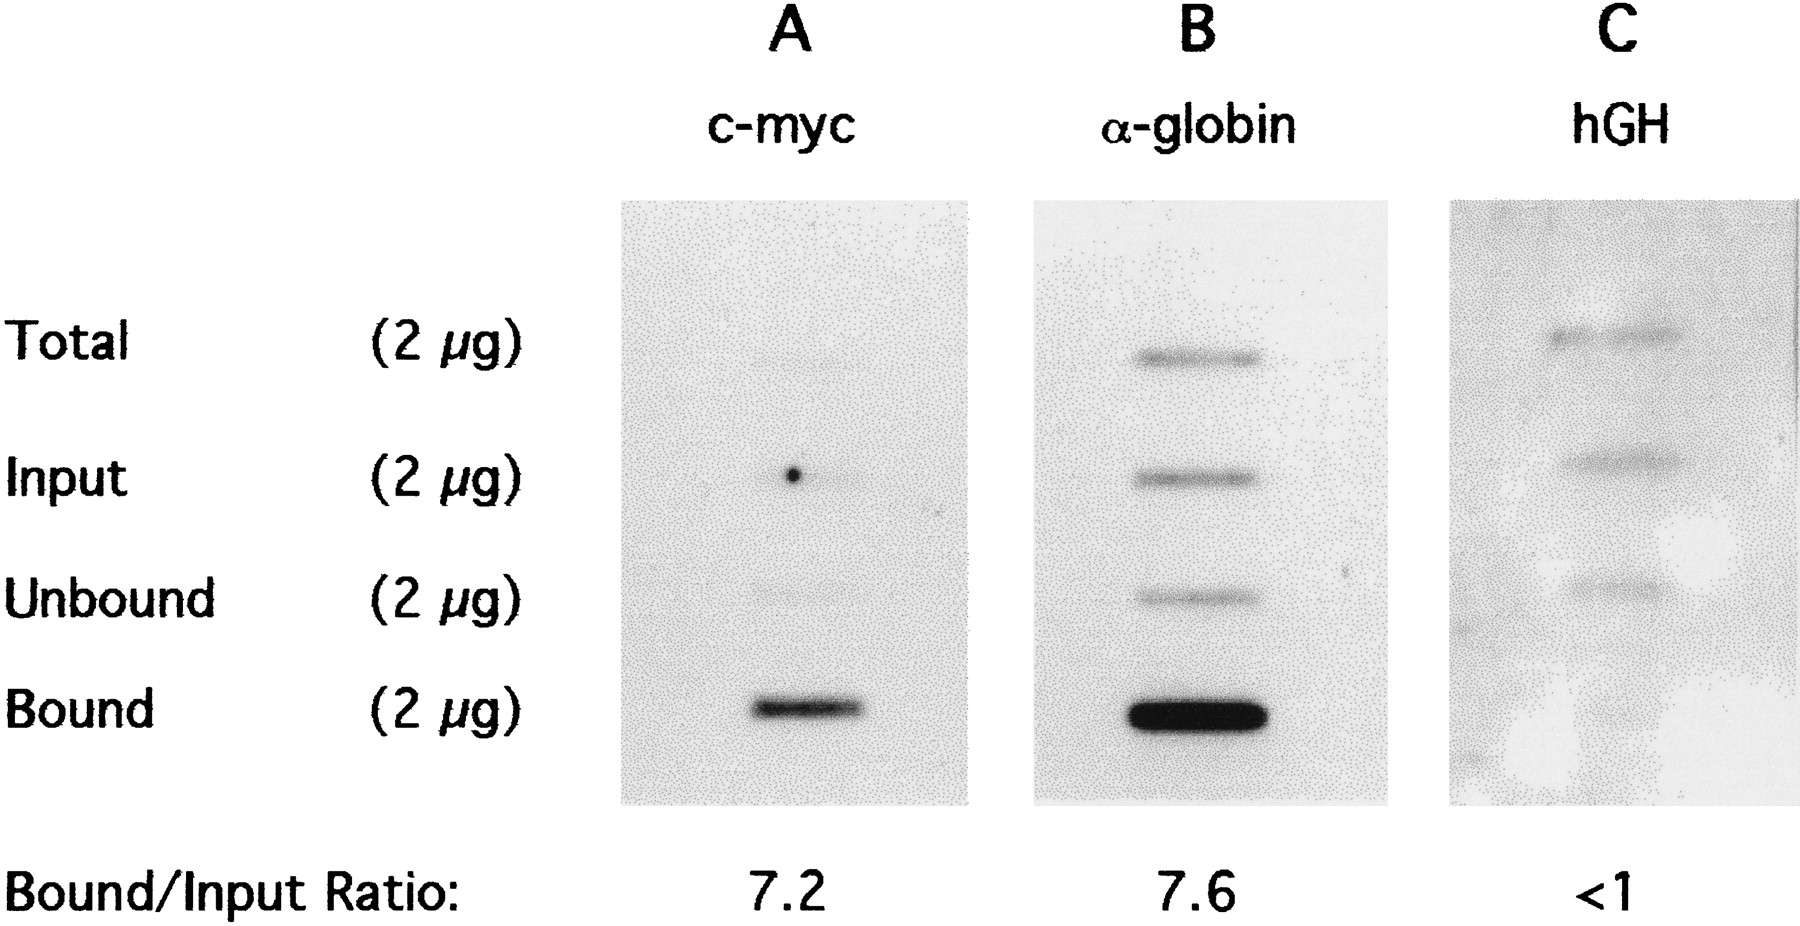
Immunoprecipitation was performed by adding 100 μg of affinity purified anti-acetylated H4–acetyl lysine antibody to 400 μg of the dinucleosomal chromatin and immobilizing immunocomplexes on protein A–Sepharose beads (Hebbes et al. 1994). After the beads were washed, antibody-Bound chromatin was released in SDS-containing buffer. Typically, 1.0%–1.5% of the Input chromatin DNA was recovered in the “Bound” fraction. DNA was extracted from Bound, “Unbound,” and Input chromatins. To check the selectivity of the immunoprecipitation, histones were recovered from all three fractions and separated using acetic acid–urea–Triton X-100 PAGE. A substantial enrichment in acetylated forms of histones H4, H3, and H2B was observed (data not shown), as reported previously for CHIP assays using these antibodies (Hebbes et al. 1988, 1992, 1994; Clayton et al. 1993). The efficacy of immunoprecipitation of active sequences was tested by slot–blot hybridization in which equal weights of DNA were immobilized, together with total human genomic DNA reduced to an average size of ∼600 bp by sonication. Figure 2 shows the results of hybridization to sequences of active and inactive genes. The enrichment of active genes in the Ab-Bound DNA is assessed from the ratio of the Bound to Input signals, which for the active genes is between seven and eight. For the inactive gene (hGH), there is a depletion of the Bound relative to the Input. Hybridization signals from the Input DNA are seen to be similar to that from Total DNA in all three cases, indicating that the Input dinucleosomes are properly representative of the total chromatin, that is, are not markedly enriched or depleted in the gene sequences being probed. An enrichment of seven- to eightfold is substantial, and therefore, a library of the Bound dinucleosomal DNA fragments was prepared.
Slot–blot hybridiation of DNA extracted from immunoprecipitated dinucleosomal chromatin fragments generated by MNase digestion of K562 nuclei. Two micrograms of sonicated genomic K562 DNA (Total), together with 2 μg of Input, Unbound, and antibody-Bound DNA were denatured and immobilized on nylon membranes. The slot–blot was probed with [α-32P]dCT-labeled c-myc, α-globin, and hGH gene sequences and visualized by autoradiography (A, B, and C, respectively). The ratio of Bound to Input hybridization signal (B/I) represents the enrichment achieved by the antibody.
Library Construction
The dinucleosomal DNA was dephosphorylated and treated with both T4 DNA polymerase and Klenow to achieve blunt ends (Satchwell and Travers 1989). Adapters (10 bp) were ligated onto the DNA, and the adapted DNA coprecipitated with λZap arms before ligation and in vitro packaging. The total number of phage was 8.3×10⁵ plaque-forming units (PFU). This number is ample for an analysis of individual clones to assess the representation of different types of DNA sequence in the aDNA library.
A random selection of 103 plaques were cored from a plate carrying ∼50,000. pBluescript phagemids were rescued by in vivo excision. Insert fragments were then released by EcoRI digestion and separated on agarose gels, allowing an estimation of insert sizes: The majority were in the range of 200–400 bp. In a separate experiment, a random selection of 77 plaques were taken from a plate of 2000 clones. Phagemid DNA was rescued as before, and insert DNA segments were sized by PCR amplification of bacterial colonies using the T7 and T3 vector primers, followed by separation on agarose gels. Combining the results of both experiments showed that a total of 170 clones (out of 180) contained insert DNA, 101 (61%) of which had an insert size between 300 bp and 500 bp, and 28 (17%) contained inserts between 200 bp and 300 bp.
The next step was to estimate the proportion of clones containing highly repetitive DNA, using hybridization to total genomic DNA. Hybridization to total genomic DNA has been estimated to detect sequences present in 50 or more copies in the genome (Shen and Maniatis 1980). Of the 103 clones tested in this manner, 24 showed significant hybridization signals and were rejected. Because 5 of these 103 clones had already been rejected as having no insert DNA, it follows that 74 (72%) of this set of clones contain low copy number sequences. In an alternative approach to defining the proportion of clones containing repeated sequences, a further set of ∼2000 plaques were transferred to a nylon membrane and hybridized with sonicated, labeled human genomic DNA. About 12% of plaques were found to show visible signals on autoradiography. This is about half the proportion found in the above Southern hybridizations, probably because the lower amount of DNA in a single plaque reduces the sensitivity of detection by hybridization. Because ∼40% of human genomic DNA is of moderate to high repetition, significant preferential rejection of such sequences has taken place in the immunoselection process.
Sequence Analysis
The 74 clones identified as low copy number were manually sequenced using T7 and T3 primers to sequence both strands. The second set of 77 randomly selected clones were sequenced by single-pass cycle sequencing using a T7 primer on an ABI 377 automated sequencer at the Human Genome Centre, Hinxton, Cambridge, UK. Five (7%) of this set were found to contain no insert following sequencing. A total of 74 + 72 = 146 sequenced clones were then analyzed further.
Identification of aDNA Clones Deriving from Transcribed Sequences
The sequences of the 146 aDNA library clones were compared with both the nucleic acid and protein databases, for the latter in all six frames. Table 1 gives the size and GenBank accession number for each sequenced clone together with the type of matching sequence found. Of the 74 clones deemed not to contain repeated sequences following hybridization to total genomic DNA, 4 were found to include Alu repeats and 5 to include L1 repeats, in each case quite short. Sixteen clones (11%, as of August 15, 1999) correspond to gene sequences defined previously, and these are listed separately in Table 2. Because the aDNA clones are comparatively short, we cannot exclude the possibility that some may derive from pseudogenes. The region of match for the large majority of these 16 clones is upstream of the coding sequences, that is, in a region expected to carry acetylated histones if the gene is active, poised, or was active previously.
Summary of aDNA Library Clone Sequence Comparison to Nucleic Acid Database Entries
| GenBank accession number | Clone I.D. | Insert size (bp) | Database | Sequence match (chromosome/gene/cDNA/repeat) |
| AF179028 | ALP2 | 321 | — | — |
| AF179029 | ALP3 | 403 | ALL | Alurepeat |
| AF179030 | ALP5 | 334 | HTGS | 22q11.2 |
| AF179031 | ALP6 | 276 | ALL | L1 repeat |
| AF179032 | ALP7 | 322 | — | CpG island |
| AF179033 | ALP10 | 456 | nr/EST | gene/cDNA/CpG island |
| AF179034 | ALP11 | 212 | ALL | L1 repeat |
| AF179035 | ALP12 | 355 | — | — |
| AF179036 | ALP13 | 368 | EST | cDNA |
| AF179037 | ALP14 | 358 | — | — |
| AF179038 | ALP15 | 308 | — | — |
| AF179039 | ALP17 | 465 | nr | 17 |
| AF179040 | ALP19 | 341 | — | — |
| AF179041 | ALP20 | 272 | — | — |
| AF179042 | ALP21 | 356 | EST | cDNA |
| AF179043 | ALP22 | 353 | — | — |
| AF179044 | ALP24f | >600 | HTGS | — |
| AF179045 | ALP24r | |||
| AF179046 | ALP25 | 304 | — | — |
| AF179047 | ALP27 | >600 | nr | gene |
| AF179048 | ALP28f | >600 | ALL | satellite repeat |
| AF179049 | ALP28r | |||
| AF179050 | ALP30 | 361 | HTGS/ALL | 6/Alu repeat |
| AF179051 | ALP31 | 321 | HTGS/EST | 7q33-35/cDNA/CpG island |
| AF179052 | ALP32 | 273 | ALL | MER repeat |
| AF179053 | ALP33 | 432 | — | — |
| AF179054 | ALP34 | 302 | — | — |
| AF179055 | ALP35f | >500 | nr | gene/CpG island |
| AF179056 | ALP35r | |||
| AF179057 | ALP36 | 325 | ALL | Alu repeat |
| AF179058 | ALP38 | 299 | ALL | L1 repeat |
| AF179059 | ALP39 | 239 | EST/STS | 2,1103.7 cR from pTEL/cDNA/STS |
| AF179060 | ALP41 | 361 | EST/HTGS | cDNA |
| AF179061 | ALP43 | 563 | ALL | retrovirus |
| AF179062 | ALP44 | 637 | nr/ALL | 22q11.2/MER repeat |
| AF179063 | ALP45 | 370 | — | — |
| AF179064 | ALP46 | 320 | nr | CpG island |
| AF179065 | ALP47r | >600 | — | — |
| AF179066 | ALP49 | 211 | — | — |
| AF179067 | ALP50 | 339 | — | — |
| AF179068 | ALP51f | >500 | — | CpG island |
| AF179069 | ALP51r | |||
| AF179070 | ALP53 | 118 | nr/EST | 4q31 & 19:13.1–13.3/Sst1 repeat/cDNA |
| AF179071 | ALP55 | 534 | — | — |
| AF179072 | ALP58 | 156 | — | — |
| AF179073 | ALP59 | 327 | HTGS/ALL | L1 repeat |
| AF179074 | ALP60 | 372 | nr | 6q21–22/CpG island |
| AF179075 | ALP61 | 441 | ALL | L1 repeat/CpG island |
| AF179076 | ALP63 | 348 | ALL | Alurepeat |
| AF179077 | ALP67f | >600 | nr/HTGS | gene/CpG island |
| AF179078 | ALP67r | |||
| AF179079 | ALP68 | 316 | — | — |
| AF179080 | ALP69 | 483 | nr | 5p15.2 |
| AF179081 | ALP71 | 623 | EST | cDNA/CpG island |
| AF179082 | ALP72 | 304 | — | — |
| AF179083 | ALP74 | 317 | nr/EST | gene/cDNA/CpG island |
| AF179084 | ALP75 | 583 | ALL | L1 repeat/cDNA/CpG island |
| AF179085 | ALP77 | 373 | HTGS/ALL | 5/Alurepeat |
| AF179086 | ALP78 | 392 | — | — |
| AF179087 | ALP79 | 310 | — | — |
| AF179088 | ALP80 | 465 | EST/HTGS | cDNA |
| AF179089 | ALP82 | 329 | EST | cDNA/CpG island |
| AF179090 | ALP83f | >500 | nr/EST | 6p21.21–21.31/ |
| AF179091 | ALP83r | cDNA/CpG island | ||
| AF179092 | ALP84 | 355 | ALL | Alurepeat |
| AF179093 | ALP86 | 332 | HTGS | 6 |
| AF179094 | ALp87 | 212 | HTGS | — |
| AF179095 | ALP88 | 512 | — | — |
| AF179096 | ALP89f | >400 | — | — |
| AF179097 | ALP89r | |||
| AF179098 | ALP90f | >300 | ALL | Alurepeat |
| AF179099 | ALP91 | 348 | — | — |
| AF179100 | ALP93 | 307 | ALL | MER/Alurepeat |
| AF179101 | ALP94 | 317 | nr | CpG island |
| AF179102 | ALP95 | 393 | HTGS | 8p11/CpG island |
| AF179103 | ALP96 | 370 | EST | cDNA |
| AF179104 | ALP98 | 346 | nr/HTGS | 5q/CpG island |
| AF179105 | ALP99 | 307 | — | — |
| AF179106 | ALP100 | 262 | nr/EST | Iq24/cDNA |
| AF179107 | ALP101 | 374 | — | — |
| AF179108 | ALP103 | 331 | — | — |
| AF179109 | ALP104 | 368 | nr | 22q11/gene/CpG island |
| AF179110 | ALP105 | 424 | ALL | Alu & other repeats |
| AF179111 | ALP106 | 345 | nr/gss | Sau3/satellite repeat |
| AF179112 | ALP107 | 326 | nr/EST/gss | gene/cDNA |
| AF179113 | ALP108 | 285 | HTGS/ALL | MER repeat |
| AF179114 | ALP109 | 350 | — | — |
| AF179115 | ALP110 | 352 | nr | 7p15–21 |
| AF179116 | ALP111 | 259 | ALL | Alurepeat |
| AF179117 | ALP112 | 482 | nr/EST/HTGS | 12p13 and 14 gene/cDNA/CpG island |
| AF179118 | ALP113 | 361 | EST | cDNA |
| AF179119 | ALP114 | 343 | nr | gene |
| AF179120 | ALP117 | 221 | nr | 7q31 |
| AF179121 | ALP118 | 294 | EST/ALL | cDNA/L1 repeat |
| AF179122 | ALP119 | 358 | nr/EST/ALL | 9/cDNA/Alurepeat |
| AF179123 | ALP120 | 306 | nr/EST | 22q11.2/gene/cDNA |
| AF179124 | ALP121 | 318 | — | CpG island |
| AF179125 | ALP122 | 709 | nr/EST | 22q11.2/cDNA/CpG island |
| AF179126 | ALP123 | 326 | nr | 17 |
| AF179127 | ALP124 | 257 | — | — |
| AF179128 | ALP125 | 310 | — | — |
| AF179129 | ALP126 | 273 | ALL | Alurepeat |
| AF179130 | ALP127 | 480 | EST/ALL | cDNA/L1 repeat |
| AF179131 | ALP128 | 278 | ALL | THE/THR repeat |
| AF179132 | ALP129 | 318 | nr/HTGS | 21p11.2/gene/CpG island |
| AF179133 | ALP130 | 293 | — | — |
| AF179134 | ALP131 | 423 | — | — |
| AF179135 | ALP133 | 329 | nr/EST | 4q35-qter/cDNA CpG island/ |
| AF179136 | ALP135 | 482 | nr/EST | cDNA/CpG island |
| AF179137 | ALP136 | 328 | ALL | MER repeat |
| AF179138 | ALP137 | 623 | HTGS/ALL | 6/MSTA B repeat |
| AF179139 | ALP138 | 417 | — | — |
| AF179140 | ALP139 | 628 | ALL | Alurepeat/CpG island |
| AF179141 | ALP140 | 417 | nr/EST | cDNA/CpG island/gene |
| AF179142 | ALP141 | 425 | — | — |
| AF179143 | ALP142 | 540 | EST/HTGS | cDNA |
| AF179144 | ALP143 | 410 | nr/EST | gene/cDNA |
| AF179145 | ALP144 | 400 | ALL | L1 repeat |
| AF179146 | ALP145 | 636 | nr | 5q |
| AF179147 | ALP146 | 407 | HTGS/ALL | 5/Alurepeat |
| AF179148 | ALP147 | 302 | EST/ALL | cDNA/MER repeat |
| AF179149 | ALP148 | 573 | nr/HTGS | 22 |
| AF179150 | ALP149 | 482 | ALL | Alurepeat |
| AF179151 | ALP150 | 440 | HTGS | — |
| AF179152 | ALP151 | 529 | HTGS/EST | 6/cDNA |
| AF179153 | ALP153 | 445 | — | cDNA |
| AF179154 | ALP154 | 409 | ALL | Alurepeat |
| AF179155 | ALP155 | 362 | — | — |
| AF179156 | ALP156 | 300 | EST | cDNA/CpG island |
| AF179157 | ALP157 | 477 | nr/HTGS | 16/7q11.23/19q13.2/CpG island |
| AF179158 | ALP158 | 640 | EST/ALL | LTR repeat/cDNA |
| AF179159 | ALP159 | 470 | nr/EST | 17, 394.1 cR from pTEL/gene/cDNA |
| AF179160 | ALP160 | 340 | HTGS | 21 |
| AF179161 | ALP161 | 375 | nr | retrovirus |
| AF179162 | ALP162 | 354 | nr | gene |
| AF179163 | ALP163 | 347 | ALL | CA dinucleotide repeat |
| AF179164 | ALP164 | 351 | — | — |
| AF179165 | ALP165 | 421 | — | — |
| AF179166 | ALP166 | 336 | nr/ALL | 19/MER/Alurepeat |
| AF179167 | ALP167 | 399 | — | — |
| AF179168 | ALP168 | 354 | nr/EST | gene/cDNA |
| AF179169 | ALP169 | 385 | — | — |
| AF179170 | ALP170 | 257 | — | — |
| AF179171 | ALP171 | 349 | nr | retrovirus |
| AF179172 | ALP172 | 332 | ALL | Alurepeat |
| AF179173 | ALP173 | 184 | ALL | L1 repeat |
| AF179174 | ALP174 | 163 | ALL | L2 repeat |
| AF179175 | ALP175 | 366 | ALL | Alurepeat |
| AF179176 | ALP176 | 191 | HTGS | 15q26.1 |
| AF179177 | ALP177 | 198 | nr | 17 |
| AF179178 | ALP178 | 226 | — | — |
| AF179179 | ALP179 | 253 | — | — |
| AF179180 | ALP180 | 194 | nr | 17 |
[i] Each sequence was compared with those of the nonredundant (nr) nucleic acid database together with the EST, STS, high-throughput genomic sequence (HTGS), and genome survey sequence (gss) databases. ALL denotes clones that displayed high sequence identity with at least one entry of each database employed. CpG islands were identified by computational analysis.
aDNA Library Clones that Displayed High Sequence Identity with cDNA or Genomic DNA (gDNA) of Previously Defined Gene Sequences
| Clone I.D. | Gene match | Region of match | Database entry | Chromosomal location of match | Gene type | Multigene family |
| ALP10 | BAT3 | 5′ upstream of CDS | gDNA | 6p21.3 | HLA-B-type transcript 3, Class III MHC | yes |
| ALP27 | Utrophin | 5′ to middle of CDS | cDNA | 6p24 | Dystrophin related structural protein | — |
| ALP35 | P0071 | 5′ upstream of CDS | cDNA | — | Armadillo junctional plaque protein | yes |
| ALP74 | FREAC4 | 5′ upstream of CDS | gDNA/cDNA | 5q12–13 | Transcription regulator | yes |
| ALP104 | ZNF74 | 5′ upstream of CDS | gDNA | 22q11.2 | Zinc finger RNA binding protein | — |
| ALP107 | FK506 | 5′ upstream of CDS | cDNA | — | Papamycin binding protein | yes |
| ALP112 | CHL1 | 5′ upstream of CDS | cDNA | 12p13, p11 | Putative helicase | yes |
| ALP114 | MET | 5′ upstream of CDS | gDNA | 9q34 | Unknown function | no |
| ALP120 | Immunoglobulin | 5′ upstream of CDS | gDNA | 22q11.2 | Immunoglobulin light chain | yes |
| ALP129 | STCH | 5′ upstream of CDS | gDNA | 21p11.2 | Microsomal stress 70 protein ATPase core | yes |
| ALP140 | QM | 5′ upstream of CDS | gDNA | Xq28 | Unspecified | yes |
| ALP143 | SelP | 5′ upstream of CDS | gDNA | — | Selenoprotein P, unknown function | — |
| ALP157 | WS bHLH | 5′ upstream of CDS | gDNA | 7q11.23 | Basic-helix-loop-helix leucine zipper | yes |
| ALP159 | Kinase A | 3′ downstream of CDS | cDNA | 17; 394.1 cR from pTEL | Anchor protein | yes |
| ALP162 | KIAA0702 | 5′ upstream of CDS | cDNA | — | Unknown function | — |
| ALP168 | MAD3 | 5′ upstream of CDS | cDNA | — | Transcriptional repressor | yes |
[i] Gene name, type, and chromosomal location (if known) of the match are indicated, as is the location of high sequence identity within each gene. CDS denotes coding sequence. All but two matches were located within the 5′ region of each gene.
Because acetylated H4 histones are expected to be concentrated at active genes, the most important question to be answered regarding the aDNA library is the proportion of clones that truly derive from genes active in K562 cells. Library inserts were therefore used to analyze the mRNA population of K562 cells. Highly expressed genes might be detected by Northern analysis, but genes expressed at low level require the sensitivity of RT–PCR amplification. aDNA clones derived from promoter or intronic sequences that carried acetylated histones would not of course be present in the mRNA population: These approaches therefore underestimate the number of clones derived from active genes.
Northern Analysis
A random selection of 34 clones from the 146 sequenced clones, none of which included highly repeated DNA, was chosen for Northern analysis. It has been estimated that mRNA accounting for ∼0.01% of the total population can be detected by Northern blots using 10 μg of total RNA per lane (Brown 1994). Only one insert, ALP7, showed a significant hybridization signal (at ∼3 kb; data not shown). The aDNA library is thus not dominated by the DNA of highly transcribed genes, as might be the case if the density of acetylated histone H4 on a gene were directly related to the frequency of transcription of the gene.
RT–PCR Amplifications
Forty clones from the aDNA library were chosen for this analysis (see Table 3), only two of which displayed sequence matches with cDNA fragments in the EST database at the time of the experiments. The remaining 38 were chosen from those showing no significant matches to sequences in any of the nucleic acid databases at that time. Computer analyses of the cloned sequences using GRAIL, GENSCAN, Fgeneh, polyAH, and CpG programs were used to direct the choice of further clones to test by RT–PCR. Eleven clones that were predicted to contain exon sequences were chosen and a further seven because they contained predicted poly(A) addition sites (possible 3′ gene fragments). Nine were chosen as potential 5′ sequences because they included predicted CpG island regions. Because there was some overlap of these three predicted features among these clones, they represent a total of 20 clones (see Table 3, column 2). The remaining 18 were randomly chosen from clones not predicted to contain any of the above three features.
Data for the 40 Clones Chosen for RT–PCR Analysis
| Clone I.D. | Computational sequence analysis predictions | RT–PCR oligo(dT) primed cDNA | Chromosome No. | RH map position/chromosome size | GenBank matches (Aug. 1999) |
| ALP5 | ✔ | 22 | 23.8/184.1 | — | |
| ALP12 | — | — | 1 | / | — |
| ALP14 | exon, CpG | — | × | / | — |
| ALP15 | ✔ | 8 | 503.9/565.8 | — | |
| ALP27 | ✔ | 16 | / | gene | |
| ALP31 | CpG | M | / | / | EST |
| ALP32 | poly(A) | ✔ | / | / | — |
| ALP33 | — | M | 10 | 499.6/556.9 | — |
| ALP35 | exon, CpG | M | / | / | gene |
| ALP44 | I | 22 | 45.3/184.1 | — | |
| ALP46 | CpG | M | × | 185.2/817.9 | — |
| ALP55 | poly(A) | M | 19 | 270.3/306.2 | — |
| ALP60 | poly(A), CpG | ✔ | 6 | 465.7/636.4 | — |
| ALP71 | exon, CpG | ✔ | 7 | 423.4/698.7 | EST |
| ALP74 | CpG | M | 5 | 341.7/664.1 | EST/gene |
| ALP79 | — | ✔ | 16 | / | — |
| ALP80 | poly(A) | ✔ | 9 | 361.4/438.0 | EST |
| ALP86 | — | I | 6 | 402.3/636.4 | — |
| ALP88 | exon, poly(A) | M* | 6 | 596.8/636.4 | — |
| ALP91 | — | M* | 18 | 20.8/489.3 | — |
| ALP96 | exon | — | 16 | 38.0/508.0 | EST |
| ALP105 | poly(A) | I | 11 | 127.9/442.8 | — |
| ALP107 | — | M* | 1 | 779.4/817.9 | EST/gene |
| ALP110 | — | I | 7 | 111.5/698.7 | — |
| ALP120 | exon | — | 22 | 45.3/184.1 | EST/gene |
| ALP121 | exon, CpG | — | 18 | 399.2/489.3 | — |
| ALP130 | — | — | 10 | 465.6/556.9 | — |
| ALP131 | exon | — | 12 | 397.6/508.4 | — |
| ALP141 | poly(A) | I | 11 | 125.9/442.8 | — |
| ALP143 | — | 5 | / | EST/gene | |
| ALP145 | — | 15 | 346.6/347.9 | — | |
| ALP148 | ✔ | 16 | 370.0/508.0 | — | |
| ALP155 | — | ✔ | 10 | 108.1/556.9 | — |
| ALP157 | exon, CpG | ✔ | / | / | — |
| ALP160 | — | — | / | / | — |
| ALP163 | exon | — | 13 | 257.2/329.7 | — |
| ALP168 | exon | M | / | / | EST/gene |
| ALP169 | ✔ | 22 | 49.5/184.1 | — | |
| ALP176 | — | 15 | 311.5/347.9 | — | |
| ALP178 | — | 1* (H) | / | — |
[i] (Column 1) Clone I.D. (Column 2) Computational analysis results. (Column 3) RT–PCR amplifications from oligo(dT) primed cDNA: (✔) A single correctly sized PCR amplicon was obtained; (—) no amplicon was obtained; (M and I) clones displaying Multiple PCR amplicons and a single incorrectly sized amplicon, respectively; (*) Amplification of a low yield correctly sized PCR amplicon. (Column 4) PCR-based chromosomal assignment of selected library clones using the Corriel somatic cell hybrid mapping panel (no. 2): (/) Clones for which primer pairs were rejected during prescreen assays; (×) clones for which primer pairs were rejected during chromosomal assignment assays; (H) high yield amplification of other chromosomal templates (hamster/mouse); (1*) highest yield amplicon from chromosome 1. (Column 5) Results of RH mapping of clones along their assigned chromosomes. The scale is centiRays (cR3000) with the zero at the p-telomere. (Column 6) Results of database searches.
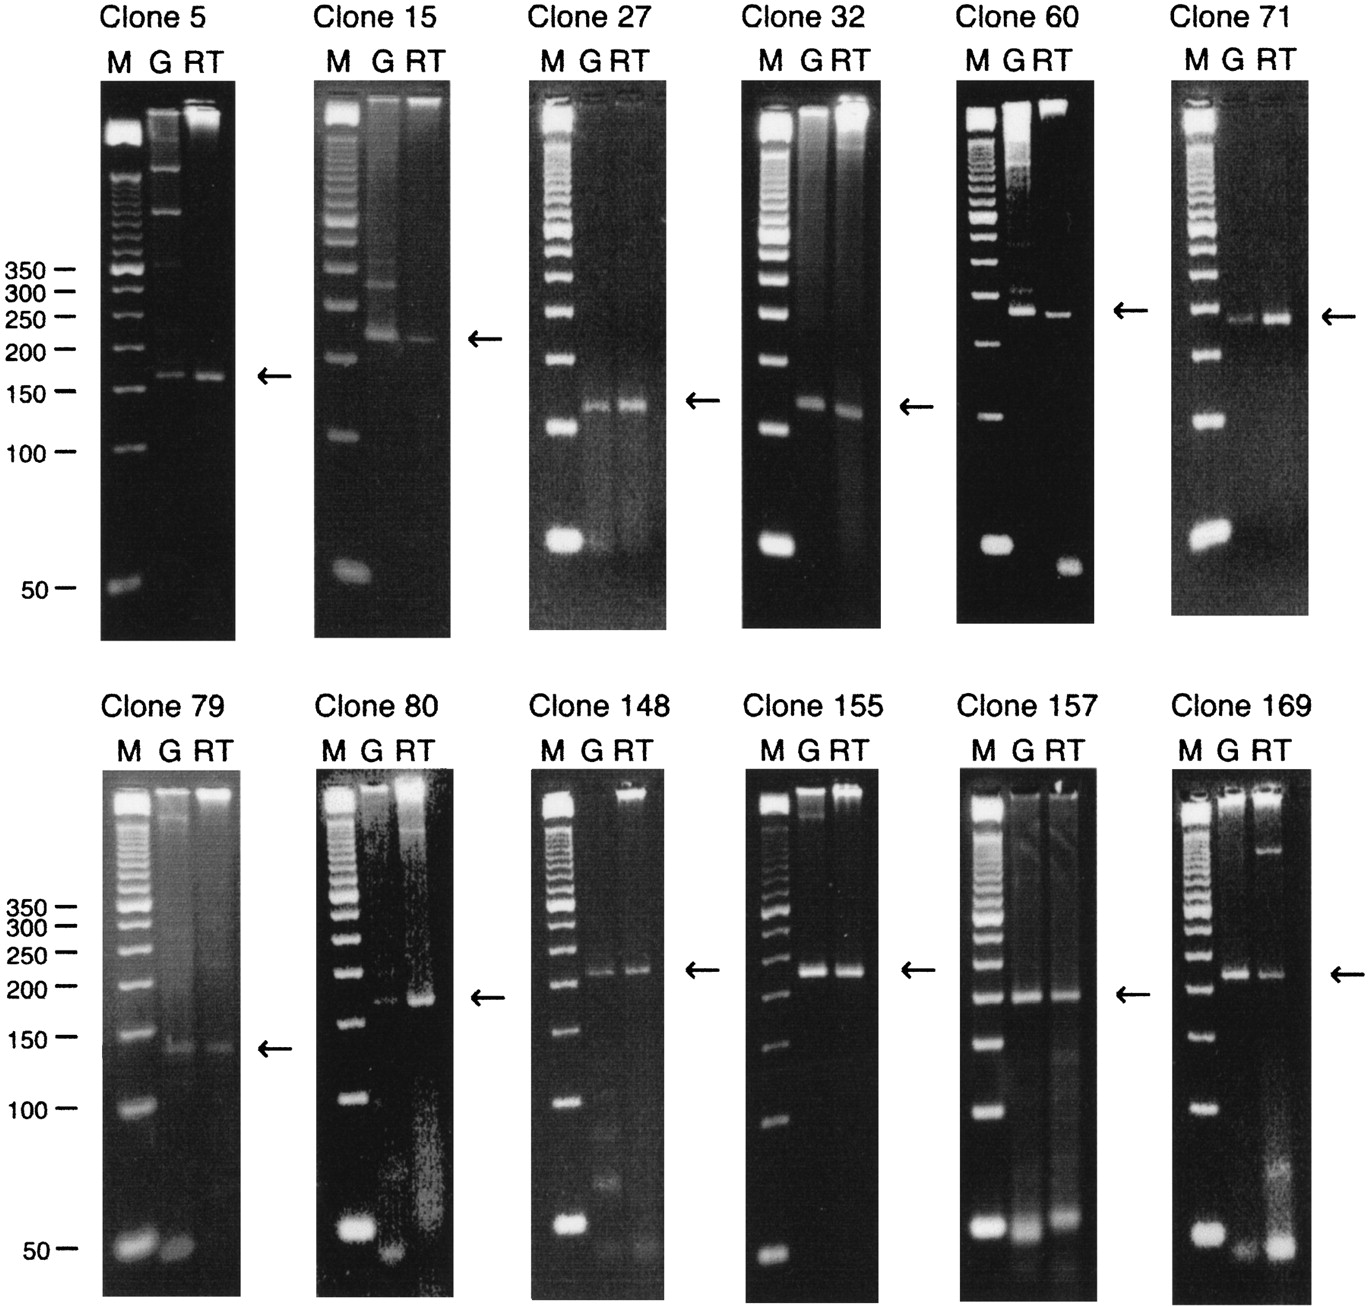
Total cytoplasmic RNA from K562 cells was used as template in RT–PCR amplifications. First strand cDNA synthesis was first performed using oligo(dT) priming, but because the likely location of acetylated histones is at the 5′ end of active genes, first strand synthesis was also separately performed using random hexamer primers. Primer pairs for PCR amplification of first strand cDNA for the 40 chosen clones were designed to give products ranging from 100 bp to 230 bp and annealing temperatures were optimized. Amplification from three different templates was separately carried out for each primer pair: genomic DNA, first strand cDNA from oligo(dT) priming, and first strand cDNA from random priming. In addition, a mock RT reaction was carried out for both the oligo-d(T) and random primed reactions omitting the RT enzyme, to check for possible carryover of genomic DNA. In no case was an amplicon obtained when the RT enzyme was omitted. In some cases an amplified product was obtained from both first strand cDNAs but that from the oligo(dT) primed reactions was always more intense than from the random primed: The random primed material was therefore not used further. Figure 3 compares the amplification products from genomic DNA and oligo(dT) primed cDNA for 12 of the 40 selected aDNA clones. These 12 gave essentially single and correctly sized amplification products from both templates: All 12 aDNA clones are therefore derived from sequences transcribed in K562 cells and do not span splice junctions. Two of these, ALP27 and ALP71, represent sequences that match known cDNA fragments in the GenBank nonredundant nucleic acid and EST databases, respectively, at the time of the experiments but it was not known whether these were expressed in K562 cells. ALP80 has since been shown to match a new entry to the expressed sequence tag database (dbEST). A further 15 of the 40 clones gave correctly sized amplification products from the genomic DNA template but yielded incorrectly sized single products or multiple products from the cDNA template. Of these 15 clones, 5 display high identity to gene sequences in the nonredundant nucleic acid and EST databases (ALP31, ALP35, ALP74, ALP107, and ALP168). Failure to generate a correctly sized product from the cDNA template might be due to one (or both) primer being located in introns; so the RT–PCR experiment must be regarded as inconclusive for these 15 clones. For the remaining 13 clones, all the primer pairs but one generated the correctly sized products with genomic DNA as template but yielded no product at all with the cDNA template. Of these 13, two clones (ALP120 and ALP143) correspond to known gene sequences (Table 2). The primer pair for the final clone (ALP96) yielded no products from either genomic or cDNA templates, although this clone displays high sequence identity to a cDNA fragment in dbEST.
Four percent agarose–TBE gel electrophoresis of PCR amplicons generated using oligo(dT) primed reverse transcribed total cytoplasmic RNA (RT) and genomic DNA (G) as template. Nucleic acids were extracted from K562 cells. PCR was performed using library clone specific primers. M denotes a 50n-bp DNA size marker. All clones show the presence of a single PCR amplicon of the expected size using both DNA templates. (←) The expected amplicon size.
Overall therefore, we find that 12 of 40 (30%) of this selection of aDNA clones are derived from sequences that are actively transcribed in K562 cells. This figure of 30% is much higher than would be observed if the library were a random collection of dinucleosomes from the human genome. Of these 12, 9 clones (ALP5, ALP15, ALP32, ALP60, ALP79, ALP148, ALP155, ALP157, and ALP169) are not currently present in any nucleic acid or protein database and thus represent newly defined gene sequences, transcribed in K562 cells. It is noteworthy that 7of these 9 expressed clones were among the 18 selected for testing by virtue of their lack of computer predicted gene features; thus, 7 of 18 clones (39%) having no gene features turned out to be from expressed genes. These results indicate that the aDNA library is rich in expressed sequences.
Chromosomal Mapping
To decide whether the aDNA library exhibited any strong bias toward particular chromosomes or parts thereof and to investigate the use of library clones as STSs, we attempted to map the 40 clones to individual chromosomes. The Corriel somatic cell hybrid mapping panel (no. 2) was used, which consists of 24 human–mouse monochromosomal hybrids representing human chromosomes 1–22, X, and Y in mouse cells. All primer pairs were tested for their ability to generate amplicons from human but not mouse or hamster genomic DNA before use with the hybrid panel DNA. Seven of the 40 primer pairs (ALP31, ALP32, ALP35, ALP46, ALP157, ALP160, and ALP168) were rejected at this stage because, despite varying PCR conditions, they either did not yield a clear simple amplicon from human DNA or they readily amplified mouse or hamster genomic DNA. The ALP14 primer pair was rejected following chromosomal assignment assays because it yielded an abundant product from total human genomic DNA but nothing from any of the hybrid cells. It seems that the segment of human DNA that includes clone ALP14 is not included in any of the hybrid cells. The remaining 32 primer pairs gave successful chromosomal assignments.
Table 3 (column 4) gives the chromosomal assignments: It is apparent that there is no strong preference for any individual chromosome or chromosomes among the 32 tested clones. Because K562 cells are a chronic myeloid lineage derived from leukemic cells of a female patient, they do not carry a Y chromosome. Four clones derive from each of chromosomes 1, 16, and 22: Chromosomes 1 and 22 are known to be gene rich. Chromosomes 4 and 21 have no clones assigned to them and are known to be gene poor. But with a total of only 32 assignments, no statistical significance attaches to this chromosome distribution.
More detailed chromosomal mapping was performed for these 32 clones using radiation hybrid (RH) mapping with duplicate assays against the reduced Genebridge 4 RH panel. Four of these 32 primer pairs were rejected because of ambiguous PCR amplifications with the RH panel. Chromosomal positioning data were thus obtained for 28 of the 40 clones tested for expression, and these are given in column 5 of Table 3 as map position together with chromosome length in centiRays.
DISCUSSION
The aDNA library was made by selection with antibodies that primarily recognize highly acetylated histone H4 but also have some capability of recognizing other acetylated proteins (e.g., GATA1; Boyes et al. 1998; Huang et al. 1999) by virtue of additional activity against the simple epitope ɛ-acetyl lysine (Hebbes et al. 1989). However, because the dinucleosomal fragments that provided the DNA for the library were purified on sucrose gradients containing 150 mm NaCl, the content of acetylated transcription factors is expected to be very low. Library clones should thus be derived from DNA in nucleosomes carrying highly acetylated histone H4, and such nucleosomes are expected to be located at active gene sequences.
Most of the 16 clones corresponding to known genes (Table 2) code for tissue-specific genes; however, analysis of many more clones will be necessary to decide whether the aDNA library is biased toward tissue-specific genes. Of the 16 known genes (Table 2), it is striking that all but two clones have been assigned to the 5′ region upstream of the coding sequence, that is, precisely where H4 acetylation is expected. Eight of these 16 clones were tested for their presence in the mRNA population by RT–PCR but only two (ALP27 and ALP157) generated the expected single, correctly sized amplicon (Fig.3). That only two were found in the mRNA population presumably results from the fact that of these eight tested clones, database entries indicate that seven correspond to sequences upstream of the transcribed sequences and only ALP27 to coding sequences (see Table 2). It is unclear why ALP157 was found in the mRNA population, because its match is with an upstream sequence.
In terms of the limited subset of 40 clones, the finding from RT–PCR that 9 come from previously unknown genes suggests that aDNA libraries of this sort could be an effective source of new gene sequences. In addition to the 12 expressed clones detected by RT–PCR and 1 by Northern analysis, a further 8 of this 40 displayed high sequence identity to gene sequences in the nucleic acid databases (Table 3). Thus, a total of 21 of 41 clones (51%) that were tested in detail come from genes. This figure is worth contrasting with the proportion of clones in a random dinucleosomal library that would be expected to be derived from gene sequences. If one assumes the human genome contains 80×103 genes of average length of 5 kb (including introns), of which 50% are active in K562 cells and carry acetylated nucleosomes over the whole of their length, then a random library of short genomic fragments is expected to contain 7% of clones derived from acetylated chromatin. This figure is very probably a large overestimate because it is unlikely that all introns and exons of active genes carry hyperacetylated histone H4. In this context it is important to recall that the antibody-selected dinucleosomes used for the construction of the aDNA library represented only ∼1%–1.5% of the input chromatin.
With only 40 clones analyzed in detail, the statistical significance of finding half of them derived from genes is not high, but this limited data set does indicate that the anti acetylated H4 histone antibody preferentially selects gene-derived chromatin fragments. The aDNA library could therefore be a ready source of new gene sequences. However, only short genomic fragments result from such a procedure, and although aDNA clones derived from genes could be used in conventional screening of large insert human genomic libraries, this is a laborious process. An aDNA library might be constructed from longer DNA fragments with the aim of isolating more extended segments of active genes. Initial attempts to do this with chromatin fragments of an average size of ∼2 kb resulted in a large proportion (15%–20%) of the Input DNA becoming immobilized on the protein A–agarose beads, an amount well in excess of the genuinely hyperacetylated chromatin. This is probably due to the preferential and nonspecific binding of long chromatin to protein A–agarose beads, a well-documented phenomenon (Hebbes et al. 1988; Johnson et al. 1998).
As expected from the concentration of histone acetylation in promoter regions, the aDNA library is much enriched in such sequences, and this is probably its principle merit. Promoter regions containing particular features such as CpG islands can sometimes be preferentially selected, and libraries can be made from them (e.g., Cross et al. 1994), but it is difficult to select or identify promoter regions lacking such special features. aDNA libraries of the type described here can be a valuable source of promoters that lack CpG islands or other specific features.
METHODS
Preparation of Dinucleosomes
Human K562 cells were harvested by centrifugation at 150gfor 10 min at 4°C. Cell pellets were resuspended at ∼2×10⁸ cells/ml in 250 mm sucrose, 10 mm Tris-HCl (pH 7.4), 10 mm sodium butyrate, 4 mm MgCl2, 0.1 mm PMSF, 0.1 mmbenzamidine, and 0.1% Triton X-100 and lysed with 15 strokes of a Dounce homogenizer. Nuclei were pelleted by centrifugation, resuspended in the above buffer omitting Triton X-100 and purified by centrifugation through 6 ml of 30% (wt/vol) sucrose cushions at 2400g for 10 min at 4°C. Nuclei (∼25 mg of DNA) were resuspended in digestion buffer (10 mm NaCl, 10 mmTris-HCl at pH 7.4, 10 mm sodium butyrate, 3 mmMgCl2, 1 mm CaCl2, 0.1 mm PMSF, 0.1 mm benzamidine, 0.15 mm spermine, and 0.5 mm spermidine) to a final concentration of 5 mg/ml DNA. Varying amounts of MNase were added, and incubation was performed at the required temperature; reactions were terminated by addition of Na3–EDTA to 5 mm. Nuclei were pelleted, and the supernatant (S1) retained. Pellets were resuspended in lysis buffer (10 mm Tris-HCl at pH 7.5, 10 mm sodium butyrate, 0.25 mm Na3–EDTA, 0.1 mm PMSF, and 0.1 mm benzamidine), incubated on ice for 30 min, and recentrifuged, retaining the supernatant (S2). Nucleosome oligomers were separated by centrifugation of ∼2 mg of chromatin through 5%–30% exponential sucrose gradients containing 20 mmTris-HCl (pH 7.5), 20 mm sodium butyrate, 0.25 mmNa3–EDTA, 0.1 mm PMSF and 0.1 mmbenzamidine at 36,000 rpm for 18 hr at 4°C in a Beckman SW40 rotor.
Immunofractionation of Dinucleosomes
Immunofractionation of purified dinucleosomes pooled from S1 and S2 was performed essentially as described by Hebbes et al. (1994). In brief, 400 μg dinucleosomes (as DNA, Input chromatin) in 10 mm Tris-HCl (pH 7.5), 50 mm NaCl, 10 mmsodium butyrate, 0.2 mm EDTA, 0.1 mm PMSF, 0.1 mm benzamidine were added to ∼100 μg of affinity purified anti-acetylated H4 antibody and incubated for 2 hr at 4°C with constant agitation. Immunocomplexes were isolated by the addition of 50 mg of prewashed protein A–Sepharose beads (Pharmacia), Unbound chromatin was removed, and following extensive washing, immunocomplexes (Bound) were released with 1.5% SDS. DNA was precipitated after phenol extraction, and proteins were recovered from the phenol phase by acetone precipitation.
aDNA Library Construction
All DNA manipulation steps below were followed by heat inactivation (10 min at 65°C unless otherwise stated), phenol–chloroform extraction, and ethanol precipitation to recover the DNA. Antibody-Bound dinucleosomal DNA fragments were first blunt-ended: Two micrograms (6.9 pmoles) of DNA was dephosphorylated in 10 mmTris-acetate, 10 mm magnesium acetate, 50 mmpotassium acetate with 1 unit of calf intestinal alkaline phosphatase (CIP; Pharmacia) per pmole of DNA, incubating for 45 min at 37°C. Further CIP was added to a final concentration of 1.5 U/pmole DNA, and incubation continued for 45 min at 55°C. CIP was heat inactivated at 85°C for 15 min. DNA pellets were resuspended in 20 μl of 50 mm Tris-HCl (pH 8.0), 10 mm MgCl2, 50 μm each dNTP, and 10 units each of T4 DNA polymerase and Klenow (Pharmacia) and incubated for 3 hr at 20°C.EcoRI– NotI adapters were ligated to the blunt-ended DNA using a modified method from the Time Saver cDNA Synthesis Kit (Pharmacia). DNAs were then phosphorylated and end-labeled by addition of 10 μCi of [γ-32P]dATP (4500 Ci/mmole, ICN), 5 units of T4 polynucleotide kinase and incubated for 5 min at 37°C. Phosphorylation was completed by the addition of 1.5 μl of unlabeled dATP (75 mm) and incubation for a further 25 min at 37°C. Adapted DNA was separated from excess and dimerized adaptors using a 3×270 mm Sephacryl S-300 column in 0.3m sodium acetate, 10 mm Tris-HCl (pH 8.0), and 1 mm EDTA, and fractions containing adapted DNA were pooled and precipitated. Adapted DNA fragments and λZap arms were coprecipitated with ethanol and resuspended in ligation buffer (66 mmTris-HCl at pH 8.0, 150 mm NaCl, 6.6 mmMgCl2, 0.1 mm spermidine, 10 mm DTT). ATP was added to 0.1 mm together with 5 units of T4 DNA ligase in a final volume of 10 μl. Samples were incubated for 30 min at 16°C, a further 5 units of T4 DNA ligase were added, and incubation continued overnight at 4°C. Ligation mixtures were then separately added to Gigapack Gold III packaging extracts (Stratagene) and incubated for 2 hr at 24°C. Two hundred microliters of SM buffer [100 mm NaCl, 8.1 mm MgSO4, 50 mm Tris-HCl (pH 7.5), 0.01% (wt/vol) gelatin] and 20 μl of chloroform were added to each, mixed, and centrifuged briefly to sediment cell debris.
In Vivo Excision of Library Phage
Single plaques were cored from plates and added to 250 μl of SM buffer with 4% chloroform and incubated for 2 hr at room temperature and then overnight at 4°C. Aliquots (200 μl) of phage samples were added to 200 μl of host XL1-Blue cells in 10 mmMgSO4 and infected with F1 helper phage R408 (1×10⁸ plaque-forming units). Samples were incubated for 15 min at 37°C, before the addition of 5 ml of Luria broth, and incubated for 4 hr at 37°C in a rotary shaker. Bacteria were heat-killed by incubation for 20 min at 68°C, and cell debris was pelleted by centrifugation. Supernatants containing the packaged pBluescript phagemids were stored at 4°C.
Amplification of Library Sequences for Sizing and Sequencing
Cloned dinucleosomal DNA sequences were amplified by PCR directly from bacterial colonies for use as template during automated sequencing. Single colonies of bacterial cells “picked” from agar plates were lysed by incubation at 100°C for 10 min and quenched on ice. Aliquots of these samples were subjected to hot start PCR amplification using T3 and T7 primers and 5 units of AmpliTaq DNA polymerase (Perkin-Elmer) for 25 cycles of 94°C for 30 sec, 50°C for 30 sec, and 72°C for 60 sec. Amplification products were size-analyzed by electrophoresis on 1.5% agarose gels and treated with 10 units of exonuclease I and 2 units of shrimp alkaline phosphatase by incubation at 37°C for 30 min before sequencing.
DNA Sequencing
Manual sequencing reactions were performed using the ΔTth DNA Polymerase Sequencing Kit (Cambridge Biosciences, UK) using [α-35S]dATP with T7 and T3 primers. Samples were analyzed on 8% polyacrylamide sequencing gels. Automated sequencing reactions were performed at the Human Genome Mapping Project Resource Centre, Hinxton, UK, using the ABI Prism Fluorescent Dye Terminator Ready Reaction Kit with the T7 primer. Samples were analyzed on 4% polyacrylamide sequencing gels using an ABI 377 automated sequencer.
Preparation of Total RNA from K562 Cells
K562 cells (107–108) were pelleted by centrifugation at 4°C, washed twice in sterile PBS, and lysed by resuspension in 2 ml of 4 m guanidinium isothiocyanate, 25 mm sodium citrate (pH 7.0), 0.5% N-lauryl sarcosine, 0.1% antifoam A (Sigma), and 0.1 mmercaptoethanol. Chromosomal DNA was sheared by repeated passage of the lysate through a 23-gauge sterile needle. Lysates were layered onto an equal volume of 5.7 m caesium chloride/0.1 m EDTA cushions, RNA pelleted by centrifugation at 30,000 rpm for 18 hr at 15°C, and washed twice with the guanidinium thiocyanate solution. Contaminating genomic DNA was removed by treatment with RNase-free DNase I, and samples were stored at 80°C.
Northern Analysis
Aliquots (20 μg) of total cellular RNA extracted from K562 cells were dissolved in 10 mm phosphate buffer (pH 7.0) and 0.88 m glyoxal and electrophoresed in 1.2% agarose gels in the same buffer. Transfer to Biodyne A membranes (Pall) was by capillary action in 20× SSC, and RNA was fixed by baking at 80°C for 1 hr. A 397-bp GAPDH probe was used to confirm effective transfer by observation of the 1.4 kb GAPDH message. Following excision byEcoRI and purification, 34 aDNA library inserts were labeled with 32P by random priming and used to probe the membranes.
RT of Total RNA
Five hundred nanograms of oligo(dT)12–18 or 50 ng of random hexameric oligonucleotides was added to 5 μg of total cellular RNA from K562 cells, and nucleic acids were denatured by incubation for 10 min at 70°C and chilling on ice. After adding reaction mix, primer annealing for oligo(dT) reactions was at 42°C for 5 min and for random hexameric reactions was at 25°C for 5 min. Two hundred units of SuperScript II RT enzyme (GIBCO) was added and incubated for 50 min at 42°C. Mock reactions omitting the RT enzyme were also performed for both the oligo(dT) and random hexameric primed reactions. RNA was removed from the cDNA by incubation with 2 units ofEscherichia coli RNase H for 20 min at 37°C.
Amplification of First Strand cDNA
PCR amplification of the first strand cDNA used primer pairs designed from library clones: primers for the GAPDH gene were used as a positive control. Thirty cycles of 94°C for 1 min; 50°C–62°C for 1 min, and 72°C for 1 min were used with 5 units of AmpliTaq (Perkin-Elmer). Annealing temperatures were optimized for each primer set.
Amplification of Genomic DNA
DNA was prepared from K562 nuclei essentially as described byMiller et al. (1988). PCR amplification of 100-ng aliquots of genomic DNA used primer pairs designed from library clone sequences, essentially as described above.
RH Mapping and Chromosomal Assignment
PCR reactions were performed at the RH mapping laboratories of the Sanger Centre, Cambridge using Peltier Thermal Cycle (PTC) 225 DNA Engine Tetrads (MJ Research). Primer pairs were “prescreened” against 50 ng of human placental, hamster CHO cell and mouse BALB/c genomic DNA templates. Annealing temperatures and primer levels were optimized before chromosome assignment and RH mapping. Chromosome assignments were carried out using the Corriel somatic cell hybrid mapping panel no. 2 using hamster, mouse, and 0.1× TE buffer controls. Hybrid samples (30 ng) were added to the chromosome reaction mix, and PCR amplifications were performed under the conditions optimized for each primer pair during prescreening. For RH mapping, primer pairs were assayed in duplicate against the Genebridge 4 RH mapping panel. A reduced panel containing 85 hybrids was used, the controls being human and hamster genomic DNA and 0.1× TE buffer. PCR reactions were performed under the optimized conditions determined during chromosomal assignment and prescreening. PCR products were analyzed on 1.5% agarose–TBE gels and visualized over UV light. Images of each gel were digitized using a Kodak Megaview high-resolution camera and a Macintosh based image-capture system. Resulting RH retention patterns were then analyzed by the RHMAPPER program (Slonim et al. 1996) using the 1998 map framework (Deloukas et al. 1998).
Nucleic Acid Electrophoresis, Transfer, and Hybridization
Total cellular RNA was electrophoresed in 1.2% agarose gels containing 10 mm sodium phosphate (pH 7.0) with recirculation of running buffer. The RNA was pretreated with 880 mmdeionized glyoxal for 1 hr at 50°C before addition of loading buffer. Northern and Southern blot transfers used 20× SSC high salt transfer buffer (0.3 m sodium citrate, 3 m NaCl) with Biodyne B membranes (Pall) for DNA and Biodyne A membranes for RNA. Slot blotting and hybridizations were as in Hebbes et al. (1994).
A.L.P. acknowledges the award of an MRC Human Genome Mapping Studentship. We are grateful to Marc Botcherby of the Human Genome Mapping Project Resource Centre for sequencing facilities and to Panos Deloukas and Ele Holloway of the Sanger Centre for help and advice with RH mapping. We would also like to thank Dr. Fiona Myers for helpful comments on the manuscript.
The publication costs of this article were defrayed in part by payment of page charges. This article must therefore be hereby marked “advertisement” in accordance with 18 USC section 1734 solely to indicate this fact.
Notes
[4] Corresponding author.
Notes
[5] E-MAIL [email protected]; FAX (44)-23-92842053.
REFERENCES
- ↵J. BoyesP. ByfieldY. NakataniV. Ogryzko(1998) Regulation of activity of the transcription factor GATA-1 by acetylation. Nature 396:594–598.
- ↵T. Brown(1994) Current protocols in molecular biology , ch. 4. (John Wiley & Sons, New York, NY).
- ↵A.C. ClaytonT.R. HebbesA.W. ThorneC. Crane Robinson(1993) Histone acetylation and gene induction in human cells. FEBS Lett. 336:23–26.
- ↵C. Crane-RobinsonA.P. Wolffe(1998) Immunological analysis of chromatin: FIS and CHIPS. Trends Genet. 14:477–480.
- ↵S.H. CrossJ.A. CharltonX. NanA.P. Bird(1994) Purification of CpG islands using a methylated DNA binding column. Nat. Genet. 3:236–244.
- ↵P. DeloukasG.D. SchulerG. GyapayE.M. BeasleyC. SoderlundP. Rodriguez-TomeL. HuiT.C. MatiseK.B. McKusickK.S. Beckmann(1998) A physical map of 30,000 human genes. Science 282:744–746.
- ↵T.R. HebbesA.W. ThorneC. Crane-Robinson(1988) A direct link between core histone acetylation and transcriptionally active chromatin. EMBO J. 7:1395–1402.
- ↵T.R. HebbesC.H. TurnerA.W. ThorneC. Crane-Robinson(1989) A 'minimal epitope' anti-protein antibody that recognises a single modified amino acid. Mol. Immunol. 26:865–873.
- ↵T.R. HebbesA.W. ThorneA.L. ClaytonC. Crane-Robinson(1992) Histone acetylation and globin gene switching. Nucleic Acids Res. 20:1017–1022.
- ↵T.R. HebbesA.L. ClaytonA.W. ThorneC. Crane-Robinson(1994) Core histone hyperacetylation co-maps with generalized DNase I sensitivity in the chicken β-globin chromosomal domain. EMBO J. 13:1823–1830.
- ↵H.-L. HuangJ. LauA.Y. KimM.J. WeissG.A. Blobel(1999) CREB-binding protein acetylates hematopoietic transcription factor GATA-1 at functionally important sites. Mol. Cell. Biol. 19:3496–3505.
- ↵C.A. JohnsonL.P. O'NeillA. MitchellB.M. Turner(1998) Distinctive patterns of histone H4 acetylation are associated with defined sequence elements within both heterochromatic and euchromatic regions of the human genome. Nucleic Acids Res. 26:994–1001.
- ↵M.-H. KuoJ. ZhouP. JambeckM.A.E. ChurchillC.D. Allis(1998) Histone acetyltransferase activity of yeast Gcn5p is required for the activation of target genes in vivo. Genes & Dev. 12:627–639.
- ↵J.E. KrebsJ. ZhouC.D. AllisC.L. Peterson(1999) Cell cycle-regulated histone acetylation required for expression of the yeast HO gene. Genes & Dev. 13:1412–1421.
- ↵S.A. MillerD.D. DykesH.F. Polesky(1988) A simple salting out procedure for extracting DNA from human nucleated cells. Nucleic Acids Res. 16:1215.
- ↵B.S. ParekhT. Maniatis(1999) Virus infection leads to localized hyperacetylation of histones H3 and H4 at the IFN-beta promoter. Mol.Cell 3:125–129.
- ↵S.C. SatchwellA.A. Travers(1989) Asymmetry and polarity of nucleosomes in chicken erythrocyte chromatin. EMBO J. 8:229–238.
- ↵C.K. ShenT. Maniatis(1980) The organization of repetitive sequences in a cluster of rabbit beta-like globin genes. Cell 19:379–391.
- ↵D. SlonimL. KruglyakL. SteinE. Lander(1996) Building human genome maps with radiation hybrids. Conference proceedings, RECOMB 97. (ACM Press, New York, NY).