
Abstract
The number of de novo mutations (DNMs) in the human germline is correlated with parental age at conception, but this explains only part of the observed variation. We investigated whether there is a family-specific contribution to the number of DNMs in offspring. The analysis of DNMs in 111 dizygotic twin pairs did not identify a substantial family-specific contribution. This result was corroborated by comparing DNMs of 1669 siblings to those of age-matched unrelated offspring following correction for parental age. In addition, by modeling DNM data from 1714 multi-offspring families, we estimated that the family-specific contribution explains ∼5.2% of the variation in DNM number. Furthermore, we found no substantial difference between the observed number of DNMs and those predicted by a stochastic Poisson process. We conclude that there is a small family-specific contribution to DNM number and that stochasticity explains a large proportion of variation in DNM counts.
De novo mutations (DNMs) are drivers of genetic diversity and evolution and can also cause severe diseases, such as intellectual disability, autism, and schizophrenia (Veltman and Brunner 2012). The number of single nucleotide DNMs per individual genome ranges between 30 and 80 (Gilissen et al. 2014) and is correlated with the age of the parents at conception (Kong et al. 2012; Goldmann et al. 2016; Wong et al. 2016; Jónsson et al. 2017). Aging of fathers adds one DNM per year, while aging of mothers adds one DNM every four years. However, parental age at conception explains only part of the observed variation in DNM count between individuals, raising the possibility that other factors can affect the number of DNMs an individual carries. Such factors could be endogenous, such as genetic variation in genes involved in DNA repair (Goldberg et al. 2021), or could be of external origin, like ionizing radiation (Adewoye et al. 2015; Holtgrewe et al. 2018) and environmental pollutants (Ton et al. 2018; Beal et al. 2019). Studies of multi-offspring families have also suggested that the paternal age effect may differ significantly between families, where the mean yearly increase in DNMs per offspring with age of the fathers can vary from 0.2 to 3.2 DNMs per year (Rahbari et al. 2016; Sasani et al. 2019).
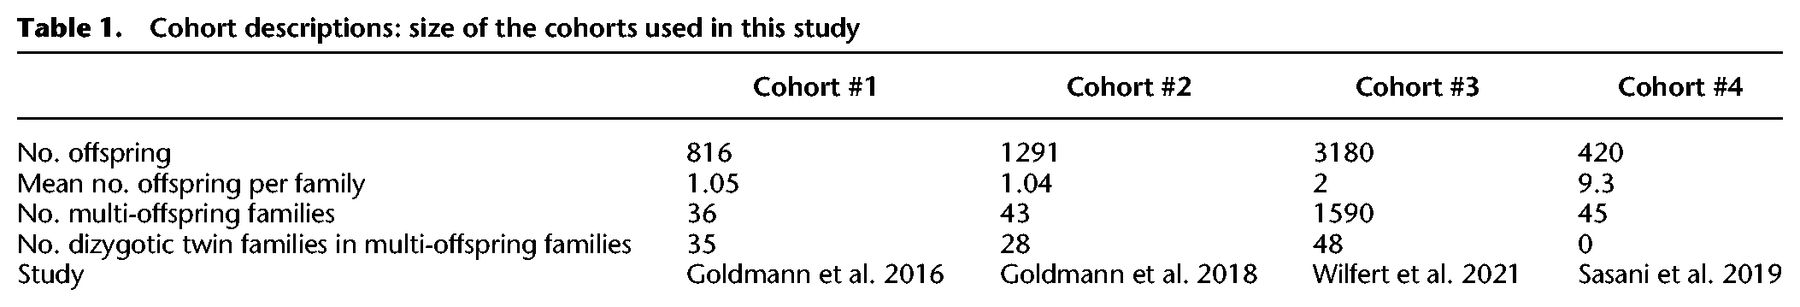
Here, we analyzed DNMs from families with several offspring across four cohorts (Table 1) to investigate the family-specific contribution to variability in DNM counts between individuals.
Cohort descriptions: size of the cohorts used in this study
Results
We collected four cohorts from published whole-genome sequencing studies of families with multiple offspring, totaling 111 dizygotic twin pairs, 1714 multi-offspring families, and 45 large families (median of 10 offspring) (Table 1). Because these cohorts were based on different sequencing and analysis methods, they were analyzed separately after quality control and used as independent replicates within this study (Supplemental Table 1; Methods).
Twins do not have a significantly different number of DNMs than age-matched unrelated children
If family-specific effects exist, they would cause unrelated individuals to have larger differences in the number of DNMs than siblings from a single family. Parental ages at conception are established factors that affect the number of DNMs in the offspring and need to be considered when comparing DNM counts between families. However, using dizygotic twins we can directly compare the number of DNMs without correcting for parental age, thus allowing us to assess the possibility of a large family-specific effect without mathematical modeling. The median differences in the number of DNMs for the dizygotic twins are 8, 8.5, and 9 for cohorts #1–3, respectively (there are no twin families in cohort #4) (Fig. 1A). The individual differences range from 0 DNMs to 29 DNMs. We did not observe significant trends in these differences nor a change in their variation with the age of the father (P-value for linear slope being different from zero P = 0.31; Breusch-Pagan test for heteroscedasticity P = 0.54) (Supplemental Note 1).
Comparing dizygotic twins and parental age–matched unrelated children (PAMUCs). (A) Number of DNMs in dizygotic twins in relation to age of the father. Twins are linked by lines. (B) Number of DNMs in parental age–matched unrelated children (PAMUCs) in relation to age of the father. (C) Absolute differences in the number of DNMs between twins and PAMUCs. Numbers indicate sizes of sets, boxes indicate interquartile range, and bold line indicates median.
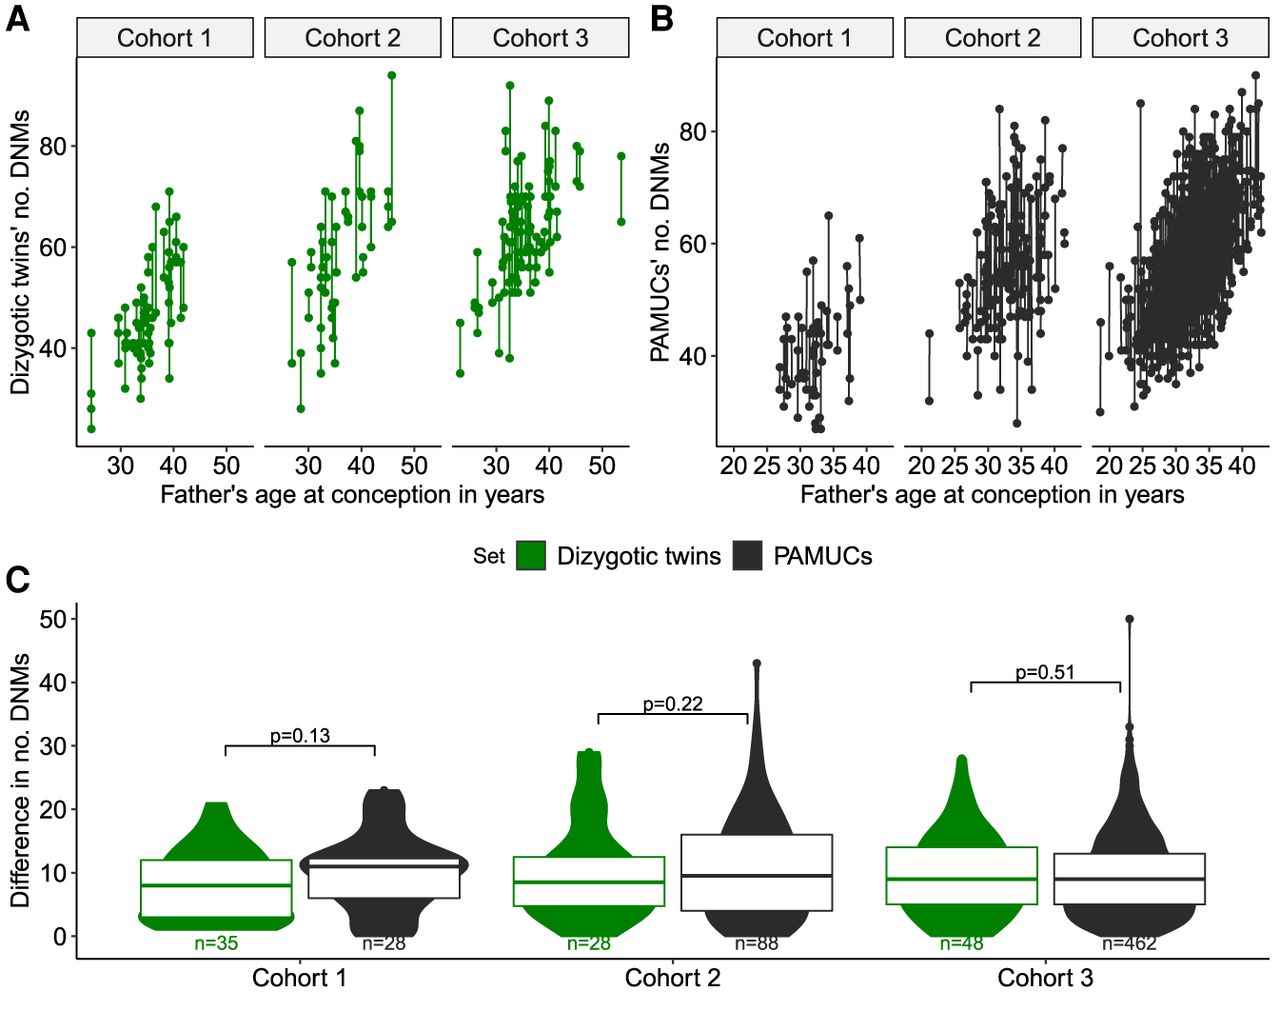
We compared the differences in DNMs between twin pairs to those of 601 pairs of parental age-matched unrelated children (PAMUCs) (Methods) and observed median differences of 11, 9.5, and 9 DNMs between the PAMUCs of cohorts #1–3 (Fig. 1B). We did not detect a significant difference between the number of DNMs in twins and PAMUCs within any of the cohorts or for the combined data set (P = 0.07; P = 0.35; P = 0.54 for cohorts #1–3, respectively; P-value for all data sets combined P = 0.20, Wilcoxon rank-sum test) (Fig. 1C).
The absence of a significant difference may be due to a lack of statistical power given the relatively small number of dizygotic twins and PAMUCs (Supplemental Note 2). In order to increase our statistical power, we included siblings of different ages and fit a regression model accounting for parental age at conception (Supplemental Tables 1, 2). We compared the residual differences of families with two offspring (cohorts #1–3: 37, 42, 1590 sibling pairs) to unrelated children in the same cohort but found no significant differences in any cohort (cohorts #1–3: P = 0.56, P = 0.38, P = 0.055; Wilcoxon rank-sum test) (Supplemental Fig. 1). These results suggest that any family-specific effect on the number of DNMs can only be small, because we should have sufficient power to detect large effects.
Random effects modeling allows direct estimation of the family-specific variance
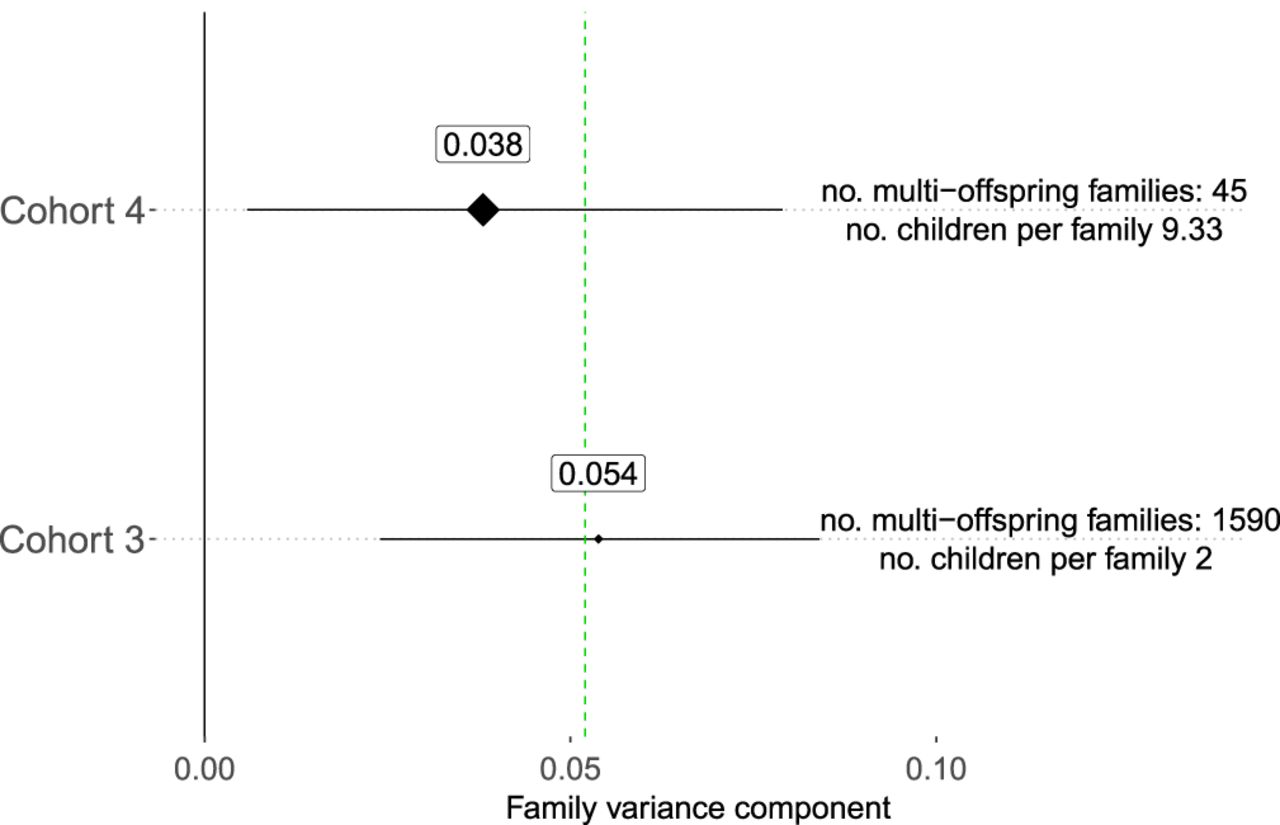
We used a random effects model to directly estimate the potential impact of family-specific effects on the variation in DNM count between individuals. While the effects on the number of DNMs for paternal age and maternal age are fixed, we allow each family affiliation to add a specific number of DNMs to the total (Methods). We did the same for batch where batch information was available (cohort #1 and cohort #3) (Methods; Supplemental Table 3; Supplemental Fig. 3). We applied this model to all four cohorts but found in the smaller cohorts #1 and #2 that the confidence intervals around the variance component estimates were large (Supplemental Fig. 2). In our largest cohort with siblings (cohort #3) and the cohort of large families (cohort #4), we found that the point estimates for the variance components vary from 5.4% to 3.8% (Fig. 2; Supplemental Table 2). The mean of these familial variance component estimates weighted by the number of offspring is 5.2%. This shows that family-specific effects can have only a minor impact on de novo mutation rate.
Estimating familial variance components. The error bars denote the 95% confidence intervals. The diamonds indicating the estimates are scaled according to the mean number of children per family. The vertical green line indicates the weighted mean between the point estimates of the two cohorts (cohort #3 and cohort #4) based on the number of multi-offspring families each cohort contains. Variance component estimations for cohorts #1 and #2 were not included above due to small cohort size (Supplemental Fig. 2).
Differences in DNM number between families can be simulated by a Poisson distribution
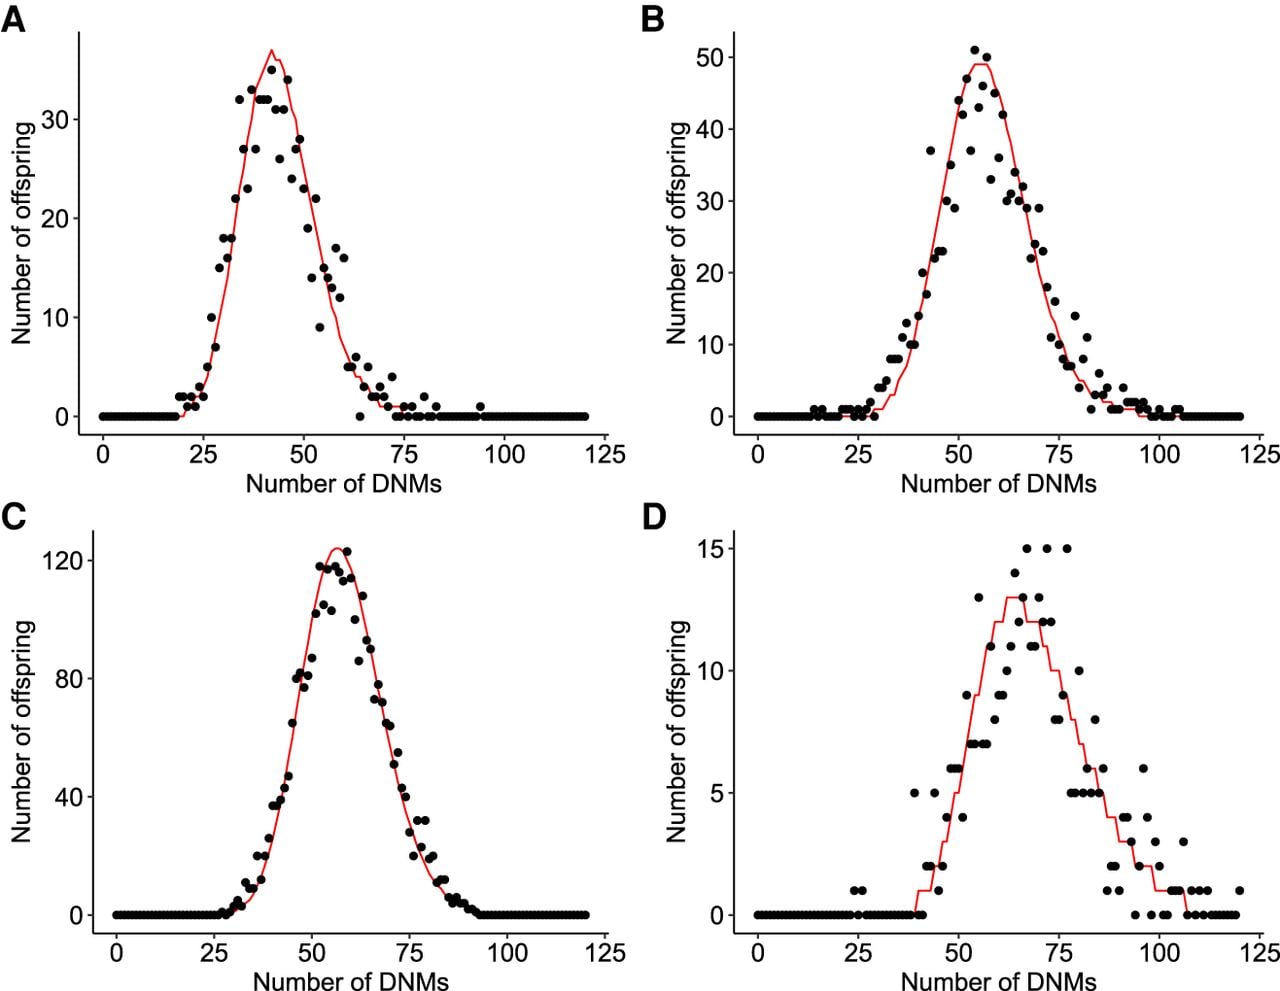
Because the variability of DNM counts between individuals due to family-specific effects is small, we considered the possibility that stochasticity explains a large proportion of observed variation. We simulated mutation counts as a Poisson-distributed variable by first fitting a linear Poisson regression model to the observed DNM counts to obtain the expected number of mutations dependent on parental age (see Methods). For each family in cohorts #1–4, we obtained probabilities for all relevant mutation numbers and summed them. The resulting distributions closely resemble the observed DNM counts, with no significant differences detected in either the median or variance (all Bonferroni-corrected P-values > 0.2) (Fig. 3; Supplemental Table 4). Additionally, when base pair changes are differentiated (C > A, C > G, C > T [non-CpG], CpG > TpG, T > A, T > C, and T > G), we do not find significant differences between the observed DNM counts and the Poisson predictions, providing further support that family-specific effects may only contribute very little to variability in the number of DNMs between individuals (all Bonferroni-corrected P > 0.99) (Supplemental Table 5; Supplemental Fig. 4; Supplemental Note 1).
Modeling DNMs as a family-independent Poisson process. (A–D) Simulations from cohorts #1–#4, respectively. Red lines depict Poisson-based predictions, black dots denote observations. Supplemental Table 3 lists P-values for various tests comparing predictions to observations.
Discussion
Previously, Sasani et al. (2019) reported significant differences in the yearly increase of DNMs per family, ranging from 0.2 DNMs per year to 3.2 DNMs per year. These wide ranges suggest family-specific differences in germline DNA maintenance that cause mutations to accumulate at rates differing by more than one order of magnitude.
Here, we assessed whether family-specific differences are a substantial contributor to the variation in DNM count between individuals in a different manner. Whereas Sasani et al. investigated differences in the accumulation of DNMs between large families with many offspring, we investigated whether a systematic bias in DNM counts between families could be observed on a population level using larger cohorts. Although our study also identified a significant family-specific effect, familial variance component estimates on our large cohorts range only from 3.8% to 5.4%, with the maximum of the 95% confidence interval of our estimate at 8.4%. In support of the relatively small amount of variation that we are able to explain by a family-specific effect, we find that the remaining variation may be explained by stochasticity using a simple Poisson model. However, small deviations from this model may be undetectable due to lack of power with the size of the currently available cohorts, and therefore these findings do not exclude the existence of individual families with outlying DNM rates and a more substantial family-specific effect. Our finding that stochasticity dominates the mutation accumulation, rather than family-associated factors originating from genetics or environment, sets germline mutation accumulation apart from other human quantitative traits. For instance, for the quantitative trait body height, the majority of heritability is associated with genetic and environmental factors, such that siblings from one family in the same environment are likely to grow to comparable heights (Jelenkovic et al. 2016).
The de novo mutation rate's independence from familial factors suggests that the DNA maintenance machinery of the germline is very resilient to both genetic variation and common environmental mutagenic influences. Across thousands of sequencing studies to date, we observe that variation in DNM number between individuals is constrained compared to what is observed in somatic tissues (Gilissen et al. 2014; Martincorena et al. 2015; Lee-Six et al. 2019). This constraint has particular implications for the risk of a variety of genetic conditions, notably intellectual disability, autism, and schizophrenia (Veltman and Brunner 2012). Moreover, recent whole-genome studies attempting to detect DNMs caused by exposure to known mutagens have confirmed the germline's resistance to environmental mutagens. In the descendants of individuals exposed to ionizing radiation (Holtgrewe et al. 2018), dioxin (Ton et al. 2018), benyo(a)yrene (Beal et al. 2019), and the aftermath of atomic bombs (Horai et al. 2018), no paternal age-corrected mean excess of SNV DNMs larger than a handful of mutations has so far been observed.
Methods
Cohorts
Cohort #1 is the Inova Translational Medicine Institute (ITMI) Premature Birth Study cohort with 816 healthy newborns being born at the Inova hospital (Goldmann et al. 2016). One third of probands (219) were born prematurely (gestational age < 37 wk). Cohort #2 is the ITMI Childhood Longitudinal Cohort Study cohort (Goldmann et al. 2018). Cohort #3 is a combination of the SSC, TASC, and SAGE study cohorts sequenced at the New York Genome Center (Wilfert et al. 2021). Cohort #4 is a collection of large families from the Centre d'Etude du Polymorphisme Humain (CEPH) consortium (Sasani et al. 2019; Dausset et al. 2020). The cohorts are compared in Supplemental Table 1. Specifics of the custom pipelines used for DNM calling in each cohort are available in the appropriate references. Where the age at conception was not available, we used the age at birth accordingly. DNM data from each of the four cohorts (#1–4) are available in the Supplemental Materials of the publications indicated in Table 1 (Goldmann et al. 2016, 2018; Sasani et al. 2019; Wilfert et al. 2021). Quality control for all cohorts can be found in Supplemental Code 1.
In all four cohorts, parental age-matched unrelated children were identified by scanning for pairs of children where the sum of the differences in parental ages was <43 d.
Computation
All computational analysis for this project was done in R 3.6.2 (R Core Team 2019).
Analysis of parental age–corrected DNM counts
We fitted a linear model predicting the number of DNMs based on the age of mother and father at conception (Supplemental Fig. 5)
For each offspring, we calculated the residuals ri of the model as
For each family with two offspring, we calculated the absolute difference of the two offspring's residuals |ri – rj|. Because cohort #4 contained no families with exactly two offspring, we randomly sampled a sibling pair from each family. We compared the parental age-corrected difference in DNMs to the differences of two offspring randomly sampled from the same cohort. We resampled the family labels 1000 times. We used Wilcoxon rank-sum tests for assessing statistical significance. Code can be found in Supplemental Code 2 (twins vs. PAMUCs) and Supplemental Code 3 (residual analysis).
In cohort #3, each family contained one patient with an autism-spectrum disorder and one unaffected sibling. We could not detect a significant difference in the parental-age corrected number of de novo mutations between these two groups (Supplemental Fig. 6).
Estimating the familial variance component
We model the number of DNMs of an individual as the sum of a baseline expectation, the paternal age effect, the maternal age effect, and a residual error term. More specifically, the number of DNMs X of an individual i is
To allow for possible familial influences on the number of DNMs, we added a familial influence factor Fj, which is a random effects term specific to every family j.
The introduction of this term allows us to estimate the variance introduced to the model by family-specific influences. For this, the model is fitted to observed data using the R statistical environment with the package “lmer” for fitting the linear models with random effects (Bates et al. 2015). We obtained the variance components of all factors in the model with 95% confidence intervals by applying the function “rpt” R package “rptR” with 500-fold bootstrapping, which estimates variance components for both fixed and random effects (Stoffel et al. 2017). Code can be found in Supplemental Code 4.
Batch effect estimation
We model the batch effect in the same way as the family effect—by including a batch-specific random effects term to the regression formula. Fitting this term to every batch allowed for estimation of inter-batch variation (Supplemental Table 3; Supplemental Fig. 3).
Nevertheless, this approach requires batch annotation to be both present and sufficiently disjunct from the family annotations such that the fitting algorithm can robustly differentiate both effects. For cohorts #1 and #3, such annotations were available to us; these were version numbers of the software pipeline for cohort #1 and the date of the sequencing run for cohort #3.
Poisson simulations of DNM counts
Following estimation of a small family-specific effect on variation in DNM counts between individuals, we considered that stochasticity could explain a large proportion of observed variation.
To investigate this, we simulated mutation counts as a Poisson-distributed variable by first fitting a linear Poisson regression model to the observed DNM counts to obtain the expected number of mutations dependent on parental age. More formally, for each individual i, we modeled the number of de novo mutations Xi as
To compare predicted densities to observed values, we used two sets of statistical tests. First, we used a Wilcoxon rank-sum test to assess differences in the median of the distributions. Second, we used a group of tests to assess differences in the variance of the distributions, including Levene's test and the Fligner-Killeen test for heterogeneity of variance, the Ansari-Bradley test and Mood's test for the difference in scale parameters, as well as the parametric F-test for comparison of variances. Code can be found in Supplemental Code 5.
Multiple testing correction
P-values were corrected for multiple testing by Bonferroni's method where indicated.
Data access
De novo mutation data from all four previously published cohorts used in this study and code to reproduce analysis and figures are available at GitHub (https://github.com/jgoldmann/DNM_variance_compendium) and in Supplemental Code Files 1–5.
Competing interest statement
The authors declare no competing interests.
Acknowledgments
This project was partly funded by The Netherlands Organisation for Scientific Research (918-15-667 to J.A.V. and 917-17-353 to C.G.).
Author contributions: J.M.G., C.G., and J.A.V. conceived and planned the study. J.M.G., J.E.H., and M.A.J. carried out the analysis. J.M.G., J.E.H., W.S.W.W., T.N.T., M.A.J., M.A.H., E.E.E., J.A.V., and C.G. interpreted the results. J.M.G., W.S.W.W., A.B.W., T.N.T., R.B., E.E.E., and G.L.M. acquired the data. J.M.G., J.E.H., W.S.W.W., M.A.H., J.A.V., and C.G. drafted the manuscript. All authors contributed to the final version of the paper.
Notes
[1] Supplementary material [Supplemental material is available for this article.]
[2] Article published online before print. Article, supplemental material, and publication date are at https://www.genome.org/cgi/doi/10.1101/gr.271809.120.
References
- ↵Adewoye AB, Lindsay SJ, Dubrova YE, Hurles ME. 2015. The genome-wide effects of ionizing radiation on mutation induction in the mammalian germline. Nat Commun 6: 6684. 10.1038/ncomms7684
- ↵Bates D, Mächler M, Bolker B, Walker S. 2015. Fitting linear mixed-effects models using lme4. J Stat Softw 67: 1–48. 10.18637/jss.v067.i01
- ↵Beal MA, Meier M, Williams A, Rowan-Carroll A, Gagné R, Lindsay SJ, Fitzgerald T, Hurles ME, Marchetti F, Yauk CL. 2019. Paternal exposure to benzo(a)pyrene induces genome-wide mutations in mouse offspring. Commun Biol 2: 228. 10.1038/s42003-019-0476-5
- ↵Dausset J, Cann H, Cohen D, Lathrop M, Lalouel JM, White R. 1990. Centre d'etude du polymorphisme humain (CEPH): collaborative genetic mapping of the human genome. Genomics 6: 575–577. 10.1016/0888-7543(90)90491-C
- ↵Gilissen C, Hehir-Kwa JY, Thung DT, van de Vorst M, van Bon BEM, Willemsen MH, Kwint M, Janssen IM, Hoischen A, Schenck A, 2014. Genome sequencing identifies major causes of severe intellectual disability. Nature 511: 344–347. 10.1038/nature13394
- ↵Goldberg ME, Harris K. 2021. Mutational signatures of replication timing and epigenetic modification persist through the global divergence of mutation spectra across the great ape phylogeny. Genome Biol Evol evab104 10.1093/gbe/evab104
- ↵Goldmann JM, Wong WSW, Pinelli M, Farrah T, Bodian D, Stittrich AB, Glusman G, Vissers LELM, Hoischen A, Roach JC, 2016. Parent-of-origin-specific signatures of de novo mutations. Nat Genet 48: 935–939. 10.1038/ng.3597
- ↵Goldmann JM, Seplyarskiy VB, Wong WSW, Vilboux T, Neerincx PB, Bodian DL, Solomon BD, Veltman JA, Deeken JF, Gilissen C, 2018. Germline de novo mutation clusters arise during oocyte aging in genomic regions with high double-strand-break incidence. Nat Genet 50: 487–492. 10.1038/s41588-018-0071-6
- ↵Holtgrewe M, Knaus A, Hildebrand G, Pantel JT, de los Santos MR, Neveling K, Goldmann JM, Schubach M, Jäger M, Coutelier M, 2018. Multisite de novo mutations in human offspring after paternal exposure to ionizing radiation. Sci Rep 8: 14611. 10.1038/s41598-018-33066-x
- ↵Horai M, Mishima H, Hayashida C, Kinoshita A, Nakane Y, Matsuo T, Tsuruda K, Yanagihara K, Sato S, Imanishi D, 2018. Detection of de novo single nucleotide variants in offspring of atomic-bomb survivors close to the hypocenter by whole-genome sequencing. J Hum Genet 63: 357–363. 10.1038/s10038-017-0392-9
- ↵Jelenkovic A, Hur YM, Sund R, Yokoyama Y, Siribaddana SH, Hotopf M, Sumathipala A, Rijsdijk F, Tan Q, Zhang D, 2016. Genetic and environmental influences on adult human height across birth cohorts from 1886 to 1994. eLife 5: e20320. 10.7554/eLife.20320
- ↵Jónsson H, Sulem P, Kehr B, Kristmundsdottir S, Zink F, Hjartarson E, Hardarson MT, Hjorleifsson KE, Eggertsson HP, Gudjonsson SA, 2017. Parental influence on human germline de novo mutations in 1,548 trios from Iceland. Nature 549: 519–522. 10.1038/nature24018
- ↵Kong A, Frigge ML, Masson G, Besenbacher S, Sulem P, Magnusson G, Gudjonsson SA, Sigurdsson A, Jonasdottir A, Jonasdottir A, 2012. Rate of de novo mutations and the importance of father's age to disease risk. Nature 488: 471–475. 10.1038/nature11396
- ↵Lee-Six H, Olafsson S, Ellis P, Osborne RJ, Sanders MA, Moore L, Georgakopoulos N, Torrente F, Noorani A, Goddard M, 2019. The landscape of somatic mutation in normal colorectal epithelial cells. Nature 574: 532–537. 10.1038/s41586-019-1672-7
- ↵Martincorena I, Roshan A, Gerstung M, Ellis P, Van Loo P, McLaren S, Wedge DC, Fullam A, Alexandrov LB, Tubio JM, 2015. Tumor evolution: high burden and pervasive positive selection of somatic mutations in normal human skin. Science 348: 880–886. 10.1126/science.aaa6806
- ↵Rahbari R, Wuster A, Lindsay SJ, Hardwick RJ, Alexandrov LB, Turki SA, Dominiczak A, Morris A, Porteous D, Smith B, 2016. Timing, rates and spectra of human germline mutation. Nat Genet 48: 126–133. 10.1038/ng.3469
- ↵R Core Team. 2019. R: a language and environment for statistical computing. R Foundation for Statistical Computing, Vienna. https://www.R-project.org/.
- ↵Sasani TA, Pederson BS, Gao Z, Baird L, Przeworksi M, Jorde LB, Quinlan AR. 2019. Large, three-generation human families reveal post-zygotic mosaicism and variability in germline mutation accumulation. eLife 8: e46922. 10.7554/eLife.46922
- ↵Stoffel MA, Nakagawa S, Schielzeth H. 2017. rptR: repeatability estimation and variance decomposition by generalized linear mixed-effects models. Methods Ecol Evol 8: 1639–1644. 10.1111/2041-210X.12797
- ↵Ton ND, Nakagawa H, Ha NH, Duong NT, Nhung VP, Hien LTT, Hue HTT, Hoang NH, Wong JH, Nakano K, 2018. Whole genome sequencing and mutation rate analysis of trios with paternal dioxin exposure. Hum Mutat 39: 1384–1392. 10.1002/humu.23585
- ↵Veltman JA, Brunner HG. 2012. De novo mutations in human genetic disease. Nat Rev Genet 13: 565–575. 10.1038/nrg3241
- ↵Wilfert AB, Turner TN, Murali SC, Hsieh PH, Sulovari A, Wang T, Coe BP, Guo H, Hoekzema K, Bakken TE, 2021. Recent ultra-rare inherited variants implicate new autism candidate risk genes. Nat Genet 53: 1125–1134. 10.1038/s41588-021-00899-8
- ↵Wong WSW, Solomon BD, Bodian DL, Kothiyal P, Eley G, Huddleston KC, Baker R, Thach DC, Iyer RK, Vockley JG, 2016. New observations on maternal age effect on germline de novo mutations. Nat Commun 7: 10486. 10.1038/ncomms10486