

Abstract
We present the sequence of a contiguous 2.63 Mb of DNA extending from the tip of the X chromosome ofDrosophila melanogaster. Within this sequence, we predict 277 protein coding genes, of which 94 had been sequenced already in the course of studying the biology of their gene products, and examples of 12 different transposable elements. We show that an interval between bands 3A2 and 3C2, believed in the 1970s to show a correlation between the number of bands on the polytene chromosomes and the 20 genes identified by conventional genetics, is predicted to contain 45 genes from its DNA sequence. We have determined the insertion sites ofP-elements from 111 mutant lines, about half of which are in a position likely to affect the expression of novel predicted genes, thus representing a resource for subsequent functional genomic analysis. We compare the European Drosophila Genome Project sequence with the corresponding part of the independently assembled and annotated Joint Sequence determined through “shotgun” sequencing. Discounting differences in the distribution of known transposable elements between the strains sequenced in the two projects, we detected three major sequence differences, two of which are probably explained by errors in assembly; the origin of the third major difference is unclear. In addition there are eight sequence gaps within the Joint Sequence. At least six of these eight gaps are likely to be sites of transposable elements; the other two are complex. Of the 275 genes in common to both projects, 60% are identical within 1% of their predicted amino-acid sequence and 31% show minor differences such as in choice of translation initiation or termination codons; the remaining 9% show major differences in interpretation.
[All of the sequences analyzed in this paper have been deposited in the EMBL-Bank database under the following accession nos.: AL009146,AL009147, AL009171, AL009188–AL009196, AL021067, AL021086,AL021106–AL021108, AL021726, AL021728, AL022017, AL022018, AL022139,AL023873, AL023874, AL023893, AL024453, AL024455–AL024457, AL024485,AL030993, AL030994, AL031024–AL031028, AL031128, AL031173, AL031366,AL031367, AL031581–AL031583, AL031640, AL031765, AL031883, AL031884,AL034388, AL034544, AL035104, AL035105, AL035207, AL035245, AL035331,AL035632, AL049535, AL050231, AL050232, AL109630, AL121804, AL121806,AL132651, AL132792, AL132797, AL133503–AL133506, AL138678, AL138971,AL138972, and Z98269. A single file (FASTA format) of the 2.6-Mb contig is available fromftp://ftp.ebi.ac.uk/pub/databases/edgp/contigs/contig_1.fa.]
Less than 90 years have elapsed since Alfred H. Sturtevant presented the world with the first-ever genetic map of six visible markers on theX chromosome of Drosophila melanogaster(Sturtevant 1913). The extraordinary achievement of determining the entire euchromatic DNA sequence of D. melanogaster (Adams et al. 2000) now gives us the potential to identify every single coding region within this gene-rich region.
The first tentative steps towards sequencing the complete genome ofDrosophila were taken 10 years ago with the construction of a physical map of the X chromosome (Sidén-Kiamos et al. 1990; Madueño et al. 1995) and the explicit declaration of the objective of whole-genome sequencing. Since then, both the European and Berkeley Drosophila Genome Projects (EDGP and BDGP) (Saunders et al. 1989; Kafatos et al. 1990; Rubin 1996, 1998; Louis et al. 1997) and, more recently Celera Genomics, have worked towards the common goal of completing the sequence of the entire genome of this fly. An essentially complete sequence of the euchromatic genome of D. melanogaster has now been published by the Celera Genomics/BDGP/Baylor College of Medicine collaboration with some input from EDGP; in this paper we call this the Joint Sequence (see Methods) (Adams et al. 2000; Myers et al. 2000; Rubin et al. 2000a).
We present an ∼2.7 Mb region accurately sequenced and analyzed independently of the Joint Sequence. This is only the second detailed molecular analysis of a genomic sequence of several megabases fromDrosophila, and it offers some interesting contrasts with the 3 Mb region of an autosome, whose analysis has been published recently (Ashburner et al. 1999). It also gives an opportunity to compare the results and analysis of a sequence obtained by the widely adopted clone-by-clone approach to those obtained from the whole-genome shotgun approach adopted by Celera and their collaborators (Venter et al. 1998). We also report the collection of ∼6 Mb discontinuous sequence from divisions 4 – 10, which was obtained by sequencing at 1.5-fold coverage a collection of 29 BAC clones representing a minimal tiling path.
The tip of the X chromosome of D. melanogaster is a region of some sentimental, as well as much scientific, interest to geneticists. It includes the locus of the gene white, whose mutation was the first clear visible mutation found inDrosophila (Morgan 1910) and whose study led to the discovery of sex-linked inheritance and, hence, to the proof of the chromosome theory of heredity (Bridges 1916). It also includes a region, between the genes zeste and white, which was intensively studied by Burke Judd and colleagues (Judd et al. 1972) in an attempt to analyze the relationship between polytene chromosome bands and genes. There are two classic genetic complexes at the tip of the chromosome — the achaete-scute complex, whose phenotypic effects have long fascinated geneticists and generated much theoretical speculation (Agol 1929; Garcı́a-Bellido 1979), and thebroad complex (Zhimulev et al. 1995). The physical bases for the complexities in genetic analysis are quite different in these two cases (see below). Cytologically, the region includes, of course, theXL telomere, perhaps the best-characterized telomere inDrosophila (Biessmann and Mason 1997) as well as a region of polytene banding complexity that had indicated to Bridges (1935) the presence of a long reverse-repeat (Benos et al. 2000).
The main part of the sequence is contiguous, consisting of a single contig of 2,626,764 bp. The rest consists of a cosmid clone (23E12) that contains a number of Drosophila subtelomeric repeats (EMBL accession no. L03284) and thus represents the most distal part of the X chromosome. The two parts are separated by an unspecified number of repeats, and together amount to 2,664,670 bp.
RESULTS AND DISCUSSION
Linking the Genetic Map of the X Chromosome to a Molecular Framework
A decade ago, the founding members of the EDGP argued the case for constructing an accurate physical map of the genome of D. melanogaster linked to the genetic map (Sidén-Kiamos et al. 1990). To this end, cosmid clones were selected by hybridization with PCR-amplified DNA microdissected from each of the 100 individual divisions of the major polytene chromosome arms. A physical map was generated by determining overlaps between the cosmids based on the shared fragments generated by restriction endonuclease digestion (Sulston et al. 1988). The localization of cosmids was verified by in situ hybridization to the polytene chromosomes and by determining STSs of cosmid end sequences (Louis et al. 1997). This physical map, and the cosmid library on which it was based, are available as a public resource (http://www.hgmp.mrc.ac.uk/Biology/descriptions/drosophila.html).
A physical map was also constructed by the BDGP (Kimmerly et al. 1996) based on segments of DNA cloned in a P1 phage vector that were aligned using PCR based STS content mapping. However, it was clear that both the cosmid and P1 maps would be an incomplete resource for sequencing the genome. Moreover, although the YAC map of Ajioka et al. (1991) does give good coverage, in our hands YAC clones were impractical for DNA sequencing purposes. We therefore undertook to build another map based on BAC clones because these vectors can, in principle, accommodate larger inserts of DNA. The generation of these BAC clones, that give an approximately 10-fold coverage of the genome, will be described in detail elsewhere. The library is available as a public resource (http://www.hgmp.mrc.ac.uk/Biology/descriptions/dros_bac.html). Clones from both this and a BAC library of partial EcoRI digestion products of DNA constructed for the BDGP (Hoskins et al. 2000) were physically ordered and linked by hybridization with a total of 647 hybridization probes each of 40 nucleotides in length corresponding to sequences distributed along the length of theX chromosome. The resulting maps, whose full description will also be provided elsewhere, allowed us to determine a minimal tiling path of clones for sequencing purposes. We selected such a minimal tiling path extending through polytene divisions 4–10, and determined the sequence of these clones at ∼1.5-fold coverage (http://edgp.ebi.ac.uk/cgi-bin/progress.pl). This provided a skeletal sequence scan of ∼6 Mb of the chromosome that was made available to the Celera/BDGP/Baylor shotgun sequencing project for use as an assembly scaffold.
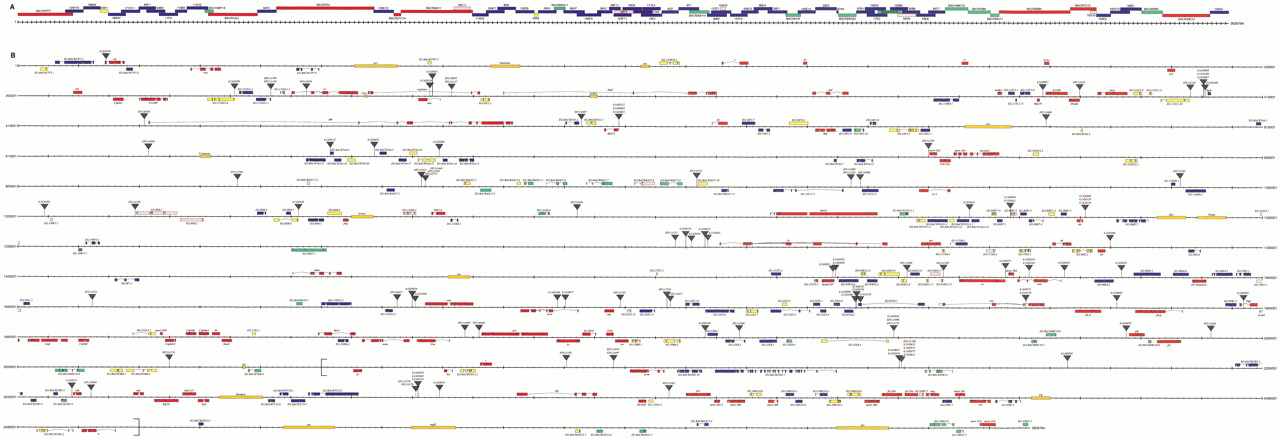
The accurate sequencing of polytene divisions 1–3 was initiated on a minimal tiling path of cosmid clones, subsequently extended using the BAC clones to fill gaps in the cosmid map. The clones selected for sequencing are presented in Figure 1A, and the assembled nonredundant sequence can be directly accessed athttp://edgp.ebi.ac.uk/cgi-bin/progress.pl, which links to the EMBL-Bank deposits.
Physical maps of the interval 1A–3C. (A) Minimal tiling pattern of clones sequenced in divisions 1A–3C. BACR clones are indicated in red; BACN and BACH clones are indicated in green; cosmid clones are indicated in blue; redundant clones sequenced are indicated in pink; a few small regions were sequenced from other clones, these are indicated in yellow. The BACR, BACN, and BACH clones are from the same strain as that sequenced by the BDGP and Celera; the cosmids are from a different strain (see Methods). Scale divisions are 10 Kb. (B) Genes, transposable elements, and P-elementinsertions in divisions 1A–3C. Known genes are shown in red; genes with significant protein similarities to nondrosophilid proteins are shown in blue; predicted genes with EST hits are shown in yellow; predicted genes with no EST hits are shown in green; predicted genes with protein motif matches are shown in pink. Transposable elements are shown in orange within the sequence coordinate line. The sites ofP-element and EP-element insertions are indicated by gray triangles. The large square brackets from 2100 to 2480 Kb embrace the zeste-white region (Figure 2). Scale divisions are 10 Kb (bold) and 1 Kb (regular).
General Features of Gene Content
As explained in Methods, we have used two general classes of computational method to predict genes in this chromosome region: similarity-based methods and ab initio methods. Together these two approaches have enabled us to predict 277 protein-coding genes overall, of which 94 (33.9%) had been sequenced previously by the community (Table1; Figure 1B). A total of 25 genes (9%) were predicted solely by ab initio methods, a lower fraction than in the Adh region (19%). A possible reason for this difference is that we used a stricter criterion for accepting a gene predicted only by an ab initio method than did Ashburner et al. (1999). Of the predicted genes, 205 have matches with ESTs from the BDGP (Rubin et al. 2000b) and NIH (Andrews et al. 2000) projects. The fraction of previously knownDrosophila genes that had EST matches (77.1%) is the same as that of the genes predicted by sequence similarity (77.2%), and is very similar to the proportion of matches from the Adh region (71%). Assuming that the criteria used to predict genes are adequate, these figures provide a good indication for the proportion ofDrosophila genes currently represented in EST collections. Presumably the shortfall reflects mainly that the cDNAs used to generate the ESTs have been derived from a restricted number of developmental stages. The value of ESTs in confirming gene identity and splicing patterns provides a strong argument to extend the generation of EST data to other developmental stages and tissues (Andrews et al. 2000; Rubin et al. 2000b). Based on the analysis of EST hits, we identified nine genes that are alternatively spliced in their coding regions, and thus able to direct the synthesis of two or more different proteins (Table 1, asterisks). It is striking that of the 183 newly predicted genes, 55% have significant similarities with sequences in other organisms thus indicating the extent of conserved function.
Genes Identified or Predicted in the 1A–3C Interval
| Cytology | Gene symbol | Gene | HMMER | EST | Matching gene(s) | EDGP vs. joint sequence |
| EG:23E12.1 | PF01019: G_glu_transpept | GH10105 | CG17636 | 0 | ||
| EG:23E12.5 | GH15984 | CG17617 | 0 | |||
| EG:23E12.2 | PF00169: PH | LD22360 | CG17960 | B− | ||
| PF00620: RhoGAP | ||||||
| PF00621: RhoGEF | ||||||
| EG:23E12.3 | CG17707 | 0 | ||||
| EG:BACR37P7.1 | PF01762: Galactosyl_T | CK01556 | CG3038 | 0 | ||
| EG:BACR37P7.2 | PF00856: SET | LD10743 | CG2995 | 0 | ||
| PF00023: ank | ||||||
| 1A8 | † EG:BACR37P7.3 | † cin | PF00994: MoCF_biosynth | GH09380 | CG2945 | 0 |
| EG:BACR37P7.9 | PF00106: adh_short | CG13377 | A− | |||
| 1A8 | EG:BACR37P7.7 | ewg | AF171732 | CG3114 | B+ | |
| EG:BACR37P7.8 | PF00071: ras | CG13375 | B− | |||
| EG:BACR37P7.5 | bs28b06 | CG12470 | 0 | |||
| EG:125H10.1 | LP06894 | CG3777 | 0 | |||
| 1B1 | EG:125H10.2 | y | CG3757 | 0 | ||
| 1B1 | EG:125H10.3 | ac | PF00010: HLH | CG3796 | 0 | |
| 1B2 | EG:198A6.1 | sc | PF00010: HLH | CG3827 | 0 | |
| 1B3 | EG:198A6.2 | l(1)sc | PF00010: HLH | CG3839 | 0 | |
| 1B4 | EG:EG0001.1 | pcl | PF00026: asp | CG13374 | 0 | |
| 1B4 | EG:165H7.2 | ase | PF00010: HLH | CG3258 | 0 | |
| EG:165H7.1 | Cyp4g1 | PF00067: p450 | GH20504 | CG3972 | 0 | |
| 1B4 | EG:165H7.3 | l(1)Bb | LD14543 | CG3923 | D+* | |
| EG:171D11.6 | LD04586 | CG13372 | D* | |||
| CG18166 | ||||||
| CG18273 | ||||||
| EG:171D11.2 | PF00664: ABC_membrane | LD18126 | CG3156 | A− | ||
| PF00005: ABC_tran | ||||||
| † EG:171D11.1 | PF00171: aldedh | GM07535 | CG17896 | 0 | ||
| EG:171D11.5 | CG17778 | 0 | ||||
| 1B7 | † EG:171D11.3 | † svr | PF00246: Zn_carbOpept | LD28490 | CG4122 | D* |
| CG18503 | ||||||
| EG:171D11.4; EG:65F1.3 | arginase | PF00491: arginase | GH02581 | CG18104 | C+ | |
| 1B8 | † EG:65F1.2 | † elav | PF00076: rrm | HL03451 | CG4262 | 0 |
| EG:65F1.1 | GH24496 | CG4293 | 0 | |||
| 1B8 | EG:65F1.5 | Appl | PF02177: A4_EXTRA | HL03850 | CG7727 | A+ |
| 1B9 | EG:118B3.1 | vnd | PF00046: homeobox | CG6172 | 0 | |
| EG:118B3.2 | PF00307: CH | GH04661 | CG13366 | 0 | ||
| 1B13 | EG:115C2.5 | mod(r) | LP01383 | CG17828 | 0 | |
| EG:115C2.1 | PF00294: pfkB | LP11157 | CG13369 | 0 | ||
| EG:115C2.12 | LP11709 | CG18451 | 0 | |||
| EG:115C2.6 | PF00096: zf-C2H2 | LD23988 | CG17829 | 0 | ||
| 1B13 | EG:115C2.7 | RpL36 | PF01158: Ribosomal_L36e | LD01128 | CG7622 | 0 |
| 1B13 | EG:115C2.2 | l(1)lBi | LD09823 | CG6189 | 0 | |
| 1B13 | EG:115C2.9 | Dredd | PF00655: ICE_p10 | LD14339 | CG7486 | B− |
| PF00656: ICE_p20 | ||||||
| 1B13 | EG:115C2.3 | su(s) | LD06838 | CG6222 | 0 | |
| EG:115C2.8 | GH16756 | CG13367 | A− | |||
| EG:115C2.11 | GH22310 | CG16982 | B+ | |||
| EG:115C2.10 | PF00856: SET | LD03312 | CG13363 | C− | ||
| 1B13 | EG:115C2.4 | skpA | PF01466: Skp1 | LD03188 | CG16983 | 0 |
| 1B14-C1 | EG:BACR19J1.1 | sdk | PF00041: fn3 | GM02010 | CG5227 | B+ |
| PF00047: ig | ||||||
| EG:BACR19J1.2 | PF00153: mito_carr | LD09021 | CG5254 | 0 | ||
| EG:BACR19J1.3 | GH28702 | CG5273 | 0 | |||
| EG:BACR19J1.4 | RpL22 | PF01776: Ribosomal_L22e | LP05628 | CG7434 | 0 | |
| EG:34F3.2 | PF00784: MyTH4 | LD11354 | CG12467 | D | ||
| PF00169: PH | ||||||
| EG:34F3.1 | LD26268 | CG12467 | D | |||
| EG:34F3.8 | PF00957: synaptobrevin | LD05791 | CG7359 | 0 | ||
| EG:34F3.10 | CG13358 | A+ | ||||
| EG:34F3.9 | CG13359 | B− | ||||
| 1B14-C1 | EG:34F3.3 | Rbf | PF01858: RB_A | LP07395 | CG7413 | 0 |
| PF01857: RB_B | ||||||
| EG:34F3.4 | LD26306 | CG16989 | 0 | |||
| EG:34F3.5 | LP04844 | CG13360 | 0 | |||
| EG:34F3.7 | PF02366: PMT | LP01681 | CG12311 | A− C− | ||
| EG:34F3.6 | fz3 | PF01534: Frizzled | CG16785 | A− | ||
| PF01392: Fz | ||||||
| EG:BACR7A4.2 | bs33b10 | CG3713 | 0 | |||
| EG:BACR7A4.3 | PF00089: trypsin | CG11664 | 0 | |||
| EG:BACR7A4.19 | PF00651: BTB | LP01394 | CG3711 | 0 | ||
| PF01344: Kelch | ||||||
| EG:BACR7A4.6 | 1.82 | CG3034 | 0 | |||
| EG:BACR7A4.18 | PF00956: NAP_family | GH17085 | CG3708 | A+ | ||
| EG:BAC7A4.20 | LP11534 | CG3706 | 0 | |||
| EG:BACR7A4.5 | LP07093 | CG11642 | 0 | |||
| EG:BACR7A4.17 | LD33276 | CG3704 | 0 | |||
| EG:BACR7A4.16 | LD03548 | CG3026 | 0 | |||
| EG:BACR7A4.15 | GH12139 | CG3703 | A− | |||
| EG:BACR7A4.14 | PF00106: adh_short | LP06734 | CG3699 | D−* | ||
| PF00678: adh_short_C2 | ||||||
| EG:BACR7A4.13 | PF00083: sugar_tr | GH13765 | CG3690 | 0 | ||
| EG:BACR7A4.7 | PF02268: TFIIA_gamma | GM03032 | CG11639 | 0 | ||
| EG:BACR7A4.12 | PF00036: efhand | bs03d05 | CG11638 | A++ | ||
| 1E1-4 | EG:BACR7A4.8 | anon-1Ed | LD29918 | CG3021 | C− | |
| EG:BACR7A4.11 | CDC45L | LD08729 | CG3658 | 0 | ||
| 1E1-4 | EG:BACR7A4.9 | anon-1Eb | GH11273 | CG14630 | A− | |
| 1E1-4 | EG:BACR7A4.10 | su(w[a]) | PF01805: Surp | SD01276 | CG3019 | B− |
| EG:103E12.2 | GH24974 | CG14629 | 0 | |||
| EG:103E12.3 | LD08339 | CG3655 | 0 | |||
| EG:BACR42I17.12 | PF00076: rrm | CG14628 | 0 | |||
| EG:BACR42I17.1 | PF01652: IF4E | bs10b09 | CG11392 | B+ | ||
| EG:BACR42I17.2 | LP03214 | CG11378 | 0 | |||
| EG:BACR42I17.3 | CG11384 | 0 | ||||
| EG:BACR42I17.4 | bs31h12 | CG11379 | 0 | |||
| EG:BACR42I17.5 | CG14627 | A++ | ||||
| EG:BACR42I17.6 | CG14626 | A− | ||||
| EG:BACR42I17.7 | CG11380 | A++ | ||||
| EG:BACR42I17.8 | CG14625 | A+ | ||||
| EG:BACR42I17.9 | CG11381 | D | ||||
| CG14624 | ||||||
| EG:BACR42I17.10 | LP08751 | CG11382 | 0 | |||
| EG:BACR42I17.11 | PF00096: zf-C2H2 | CG11398 | 0 | |||
| EG:33C11.3 | LP06890 | CG3638 | A+ C−− | |||
| EG:33C11.2 | GM08856 | CG11403 | 0 | |||
| EG:33C11.1 | A3-3 | PF00170: bZIP | GH24653 | CG11405 | 0 | |
| EG:114D9.1 | PF00036: efhand | CG11408 | 0 | |||
| EG:114D9.2 | PF02181: FH2 | LD26058 | CG14622 | A−− | ||
| EG:190E7.1 | CG18091 | 0 | ||||
| EG:8D8.1 | GM13066 | CG11411 | 0 | |||
| EG:8D8.2 | LD34263 | CG11409 | 0 | |||
| EG:8D8.6 | PF00583: Acetyltransf | LD06467 | CG11412 | B+ | ||
| EG:8D8.8 | GM12784 | CG11418 | 0 | |||
| EG:8D8.7 | PF00335: transmembrane4 | LP04678 | CT11415 | 0 | ||
| EG:8D8.3 | PF00324: aa_permeases | LD15480 | CG12773 | 0 | ||
| EG:8D8.4 | LD08351 | CG11417 | 0 | |||
| EG:8D8.5 | png | PF00069: pkinase | CG11420 | 0 | ||
| EG:132E8.1 | PF00076: rrm | LD09340 | CG3056 | 0 | ||
| 1F | EG:132E8.2 | SNF1A | PF00069: pkinase | GH05909 | CG3051 | 0 |
| EG:132E8.3 | PF00085: thiored | LD03613 | CG3719 | 0 | ||
| EG:132E8.4 | CG11448 | 0 | ||||
| EG:49E4.1 | futsch | GH21135 | CG3064 | D* | ||
| EG:BACN32G11.1 | CG18531 | 0 | ||||
| EG:BACN32G11.2 | GH10964 | CG14785 | 0 | |||
| EG:BACN32G11.3 | PF01535: PPR | LD01992 | CG14786 | 0 | ||
| EG:BACN32G11.4 | PF00378: ECH | LP07530 | CG14787 | A− | ||
| EG:BACN32G11.5 | PF01926: MMR_HSR1 | HL05876 | CG14788 | 0 | ||
| EG:BACN32G11.6 | GH07929 | CG14789 | A− | |||
| EG:80H7.10 | GH22272 | CG14777 | 0 | |||
| EG:80H7.1 | PF00089: trypsin | — | ||||
| EG:80H7.2 | LD18706 | CG14779 | 0 | |||
| EG:80H7.3 | PF00089: trypsin | CG14780 | 0 | |||
| EG:80H7.4 | PF00071: ras | GM10914 | CG14791 | B− | ||
| EG:80H7.11 | LD02045 | CG14781 | B+ | |||
| EG:80H7.5 | PF01363: FYVE | GM03532 | CG14782 | 0 | ||
| PF00169: PH | ||||||
| 2B1-2 | EG:80H7.6 | sta | PF00318: Ribosomal_S2 | LD27557 | CG14792 | A− B C+ |
| EG:80H7.7 | PF00060: lig_chan | CG14793 | D* | |||
| EG:196F3.1 | — | |||||
| EG:196F3.3 | CG14795 | A+ | ||||
| EG:196F3.2 | PF02214: K_tetra | LD05656 | CG14783 | C+ | ||
| EG:56G7.1 | PF01607: Chitin_bind_2 | CG14796 | 0 | |||
| 2B5 | † EG:123F11.1; EG:17A9.1; EG:25D2.1 | † br | PF00651: BTB PF00096: zf-C2H2 | LP05017 | CG11491 | 0 |
| 2B6 | EG:171E4.1 | dor | LD12589 | CG3093 | 0 | |
| EG:171E4.4 | CK00326 | CG3740 | D* | |||
| EG:171E4.2 | PF00560: LRR | CG3095 | A+ C+ | |||
| EG:171E4.3 | CG3737 | 0 | ||||
| EG:73D1.1 | LD24507 | CG3791 | 0 | |||
| 2B6-7 | EG:9D2.1 | b6 | HL05401 | CG3100 | 0 | |
| EG:9D2.2 | GH23439 | CG3783 | D* | |||
| 2B6-8 | EG:9D2.3 | a6 | LD13641 | CG3771 | C− | |
| EG:9D2.4 | PF00089: trypsin | CG3795 | 0 | |||
| EG:4F1.1 | GH21860 | CG14808 | 0 | |||
| EG:BACN35H14.1 | Adar | PF02137: A_deamin | LD31451 | CG12598 | A+ | |
| PF00035: dsrm | ||||||
| EG:137E7.1 | LD19625 | CG17968 | 0 | |||
| EG:131F2.2 | PF00929: Exonuclease | CG14801 | A− | |||
| EG:131F2.3 | LP07325 | CG14812 | 0 | |||
| EG:63B12.10 | δCOP | LD30910 | CG14813 | 0 | ||
| EG:63B12.6 | GM12676 | CG14814 | A− | |||
| EG:63B12.13 | GH20211 | CG14802 | 0 | |||
| EG:63B12.5 | PF00515: TPR | GH08708 | CG14815 | 0 | ||
| EG:63B12.9 | LD13889 | CG14803 | B+ | |||
| EG:63B12.4 | PF00300: PGAM | LD30851 | CG14816 | 0 | ||
| EG:63B12.8 | LD10891 | CG14804 | 0 | |||
| EG:63B12.11 | GH01621 | CG14817 | 0 | |||
| EG:63B12.7 | PF00400: WD40 | LD02447 | CG14805 | B+ | ||
| EG:63B12.12 | LP05103 | CG14818 | 0 | |||
| 2B15 | EG:63B12.3 | trr | PF00856: SET | GM10003 | CG3848 | B++ |
| 2B15 | EG:63B12.2 | anon-2Bd | PF00252: Ribosomal_L16 | GH05976 | CG3109 | B+ |
| 2B15 | EG:86E4.6 | arm | PF00514: Armadillo_seg | LD10209 | CG11579 | A+ |
| EG:86E4.2 | PF01532: Glyco_hydro_47 | LD21416 | CG3810 | C+ | ||
| EG:86E4.3 | PF00400: WD40 | CG17766 | A− | |||
| EG:86E4.4 | LD27573 | CG3480 | 0 | |||
| 2B15 | EG:86E4.1 | eIF-2bε | PF02020: W2 | LD26247 | CG3806 | 0 |
| PF00132: hexapep | ||||||
| EG:86E4.5 | PF00783: IPPc | GH18456 | CG3573 | 0 | ||
| EG:39E1.1 | LD22420 | CG11596 | 0 | |||
| EG:39E1.3 | LP09039 | CG3857 | 0 | |||
| EG:39E1.2 | LD09945 | CG3587 | 0 | |||
| EG:BACH61I5.1 | CG3600 | 0 | ||||
| EG:133E12.2 | PF00104: hormone_rec | CG16902 | D* | |||
| PF00105: zf-C4 | ||||||
| EG:133E12.3 | PF01650: Peptidase_C13 | CG4406 | A+ | |||
| EG:133E12.4 | east | LD33602 | CG4399 | 0 | ||
| 2C3 | † EG:133E12.1 | † Actn | PF00307: CH | HL01581 | CG4376 | 0 |
| PF00036: efhand | ||||||
| PF00435: spectrin | ||||||
| 2C3 | EG:22E5.1 | usp | PF00104: hormone_rec | LD09973 | CG4380 | 0 |
| PF00105: zf-C4 | ||||||
| EG:22E5.12 | PF00097: zf-C3HC4 | CG4325 | 0 | |||
| EG:22E5.11 | PF00001: 7tm_1 | CG4322 | C+ | |||
| EG:22E5.10 | PF00001: 7tm_1 | GM02327 | CG4313 | 0 | ||
| EG:22E5.8 | PF00069: pkinase | GH06888 | CG4290 | 0 | ||
| EG:22E5.7 | LD08665 | CG4281 | D* | |||
| EG:22E5.5 | PF00355: Rieske | GH11732 | CG4199 | A+ | ||
| PF00070: pyr_redox | ||||||
| EG:22E5.6 | LD31238 | CG4194 | 0 | |||
| EG:22E5.3 | PF01137: RCT | GH07716 | CG4061 | 0 | ||
| EG:22E5.4 | PF02390: Methyltransf_4 | GM01339 | CG4045 | C+ | ||
| EG:22E5.9 | LP10820 | CG4025 | 0 | |||
| EG:67A9.2 | LD01561 | CG16903 | C−− | |||
| EG:67A9.1 | CK00561 | CG3981 | A− | |||
| 2D3 | † EG:BACN25G24.2 | † csw | PF00017: SH2 | HL03192 | CG3954 | 0 |
| PF00102: Y_phosphatase | ||||||
| 2D3 | EG:BACN25G24.3 | ph-d | PF00536: SAM | GH08934 | CG3895 | A−− B+ C+ |
| 2D3 | EG:87B1.5 | ph-p | PF00536: SAM | GH19743 | D* | |
| EG:87B1.3 | PF01565: FAD_binding_4 | GH17284 | CG3835 | 0 | ||
| 2D6 | EG:87B1.4 | Pgd | PF00393: 6PGD | GH13486 | CG3724 | 0 |
| 2D6 | EG:87B1.6 | bcn92 | CG3717 | 0 | ||
| 2D6 | EG:87B1.2 | wapl | LD29979 | CG3707 | A+ | |
| 2D6 | EG:87B1.1 | Cyp4d1 | PF00067: p450 | GH01333 | CG3656 | 0 |
| EG:152A3.3 | HL02445 | CG3630 | 0 | |||
| EG:152A3.7 | anon-2Db | CG3621 | 0 | |||
| EG:152A3.2 | Cyp4d14 | PF00067: p450 | HL05508 | CG3540 | 0 | |
| 2E1 | EG:152A3.4 | Cyp4d2 | PF00067: p450 | GH09810 | CG3466 | A− |
| 2E1 | EG:152A3.6 | Cyp4ae1 | PF00067: p450 | GH24265 | CG10755 | 0 |
| 2E1 | EG:152A3.5 | pn | GM10090 | CG3461 | 0 | |
| 2E3 | EG:152A3.1 | Nmd3 | LD13746 | CG3460 | 0 | |
| EG:17E2.1 | LD17911 | CG3457 | B− | |||
| 2E3 | EG:103B4.3 | Mct1 | PF01587: MCT | LP01643 | CG3456 | A− |
| EG:103B4.2 | LP02712 | CG18031 | D | |||
| 2E3 | EG:103B4.4 | msta | GH20239 | CG18033 | 0 | |
| 2E3 | EG:103B4.1 | Vinc | PF01044: Vinculin | LD16157 | CG3299 | 0 |
| 2E3 | EG:30B8.4 | pcx | LD27929 | CG3443 | B−− | |
| 2F1 | EG:30B8.2 | kz | GH21962 | CG3228 | 0 | |
| 2F1 | EG:30B8.5 | fs(1)K10 | LD08992 | CG3218 | 0 | |
| 2F1 | EG:30B8.7 | Or2a | CG3206 | C | ||
| 2F1 | EG:30B8.1 | crn | PF02184: HAT | LP05055 | CG3193 | 0 |
| EG:30B8.3 | PF00650: CRAL_TRIO | GM01086 | CG3191 | 0 | ||
| EG:30B8.6 | GH06335 | CG3078 | D | |||
| EG:25E8.3 | PF00400: WD40 | LD29959 | CG3071 | B+ | ||
| EG:25E8.2 | PF00179: UQ_con | LD09991 | CG2924 | A+ C− | ||
| EG:25E8.1 | PF00012: HSP70 | GH11566 | CG2918 | 0 | ||
| EG:25E8.6 | CG2879 | D | ||||
| EG:25E8.4 | GH04956 | CG2865 | 0 | |||
| EG:BACH48C10.1 | CG14050 | 0 | ||||
| EG:BACH48C10.2 | GH19593 | CG2854 | C− | |||
| 2F6 | EG:BACH48C10.3 | phl | PF00130: DAG_PE-bind | GH03557 | CG2845 | B+ |
| PF02196: RBD | ||||||
| PF00069: pkinase | ||||||
| EG:BACH48C10.6 | CG14048 | 0 | ||||
| 2F6 | EG:BACH48C10.5 | ptr | GH02860 | CG2841 | A+ | |
| EG:BACH48C10.4 | GH27724 | CG14047 | D | |||
| EG:BACH7M4.1 | SD05785 | CG14045 | A−− | |||
| EG:BACH7M4.2 | PF00168: C2 | CK01827 | CG14045 | A− C− | ||
| PF00505: PDZ | ||||||
| EG:BACH7M4.4 | CG12496 | C− | ||||
| 3A2 | EG:BACH7M4.5 | gt | CG7952 | 0 | ||
| 3A3 | † EG:BACH59J11.1 | † tko | PF00164: Ribosomal_S12 | GM03810 | CG7925 | 0 |
| EG:BACH59J11.2 | PF00041: fn3 | SD01373 | CG13756 | B+ | ||
| 3A3 | EG:BACH59J11.3 | z | CG7803 | 0 | ||
| EG:BACR25B3.11 | pcan | PF0008: EGF | GM03359 | CG7981 | D* | |
| PF00047: ig | ||||||
| PF00054: laminin_G | ||||||
| PF00057: ldl_recept_a | ||||||
| EG:BACR25B3.10 | PF00047: ig | GM02481 | CG7981 | D* | ||
| EG:BACR25B3.1 | PF00047: ig | GM06086 | CG7981 | A++ C− | ||
| PF00052: laminin_B | ||||||
| PF00053: laminin_EGF | ||||||
| PF00057: ldl_recept_a | ||||||
| EG:BACR25B3.2 | PF00057: ldl_recept_a | CG12497 | A+ B+ | |||
| EG:BACR25B3.3 | PF00002: 7tm_2 | CG13758 | D | |||
| EG:BACR25B3.4 | PF01813: ATP-synt_D | GH28048 | CG8310 | D | ||
| EG:BACR25B3.5 | GH02552 | CG13759 | B+ | |||
| EG:BACR25B3.6 | LD41675 | CG13760 | A−− | |||
| EG:BACR25B3.7 | wds | PF00400: WD40 | LD30385 | CG17437 | 0 | |
| 3A8 | EG:BACR25B3.8 | egh | CG9659 | 0 | ||
| 3A8 | EG:BACR25B3.9 | Klp3A | PF00225: kinesin 14 | LD21815 | CG8590 | 0 |
| 3A9 | EG:BACR7C10.3 | mit(1)15 | LD31038 | CG9900 | 0 | |
| EG:BACR7C10.4 | Bzd | PF01753: zf-MYND | CG13761 | C+ | ||
| EG:BACR7C10.6 | PF00335: transmembrane4 | GH15125 | CG10742 | 0 | ||
| EG:BACR7C10.1 | LD08769 | CG9904 | 0 | |||
| EG:BACR7C10.7 | CG13762 | B− | ||||
| EG:BACR7C10.2 | PF00613: PI3Ka | GH26308 | CG10260 | D | ||
| PF00454: PI3_PI4_kinase | ||||||
| 3B1 | EG:155E2.3 | sgg | PF00069: pkinas3 | GM02018 | CG2621 | A+ |
| 3B2 | EG:155E2.2 | HLH3B | PF00010: HLH | CG2655 | 0 | |
| EG:155E2.5 | GH07966 | CG2652 | 0 | |||
| 3B2 | † EG:155E2.4 | † per | PF00989: PAS | GH01975 | CG2647 | A− B+ |
| 3B2 | EG:155E2.1 | anon-3B1.2 | CG2650 | B− | ||
| EG:100G10.7 | anon-3Ba | PF0004: AAA | GH01006 | CG2658 | 0 | |
| PF01434: Peptidase_M41 | ||||||
| EG:100G10.6 | PF00628: PHD | HL01595 | CG2662 | 0 | ||
| EG:100G10.5 | anon-3Bb | LD37122 | CG2675 | A+ | ||
| EG:100G10.3 | PF01008: IF-2B | CG2677 | 0 | |||
| EG:100G10.4 | GH11163 | CG2680 | B+ | |||
| EG:100G10.2 | GH02982 | CG2681 | B− | |||
| EG:100G10.1 | LD25954 | CG2685 | 0 | |||
| EG:100G10.8; EG:95B7.10 | LD34251 | CG2695 | 0 | |||
| 3B4 | EG:95B7.9 | anon-3Bd | GH08386 | CG2701 | 0 | |
| 3C1 | EG:95B7.8 | fs(1)Yb | CG2706 | 0 | ||
| 3C1 | EG:95B7.4 | fs(1)Ya | LD47547 | CG2707 | A− | |
| EG:95B7.5 | CG2709 | 0 | ||||
| 3C1 | EG:95B7.6 | dwg | PF00096: zf-C2H2 | LD08032 | CG2711 | 0 |
| EG:95B7.3 | LD05179 | CG2713 | 0 | |||
| EG:95B7.7 | anon-3Be | PF00096: zf-C2H2 | LD39664 | CG2712 | 0 | |
| 3C2 | EG:95B7.2 | crm | PF00249: myb_DNA- | LD09365 | CG2714 | 0 |
| binding | ||||||
| EG:95B7.1 | PF00804: Syntaxin | CG2715 | 0 | |||
| EG:BACN33B1.2 | HL08104 | CG2766 | D* | |||
| CG2716 | ||||||
| 3C2 | EG:BACN33B1.1 | w | PF00005: ABC_tran | GH06126 | CG2759 | 0 |
| EG:BACR43E12.1 | CG12498 | 0 | ||||
| EG:BACR43E12.7 | GM07661 | CG14416 | 0 | |||
| EG:BACR43E12.6 | CG14417 | 0 | ||||
| EG:BACR43E12.5 | CG14417 | 0 | ||||
| EG:BACR43E12.4 | PF00569: ZZ | GH01442 | CG3526 | A++ | ||
| EG:100G7.6 | CG3588 | A−− C+ | ||||
| EG:100G7.5 | CG14424 | 0 | ||||
| 3C5 | EG:100G7.1 | anon-3Ca | CG18089 | 0 | ||
| 3C5 | EG:100G7.2 | anon-3Cb | CG3591 | 0 | ||
| EG:100G7.3 | CG3598 | 0 |
[i] All known or predicted genes have a symbol in the formEG:#, where the # indicates the clones on which they were first discovered followed by a dot and integer. Genes previously known are also shown with their FlyBase symbols and, if determined, cytological locations. The EST column indicates a matching EST sequence from either the BDGP collection or B. Oliver's testes-derived EST collection (as submitted to GenBank; see Andrews et al. 2000). Only one cDNA clone name is listed for each gene. The column headed “Matching Gene(s)” indicates the matching gene from the Joint Sequence. The column headed “EDGP vs. Joint Sequence” indicates the result of comparing the EDGP and Joint Sequence at the predicted protein level. In this column, 0 indicates identity or <1% difference in sequence; A, that the sequences differ in their predicted start sites; B, that they differ in their predicted termination sites; and C, that they differ by a predicted exon or intron. A ‘D’ indicates that the gene models predicted by us and by the Joint Sequence differ very markedly; an accompanying asterisk indicates that we have evidence that the EDGP model is the more correct (see text). A plus sign indicates the EDGP sequence is longer than the CG sequence; a minus sign indicates that it is shorter. For more details see the supplementary data. Only positive hits of known or predicted proteins to PFAM are shown (see text). A dagger before a gene symbol indicates a gene with alternatively spliced messages.
The average size of the coding regions of the genes predicted in the tip of the X chromosome is 1.8 Kb, with 2.7 introns per gene. The gene with the highest number of introns isEG:BACR25B3.1 (26 introns in the coding region). The average size of the introns is 475 bp, with the shortest being 26 bp (EG:63B12.3) and the longest being 34,401 bp (sidekick [sdk], EG:BACR19J1.1). The calculated average number of introns per gene in this chromosomal region is consistent with previous studies that have indicated the majority of Drosophila genes contain one or two small introns located near their 5′ ends (although exon and intron numbers will have been underestimated as ab initio gene prediction methods will not predict untranslated exons). There are, however, some exceptionally large genes. These include sdk, which encodes an immunoglobulin-C2 domain protein, and is required to prevent the“mystery cell” of the developing eye disc differentiating as a photoreceptor (Nguyen et al. 1997). This gene, sequenced previously as a cDNA, covers 60 Kb and includes at least 14 exons. Another very large gene is futsch (EG:49E4.1), covering 18 Kb and encoding a protein of 5327 amino acids predicted to encode a microtubule-associated protein, on the basis of its similarity with human MAP1B (SWISS-PROT:P46821), which is only half the size. RecentlyHummel et al. (2000) have shown that futsch encodes the well-known Drosophila neural antigen 22C10. Four other genes have large transcription units: Appl, 35.1 Kb; br, 27.7 Kb: EG25B3.1, 20.0 Kb; and csw, 17.4 Kb. The overall GC content of this collection of genes from the tip of theX chromosome is significantly lower (45.5%) than the overall GC content of the genes in the Joint Sequence (56.1%).
One of the surprising results of the analysis of the Adhregion sequence (Ashburner et al. 1999) was the number of genes predicted to be included within the introns of other genes (8%). These were most frequently, but not exclusively, arranged as anti-parallel transcription units. The present analysis of the tip of theX permits a comparison with another segment of genomic DNA. We predict four nested genes. This corresponds to 1.4 % of all of the genes we identify. This is probably an underestimate, because ab initio gene prediction programs do not predict genes within genes.
One group of duplicated genes worthy of specific mention in this region are the cytochrome P450s, small monooxygenases often involved in the metabolism of xenobiotic compounds. Eighty-seven genes encoding these microsomal or mitochondrial enzymes had been identified in the essentially complete Joint Sequence of D. melanogaster (Nelson 2000). Only two (l(2)35Fb in the Adh region [Ashburner et al. 1999] and disembodied [Chávez et al. 2000]) have been associated with a mutant phenotype, although polymorphisms at others have implicated them in differential resistance to DDT and other compounds (Berge et al. 1998). One characteristic of the genes encoding these proteins is that they often occur in small clusters, indicating an expansion of the gene family by duplication. In region 1–3 we have identified five cytochrome P450-encoding genes (Cyp4g1, Cyp4d1, Cyp4d2, Cyp4ae1, and Cyp4d14); of these, the latter three are in tandem within about 7.5 Kb at 2E1 andCyp4d1 is some 12 Kb distal at 2D6. The Cyp4g1 (at 1B4) gene appears to be more abundantly transcribed than any other P450 gene in D. melanogaster, at least judging from the large number of its EST sequences (59; Nelson 2000).
We have analyzed all of the known or predicted proteins by several methods, most extensively by BLASTP against data sets derived from SWISS-PROT and TrEMBL sorted by taxonomic origin (seeAshburner et al. 1999). We have also analyzed all of the protein sequences by various methods to detect protein motifs, and domains. Overall, 71% of the known or predicted proteins have aBLASTP match with an expectation of 10−7 or less when compared with nondrosophilid protein sequences. Similarly, 137 contain at least one known motif or domain (other than the PROSITE Nuclear Localization Signal profile) as determined by matches against InterPro (http://www.ebi.ac.uk/interpro/). These numbers are, of course, both preliminary and transitory. All of these data have been communicated to FlyBase and can be found in the supplementary data (see Methods). We have chosen only to present the PFAM hits in Table 1, as an indication of the data obtained.
As we have discussed previously (Benos et al. 2000), examples of 12 different transposable elements were identified within the region analyzed: 412, roo, Doc, FB, jockey, mgd1, Tirant, S-element, 1360, Burdock, blastopia, and yoyo. It is possible that more transposable elements may be present in the region; however, we have not identified them molecularly.
Chromosomal Regions of Particular Interest
The achaete-scute Complex
The achaete-scute complex (AS-C) comprises a region of ∼95 Kb (between y and Cyp4g1; chromosomal bands 1B1–4) defined by the physical mapping of >110 achaete(ac) and scute (sc) mutations associated with chromosomal breakpoints or insertions of transposable elements (Campuzano et al. 1985; Ruiz-Gómez and Modolell 1987).ac and sc alleles either suppress formation of combinations of bristles (and other cuticular sensory organs) or cause the generation of ectopic bristles (Garcı́a-Bellido 1979). Most mutant alleles of these genes are viable, although an adjacent vital genetic function, lethal-of-scute (l(1)sc) (Muller 1935), is uncovered by internal deficiencies of the complex such asDf(1)sc4Lsc9R. Embryos homozygous for these deficiencies have a defective CNS. Another genetic function,asense (ase), has also been mapped within theAS-C (Dambly-Chaudière and Ghysen 1987; Jiménez and Campos-Ortega 1987) and found to be important for the development of the larval external sensory organs. Previous molecular characterization of the AS-C (for review, see Campuzano and Modolell 1992) have shown that the functions defined by genetic analysis correspond to single genes, arranged over 85 Kb in distal-proximal order: ac, sc, l(1)sc and ase. All four genes encode related transcription factors of the bHLH family, which are partially redundant in their functions, being required for epidermal cells to become neural precursors. They have evidently evolved by tandem duplication.
Our new analysis of the sequence in the region between y andCyp4g1 predicts the existence of only the four AS-Cgenes and the previously known pepsinogen-like (pcl) gene, a nonvital gene located between l(1)sc and ase, which is expressed in the larval gut (Campuzano et al. 1985; González 1989; S. Romani, unpubl.). We have not been able to detect the existence of two postulated genes, anon-1Ba (=T7) near sc and anon-1Bc (=T9), located just distal to Cyp4g1 (Villares and Cabrera 1987; Alonso and Cabrera 1988). These genes were also not annotated in the Joint Sequence. A further gene (anon-1Be), predicted previously to be located between y and ac giving rise to several transcripts (5–0.9 Kb) (Chia et al. 1986) present in the nuclei of the embryonic vitellum (L. Balcells and J. Modolell, unpubl.) has also not been confirmed by either genomic annotation study. This is most likely a nonvital gene as a large part of it is deleted in the viable Df(1)ac1. Curiously, it harbors within its transcription unit the enhancer that drives ac and scexpression in the proneural cluster that gives rise to the dorsocentral bristles (Garcı́a-Garcı́a et al. 1999).
The broad Complex
In region 2B1–10 of the polytene X chromosome, an ecdysterone-induced puff forms in the late third instar larva (Becker 1962; Ashburner 1969). A large number of lethal and visible mutations were recovered by Kiss, Zhimulev, and colleagues that mapped to this region (Zhimulev et al. 1995). The visibles included mutations that affected wing morphology (broad alleles) and those that reduced the number of chaetae on the palpus (rdp alleles). Several different lethal complementation groups were characterized and it became clear that the visible alleles were simply hypermorphic alleles of lethal loci. The complementation patterns between all of the available alleles in what became known as the broad complexsuggested four loci, br, rdp, l(1)2Bc, andl(1)2Bd, with several mutations failing to complement mutations at more than one of these. This is not, however, the result of a complex of genes, rather of a single gene (broad) with a complex pattern of alternatively spliced transcripts. This gene encodes a family of C2H2 Zinc-finger transcription factors (DiBello et al. 1991), the different isoforms being the products of differentially spliced primary transcripts that share common carboxy-terminal exons. In our analysis, this gene covers nearly 30 Kb and, judging from the available cDNAs and EST sequences, encodes four different isoforms. It is known that these have temporally and spatially different expression patterns (Bayer et al. 1996, 1997; Tzolovsky et al. 1999). The differential effects of individual mutations on these isoforms explains both the different phenotypes and the apparent genetic complexity of the broad locus.
The zeste-white Region
The discovery of polytene chromosomes in the larvae ofDrosophila in the early 1930's was a major event in the history of genetics. These chromosomes are characterized by a nonperiodic pattern of darkly staining bands and lightly staining interbands, reflecting differences in the degree of DNA packing. These patterns are both colinear with the genetic map, as proven by Bridges (1937) and extraordinarily stable; they can be recognized in species that have diverged many millions of years ago. The detailed maps of Bridges (see Lefevre 1976; Sorsa 1988) enumerated 5072 polytene chromosome bands (and, hence, interbands). Bridges suggested, somewhat tentatively, that there may be a one-to-one correspondence between these bands and genes, a hypothesis that became known as the “one band/one gene hypothesis”. A prediction of this hypothesis was that Drosophila had ∼5000 genes. This idea was apparently supported by estimates of the number of vital loci on the X chromosome, ∼1000 or ∼5000 for the genome as a whole (Lea 1955; Lefevre and Watkins 1986). Further apparent confirmation of the one band/one gene hypothesis came from a number of attempts to “saturate” small regions of the genome with mutations, and hence estimate the number of genes in that region (Alikhanian 1937). Most famous of these experiments was that of Judd and students (Judd et al. 1972; Young and Judd 1978) who studied a small region of the distal X chromosome between bands 3A2 and 3C2. By saturation mutagenesis in this 16-band region, Judd and colleagues, and subsequent studies (e.g., Lim and Synder 1974) defined 20 genes, of which 15 were vital. A number of other studies also concluded that the ratio between gene and band number was about one (Zhimulev 1999). It is now clear that, although the number of vital loci inDrosophila is indeed ∼5000, the use of lethal mutations to define genes results in a substantial underestimate; only about one-third of genes are vital.
The complete sequence of the tip of the X chromosome now gives us the chance to review the important study of Judd and colleagues with a molecular perspective (see also Judd's own recent historical review, Judd 1998). The region between the genesgiant and white studied by Judd et al. (thezeste-white region) is 360 Kb in length and is predicted to contain 45 genes (Fig. 2). It is indeed remarkable that conventional genetic analyses had identified 20 of these. Of these 20, 12 can be placed directly on the genetic map, by virtue of identity of sequence; the remaining eight genes, known only from lethal mutations, have not been sequenced independently.
The zeste-white interval. The top is a reproduction of Figure 5 from Judd et al. (1972) showing the polytene chromosome region 3A–3C and the complementation groups discovered by mutational analysis. Below this projections are made onto the interval 2100 Kb to 2480 Kb of the EDGP sequence showing the correspondence between the genetic analysis and the genes known or predicted in this region from sequence analysis.
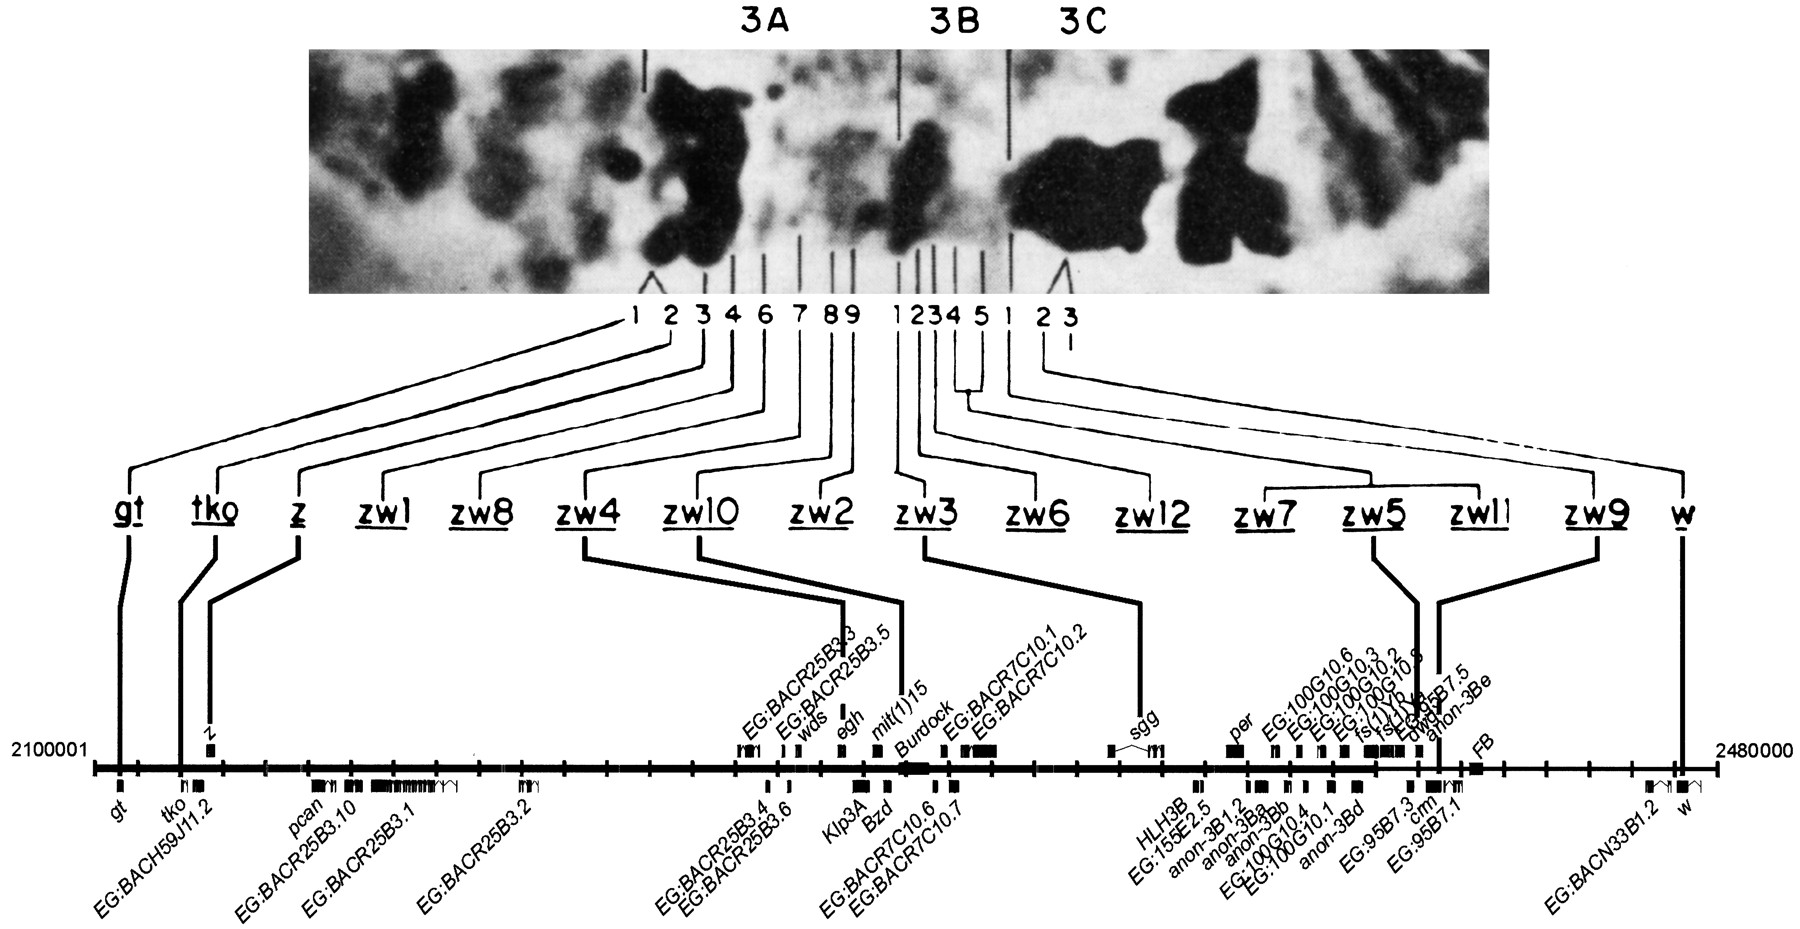
Unraveling the famous zeste-white region in the ultimate detail of its complete DNA sequence leaves major questions concerning the chromomeric structure of polytene chromosomes unanswered, of course. The banding pattern is attributable to aperiodicities in the packing ratio of the DNA, associated with proteins, in chromatin. Does this pattern have any functional significance whatsoever? No answer to this question can yet be given. How is the banding pattern determined? At one level the answer to this is obvious, by the DNA sequence. We have already described an inverted repeat sequence in the chromosomal DNA flanking the broad complex that could account for the unusual chromosomal banding pattern of this region (Benos et al. 2000). However, more subtle aspects of DNA sequence may define the domains of the majority of polytene chromosome bands, and the full answer to this problem will require considerable further analysis.
P-element Insertions
The majority of P-element screens to have been carried out to date have been performed on the autosomes. Spradling and colleagues (1999) have described their attempts to consolidate a number of suchP-element collections, including a large collection of lethal P-element insertions on the second chromosome (Török et al. 1993). Similarly, the EDGP have described a collection of lethal insertions on chromosome 3 (Deak et al. 1997). We have begun to generate a comparable collection ofP-element insertion mutants on the X chromosome in anticipation of their value for functional genomics. The initial group of mutants corresponds to ∼500 lethal insertions that have been mapped by hybridization of P-element probes to polytene chromosomes in situ. The characterization of this collection will be presented elsewhere. We have localized the insertion sites for 64P-element-induced lethal mutations that map to divisions 1–3, and determined the gene(s) whose function is likely to be affected by each insertion (Table 2). We have carried out a similar computational analysis on a collection of random EP-element insertions sequenced by the BDGP (Rørth et al. 1998). Forty-seven of these had been mapped to divisions 1–3 by in situ hybridization; this is a density of one element per 55 Kb, about twice that found for EP-elements in the Adh region (1/108 Kb). This difference in density is not due to the existence of major hotspots for insertion of EP-elements on theX chromosome tip, nor to a higher proportion of the insertions on the X tip being outwith genes (in both regions ∼47% of EP-element insertions are within genes).
P-element Insertions in Divisions 1–3
| Insertion line | EMBL-Bank accession no. | Cytology | Cosmid or BAC | Hits to gene |
| l(1)G0142 | AJ299992 | 1B1-2 | BACR37P7 | cin |
| l(1)G0399 | AJ299993 | — | cos171D11 | EG:171D11.6 |
| EP(1)1320 | AQ073187 | 1B5-6 | cos171D11 | EG:171D11.1 |
| EP(1)1398 | AQ073214 | 1B5-6 | cos171D11 | EG:171D11.1 |
| EP(1)0356 | AQ025323 | 1B7-8 | cos171D11 | svr |
| l(1)G0319 | AJ299994 | 1B7-10 | cos65F1 | elavand arginase |
| l(1)G0031 | AJ299996 | 1B | cos65F1 | elavandarginase |
| EP(1)1117 | AQ025390 | 1B7-8 | cos65F1 | elavandarginase |
| EP(1)0452 | AQ025344 | 1B7-8 | cos65F1 | elavandarginase |
| l(1)G0471 | AJ299997 | 1B11-14 | cos115C2 | BetweenRpL36 andl(1)Bi |
| EP(1)1412 | AQ025449 | 1B12-14 | cos115C2 | Dredd |
| EP(1)1216 | AQ254762 | 1B13-14 | cos115C2 | EG:115C2.10 |
| l(1)G0037 | AJ300000 | 1C | cos115C2 | skpA |
| l(1)G0109 | AJ299999 | 1C | cos115C2 | skpA |
| l(1)G0058 | AJ299998 | 1C | cos115C2 | skpA |
| l(1)G0389 | AJ300001 | 1C | cos115C2 | skpA |
| EP(1)0369 | AQ025326 | 1C1-3 | BACR19J1 | sdk |
| EP(1)1467 | AQ025484 | 1C1-3 | BACR19J1 | EG:BACR19J1.3 |
| l(1)G0115 | AJ300002 | 1C1-3 | BACR19J1 | RpL22 |
| l(1)G0422 | AJ300003 | 1C | BACR19J1 | RpL22 |
| l(1)G0451 | AJ300004 | 1C | BACR19J1 | RpL22 |
| EP(1)1600 | AQ025529 | 1D1-2 | BACR7A4 | —[ii] |
| EP(1)1498 | AQ073221 | 1D1-2 | BACR7A4 | —[iii] |
| l(1)G0132 | AJ300005 | 1D | BACR7A4 | EG:BACR7A4.6 |
| l(1)G0452 | AJ300006 | — | BACR7A4 | EG:BACR7A4.5 |
| l(1)G0296 | AJ300008 | 1E | BACR7A4 | EG:BACR7A4.15 |
| EP(1)1392 | AQ025435 | 1E1-2 | BACR7A4 | anon-1Ed |
| EP(1)1594 | AQ025523 | 1E3-4 | BACR42I17 | —[iv] |
| EP(1)0773 | AQ025356 | 1E3-4 | BACR42I17 | —[v] |
| EP(1)1543 | AQ073253 | 1E3-4 | BACR42I17 | —[v] |
| EP(1)1615 | AQ025541 | 1E3-4 | BACR42I17 | —[v] |
| EP(1)1443 | AQ254774 | 1E3-4 | BACR42I17 | —[v] |
| EP(1)1312 | AQ073181 | 1E3-4 | BACR42I17 | EG:BAC42I17.10 |
| EP(1)1090 | AQ025382 | 1E3-4 | cos33C11 | EG:33C11.3 |
| EP(1)1325 | AQ073191 | 1E3-4 | cos33C11 | EG:33C11.3 |
| EP(1)0964 | AQ025366 | 1E3-4 | cos33C11 | EG:33C11.3 |
| EP(1)1542 | AQ073252 | 1F1-2 | cos114D9 | —[vi] |
| l(1)G0302 | AJ300009 | — | cos190E7 | —[vii] |
| EP(1)1336 | AQ073199 | 1F1-2 | cos8D8 | EG:8D8.1 |
| l(1)G0105 | AJ300010 | 1F1 | cos8D8 | EG:8D8.8 |
| EP(1)1419 | AQ025455 | 2A1-2 | cos132E8 | —[viii] |
| l(1)G0431 | AJ300011 | 2A | BACN32G11 | EG:BACN32G11.5 |
| l(1)G0044 | AJ300013 | 2B1-4 | cos80H7 | EG:80H7.2 |
| l(1)G0012 | AJ300012 | 2A1-2 | cos80H7 | EG:80H7.2 |
| l(1)G0130 | AJ300015 | 2B1-4 | cos80H7 | sta |
| l(1)G0129 | AJ300014 | 2B1-4 | cos80H7 | sta |
| l(1)G0448 | AJ300016 | 2B1-4 | cos80H7 | sta |
| EP(1)1515 | AQ073234 | 2B3-4 | cos17A9 | br |
| l(1)G0318 | AJ300017 | 2B1-8 | cos17A9 | br |
| l(1)G0401 | AJ300018 | 2B1-8 | cos17A9 | br |
| l(1)G0018 | AJ300019 | 2B1-4 | cos17A9 | br |
| l(1)G0042 | AJ300020 | 2B1-8 | cos17A9 | br |
| l(1)G0284[ix] | AJ300021 | 2B1-8 | cos9D2 | a6 |
| AJ300022 | ||||
| l(1)G0051 | AJ300023 | 2B | cos131F2 | EG:63B12.10 |
| l(1)G0450 | AJ300024 | 2B | cos131F2 | EG:63B12.10 |
| l(1)G0301 | AJ300025 | 2B | cos131F2 | EG:63B12.10 |
| EP(1)1444 | AQ025468 | 2B13-14 | cos63B12 | EG:63B12.4 |
| EP(1)1190 | AQ025400 | 2B13-14 | cos63B12 | EG:63B12.12 |
| l(1)G0355 | AJ300026 | 2C1-2 | cos63B12 | trr |
| l(1)G0192 | AJ300027 | 2B | cos63B12 | arm |
| l(1)G0234 | AJ300264 | 2B7-10 | cos63B12 | arm |
| l(1)G0410 | AJ300028 | — | cos86E4 | arm |
| l(1)G0220 | AJ300029 | 2B13-C2 | cos86E4 | BetweenEG:86E4.2 andEG:86E4.3 |
| EP(1)1232 | AQ254763 | 2B16-18 | cos39E1 | —[x] |
| EP(1)0427 | AQ025337 | 2C1-2 | cos133E12 | EG:133E12.3 |
| l(1)G0014 | AJ300031 | 2C1-2 | cos133E12 | east |
| l(1)G0500 | AJ300032 | 2C1-2 | cos133E12 | east |
| l(1)G0100 | AJ300033 | — | cos133E12 | Actn |
| l(1)G0077 | AJ300034 | 2C | cos22E5 | Actn |
| EP(1)1193 | AQ025401 | 2C7-8 | cos22E5 | usp |
| EP(1)1529 | AQ073244 | 2C7-8 | cos22E5 | BetweenEG:22E5.11 and EG:22E5.10 |
| EP(1)1631 | AQ025553 | 2C7-8 | cos22E5 | BetweenEG:22E5.11 and EG:22E5.10 |
| l(1)G0360 | AJ300037 | 2C7-D4 | cos67A9 | BetweenEG:67A9.2 and EG:67A9.1 |
| l(1)G0310 | AJ300038 | 2D | cos67A9 | BetweenEG:67A9.2 and EG:67A9.1 |
| l(1)G0066 | AJ300039 | 2C | cos67A9 | BetweenEG:67A9.2 and EG:67A9.1 |
| l(1)G0333 | AJ30040 | — | cos67A9 | BetweenEG:67A9.2 and EG:67A9.1 |
| l(1)G0158 | AJ300035 | 2D1-2 | cos67A9 | EG:67A9.1 |
| l(1)G0170 | AJ300041 | 2D1-2 | BACN25G24 | csw |
| l(1)G0171 | AJ300042 | 2C7-D2 | BACN25G24 | csw |
| l(1)G0458 | AJ300043 | 2E | cos87B1 | ph-d |
| l(1)G0385 | AJ300044 | 2E | cos87B1 | Pgd |
| EP(1)1460 | AQ025479 | 2F1-2 | cos103B4 | BetweenVinc andpcx |
| EP(1)0426 | AQ025336 | 2F1-2 | cos30B8 | pcx |
| l(1)G0144 | AJ300045 | 2F | cos25E8 | EG:25E8.3 |
| EP(1)1596 | AQ025525 | 2F1-2 | cos25E8 | EG:25E8.2 |
| EP(1)1125 | AQ254758 | 2F4-5 | cos25E8 | EG:25E8.4 |
| EP(1)1606 | AQ025534 | 2F4-5 | cos25E8 | EG:25E8.4 |
| l(1)G0226 | AJ300046 | 2F | cos25E8 | EG:25E8.4 |
| l(1)G0475 | AJ300047 | 3A1-2 | BACH48C10 | phl |
| EP(1)1605 | AQ025533 | 3A1-2 | BACH48C10 | ptr |
| EP(1)1174 | AQ254760 | 3A1-2 | BACH7M4 | EG:BACH7M4.2 |
| EP(1)1385 | AQ025430 | 3A3-4 | BACR25B3 | —[xi] |
| EP(1)1447 | AQ025470 | 3A3-4 | BACR25B3 | pcan |
| EP(1)1619 | AQ025543 | 3A3-4 | BACR25B3 | pcan |
| l(1)G0023 | AJ300049 | 3A1-4 | BACR25B3 | —[xii] |
| l(1)G0374 | AJ300050 | 3A1-4 | BACR25B3 | —[xii] |
| EP(1)1160 | AQ025397 | 3A3-4 | BACR25B3 | —[xii] |
| l(1)G0377 | AJ300053 | 3A1-4 | BACR25B3 | —[xii] |
| l(1)G0211 | AJ300052 | 3A1-4 | BACR25B3 | —[xii] |
| l(1)G0412 | AJ300056 | 3A3-4 | BACR25B3 | —[xii] |
| l(1)G0271 | AJ300055 | 3A3-4 | BACR25B3 | —[xii] |
| l(1)G0362 | AJ300057 | 3A1-4 | BACR25B3 | —[xiii] |
| l(1)G0251 | AJ300060 | 3A3-4 | BACR25B3 | EG:BACR25B3.7 |
| EP(1)0804 | AQ025360 | 3A5-6 | BACR25B3 | egh[xiv] |
| EP(1)1379 | AQ073212 | 3B1-2 | BACR7C10 | sgg[xv] |
| EP(1)1576 | AQ025509 | 3A8-9 | BACR7C10 | sgg[xv] |
| l(1)G0335 | AJ300062 | 3B1-2 | BACR7C10 | sgg[xv] |
| l(1)G0263 | AJ300061 | 3B1-2 | BACR7C10 | sgg[xv] |
| l(1)G0183 | AJ300063 | 3A1-4 | BACR7C10 | sgg[xv] |
| l(1)G0055 | AJ300064 | 3B1-2 | BACR7C10 | sgg[xvi] |
| EP(1)1362 | AQ025419 | 3B1-2 | cos155E2 | BetweenEG:155E2.5 and per |
[i] A list of the P-element insertions from the EP collection (Rørth et al. 1998) and the Göttingen screen (see Methods) in region 1A–3C of the X chromosome. For each element we show the EMBL-Bank accession no. of its flanking sequence, its cytological location, the corresponding cosmid or BAC (see Fig. 1A), and the gene predicted, on the basis of its position, to be mutant (see text).
[ii] EP(1)1600 lies ∼19 Kb from the 5′ end ofEG:34F3.1.
[iii] EP(1)1498 lies ∼30 Kb from the 5′ end ofEG:BACR7A4.6.
[iv] EP(1)1594 lies ∼11 Kb from the 5′ end ofEG:BACR42I17.2.
[v] These four EP-elements lie between two genes: ∼5 Kb from the 5′ end of EG:BACR42I17.1 and ∼7 Kb from the 5′ end of EG:BACR42I17.2.
[vi] EP(1)1542 lies between the 3′ ends ofEG:114D9.1 and EG:114D9.2. It is ∼33 Kb from the 5′ end of EG:8D8.1.
[vii] l(1)G0302 lies at the 3′ end ofEG:190E7.1. It is ∼14 Kb from the 5′ end ofEG:114D9.2.
[viii] EP(1)1419 lies ∼19 Kb from the 5′ end ofEG:132E8.3.
[ix] l(1)G0284 contains two P-elements 40 Kb apart.
[x] EP(1)1232 lies ∼11.5 Kb from the 5′ end ofEG:39E1.3.
[xi] EP(1)1385 lies ∼15 Kb from the 5′ end ofEG:BACH59J11.2.
[xii] This group of six P-elements plus oneEP-element lie ∼10 Kb from the 5′ end ofEG:BACR25B3.1.
[xiii] l(1)G0362 lies ∼19 Kb from the 5′ end ofEG:BACR25B3.2
[xiv] EP(1)0804 lies ∼7 Kb from the 5′ end ofegh.
[xv] This group of two EP-elements plus threeP-elements lie ∼16 Kb from the 5′ end ofsgg.
[xvi] l(1)G0055 lies ∼12.5 Kb from the 5′ end of sgg.
From a total of 111 P-element insertions that we have located within the region analyzed, 41% fall in regions in which they are expected to affect the expression of genes already known, whereas 50% are expected to affect the expression of predicted genes. These expectations are based on the positions of the P-elementinsertion either within transcribed regions or within 5 Kb 5′ to these. Some insertions might affect two different genes, one on either side of the insertion (Table 2). Only 13 elements or clusters of elements map more distantly, 7–33 Kb 5′ to the nearest known or predicted gene (footnotes in Table 2; of these, five elements or groups were selected as lethal, but may or may not cause the lethality).
Comparison with the Joint Sequence
The determination of the sequence and gene annotation of chromosomal divisions 1–3 was completed and submitted to the EMBL-Bank by February 7, 2000, six weeks before the publication and release of the annotated Joint Sequence of the D. melanogaster genome in March 2000 (Adams et al. 2000). Although preexisting gene features were taken into account during the analysis of the Joint Sequence, these are essentially independent annotation experiments that can be compared. Moreover, direct comparison of the nucleotide sequence determined by the EDGP with the Joint Sequence, allows one to assess some of the strengths and weaknesses of the two different sequencing strategies. We have compared both individual gene predictions and the overall sequence between these two studies.
Comparison of Gene Predictions
We have identified 277 protein coding genes in the region 1A–3C, including 94 genes that had been known previously. There are 275 genes common to both studies; two, namely EG:80H7.1 andEG:196F3.1, have no corresponding prediction in the Joint Sequence. Neither of these two predictions are very strong (in terms of their GeneFinder and/or Genscan scores; see Methods), but both contain trypsin protein motifs (EG:196F3.1 has only a PROSITE match whereasEG:80H7.1 has both PROSITE and PFAM matches). There are 33 genes predicted on the Joint Sequence that are absent from the EDGP annotation. Some (13) of these predictions were also seen in the EDGP analysis but were excluded due to their low scores and lack of other supporting evidence (see Methods). We have examined the data for the remaining 20 and consider these to be overpredictions in the Joint Sequence, for a variety of reasons (see supplementary data).
We have carefully compared the known or predicted amino acid sequence of all genes between the annotated Joint Sequence and our analysis (Table 1). At the level of their predicted proteins, 60% of the 275 genes in common are identical or differ by no more than 1% of their amino-acid residues (class 0); 31.3% have one or more minor differences, for example in the choice of ATG or stop codon or in an internal exon (classes A–C); 8.7% (24 genes) have major differences in their structure between the two studies (class D). We have analyzed these 24 in detail; for 10 of them we cannot make a decision, based on the available data, as to which interpretation is the better. However, for the remaining 14 (i.e., 5.1% of the total number of genes) the EDGP model is the more correct, based on the EST data. (Note that the Joint Sequence analysis did not use all available ESTs, as noted in Methods.) Some of the class C differences (Table 1) in gene models may reflect different splice variants of the same gene.
Since the submission of version 1.0 of the Joint Sequence, some 263 “new” genes from across the genome have been sequenced by the community as a whole (and submitted to EMBL-Bank, GenBank, or to DDBJ). Of these, some 53% are essentially identical in their protein coding regions to the Joint Sequence predictions (M. Ashburner, unpubl.). It is of some interest that both these community data and the EDGP data indicate that ∼55% of the proteins predicted by the Joint Sequence are essentially correct. This is a minimum figure, because it takes no account of alternative splice forms or the fact that some of the new community data represent only partial sequences.
Overall Sequence Comparison
The Joint Sequence for region 1A–3C is found on nine GenBank entries (Fig. 3). We have compared it to the contiguous EDGP sequence using the MUMmer program ofDelcher et al. (1999) (Fig. 3). At the nucleotide level, the differences between our sequence and that of the Joint Sequence in this region are of two types: small indels and large (1 Kb or more) blocks of difference. Thirty large blocks of sequence are present in only one of the sequences. Ten of these blocks occur at identical nucleotide positions in both the Joint and EDGP sequences (Fig. 3). The null hypothesis is that these pairs of blocks are independent. As will be shown below, this is probably not true for all. Excluding these, the difference between the two studies at the nucleotide level is 3.03% (n = 2,568,355 common nucleotides). This figure may seem high, but over half (56%) of the EDGP sequence was from clones derived from a very different strain from that used for the Joint Sequence. We have partitioned this difference into that seen in known or predicted coding exons, known or predicted introns, and other sequences; the figures are 0.90%, 2.29%, and 3.98%, respectively.
Sequence comparisons. A comparison of EDGP sequence of the tip of theX chromosome with that of the Drosophila Joint Sequence in the same region. The comparison was made using theMUMmer program (see Methods). The GenBank accession numbers corresponding to the Joint Sequence are shown on the left (AE003417–AE003425); note that this is part of a unitig (Myers et al. 2000). The blocks indicate regions of ⋝1 Kb present in one sequence but not the other. The position and length of each block of sequence ⋝1 Kb that is unique to one sequence is shown; each GenBank accession is numbered to the left of the unitig, the corresponding base position within the EDGP sequence is shown in italics to theright of the unitig. The EDGP sequence is numbered continuously. The length of each block of unique sequence is in parentheses. The nature of these sequence segments is shown in thecenter (note that a segment may include sequences in addition to those identified here). The segments corresponding to transposable elements are indicated in orange; those corresponding to known genes are red; a gray “neck” depicts a sequence interrupted by a large block of n's of length N (nN). The Greek superscripts (α,β,γ,ɛ,δ) refer to the class of sequence difference (see text). Note that there are an additional nine transposable elements in the EDGP sequence that are not seen to differ in the Joint Sequence.
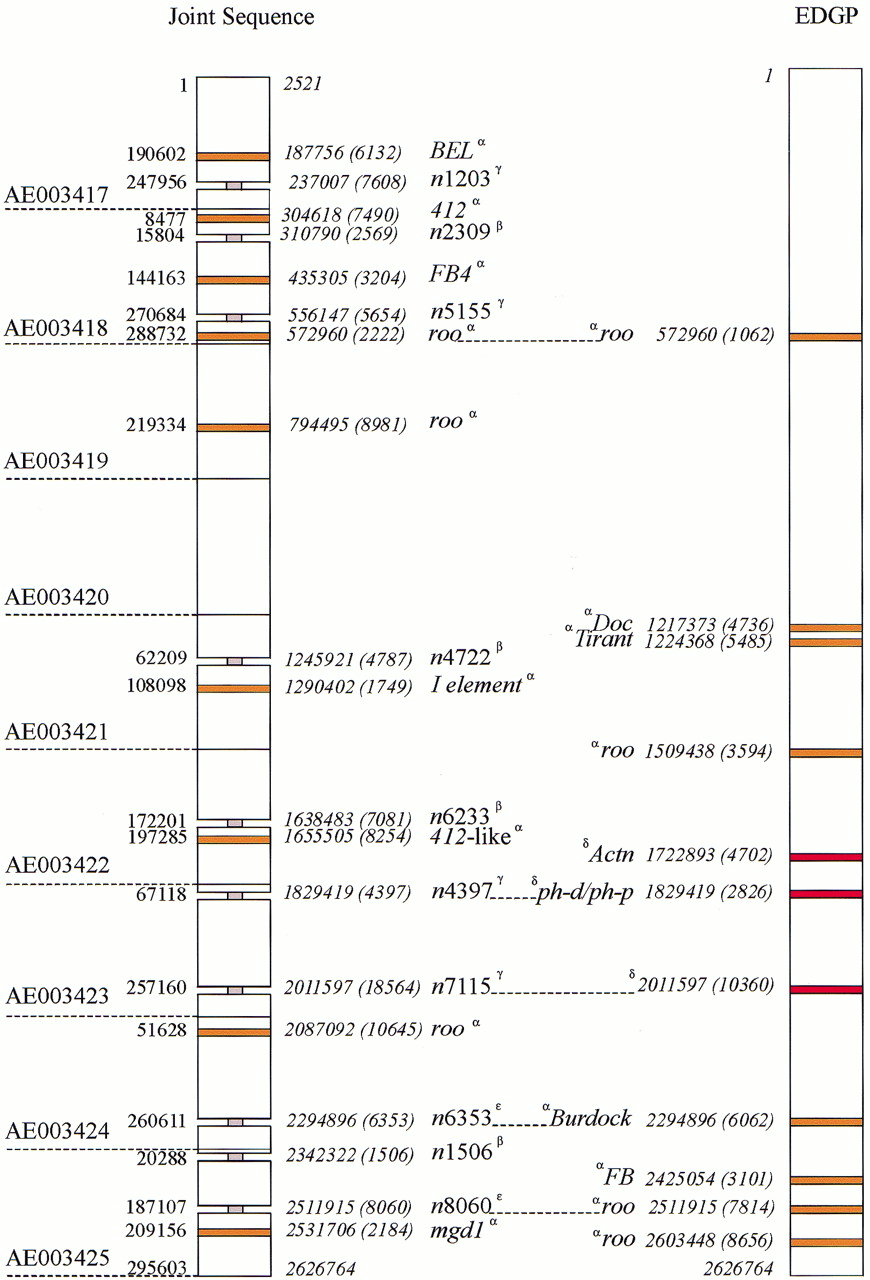
Most of the 30 blocks of sequence that appear to be absent from one or other sequence are either regions that have not been elucidated fully in the Joint Sequence, or correspond to transposable elements of variable location and/or length. In particular, 17 blocks in one or the other sequence correspond to recognizable transposable elements of variable length and/or location (α in Fig. 3). These include two roo elements of different length found at the same position (nucleotide 572,960) in both sequences; five rooelements of variable location; and 10 single occurrences of other transposable element families at unique locations (BEL, 412, FB4, I, 412-like and mgd1 in the Joint Sequence, andDoc, Tirant, Burdock, and FB in the EDGP Sequence). It should be noted that two of the long runs ofn in the Joint Sequence correspond to transposable elements in the EDGP Sequence (see below). The 17 differences in transposable elements are not surprising, as the majority of the two sequences were derived from two quite different fruitfly strains. In the EDGP sequence we have identified 18 transposable elements or fragments of elements and at least 7 of these differ in position in the Joint Sequence.
Ten of the 30 blocks are long gaps in the Joint Sequence (β, γ, ɛ in Fig. 3), represented in the GenBank accessions by long runs of n, with a total estimated length of 39,938 nucleotides. For four of the 10 gaps (β), the length of the gap in the Joint Sequence is considerably larger than the corresponding region in the EDGP sequence; for example the run of 4722 n's at position 1,245,921 corresponds to 102 bp in the EDGP sequence. We presume the reason for this is that the gap in the Joint Sequence represents a transposable element. Indeed, two gaps (ɛ) are caused by transposable elements: The 6353-bp gap at 2,294,896 corresponds to a 6062-bp Burdock element in the EDGP sequence, and the 8060-bp gap at 2,511,915 corresponds to a roo element in the EDGP sequence. Of the four remaining gaps (γ), two are complex (at 237,007 bp and 556,147 bp) and cannot be explained simply; one corresponds to the ph-d/ph-p gene duplication (see below), and the final gap, at 2,011,597 bp will be discussed below.
The remaining three long blocks (δ in Fig. 3) of the 30 that differ between the two sequences are informative, and will be discussed more fully. Two are only found in the EDGP sequence and are clearly the result of misassemblies in the Joint Sequence. The first of these is just 3′ to the Actn gene and is 4.7-Kb long; the probable explanation for it is that the Joint Sequence has failed to properly assemble a duplicated sequence that includes a partial duplication of the predicted gene EG:133E12.4. This duplication was first indicated by the matches of EST sequences (e.g., EMBL accession no. AA202518, EMBL accession no. AA696909) to both an exon of EG:133E12.4 and to a region between this gene andActn. The duplication is 4777 bp in length and the two copies are only mismatched over a 77-bp internal gap (1.5% mismatch). The second is in the region of the duplicate gene pair ph-d andph-p; the Joint Sequence has an incorrect model forph-p. That this region includes a long tandem repeat is known from the work of Deatrick et al. (1991).
The third region, at 2,011,597, is more complex. There is an 18.5 Kb region (of which 7.1 Kb are n's) in the Joint Sequence absent from the EDGP sequence; this sequence is not in the shotgun sequence of either relevant EDGP clone, cosmid 82C7, or BACH48C10. In addition, there is a 10.3-Kb sequence at the junction of these clones in the EDGP sequence that is absent from the Joint Sequence. Finally, 11 Kb of cosmid 82C7 is in the opposite orientation when compared to BACH48C10; note that the cosmid and BAC DNAs are from different strains (see Methods).
These three major sequence differences could be caused by polymorphisms; all occur within regions of EDGP cosmid sequence. However we consider that the hypothesis of misassembly, at least for the Actn and ph-d/ph-p region differences, is the more likely. The current “finishing” of the Joint Sequence by the BDGP should settle these problems.
Repeated regions are well known to present a problem to the software used to build long contiguous regions of sequence, and there is evidence of this in at least two regions of the Joint Sequence. It is interesting that in both cases the assembler appears to have had difficulties with tandem near repeats of quite long regions. Using statistical criteria, the software that assembled the Joint Sequence was able to identify and filter out the highly repetitive sequences, based on their higher than expected representation (Myers et al. 2000). However, the low copy repetitive sequences (such as the tandemly duplicated regions in these two cases) are difficult to identify by these methods. If this comparison of the X tip is typical of the genome as a whole, then it indicates some 90 misassemblies in the euchromatic sequence of the Joint Sequence.
The differences revealed by this comparison of the genomic sequence from the two projects includes both differences in sequencing method (clone-based in the case of the EDGP, and shotgun in the case of the Joint Sequence) and differences in strain from which the DNA was derived. Even when the sequenced DNA is from the same strain, but isolated some years apart, there are differences in sequence and transposable elements. For example, Myers et al. (2000) compared theAdh region sequenced by the BDGP using predominantly P1 clones (Ashburner et al. 1999) with that from the Joint Sequence. Although the differences are smaller than in the comparison made in this study, they are qualitatively very similar.
There are clear differences in gene predictions between the EDGP and Joint Sequence projects, both in the existence of genes and in the precise models of genes predicted in common. Again this is not too surprising, given that the Joint Sequence was annotated very largely by automatic methods, whereas the EDGP had the luxury of time to make a more careful study of each gene model. These differences point out that we have a long way to go before the annotation of eukaryotic sequences can be left entirely in the hands of computer programs (Ashburner 2000;Lewis et al. 2000).
This analysis has, for obvious reasons, concentrated on the differences between the two available sequences of this chromosome region. This must not obscure the fact that in general the two analyses are in remarkable agreement, and point to the overall utility of the “complete” genomic sequence now available for D. melanogaster.
METHODS
Clone Libraries and Map Construction
DNA from two strains has been sequenced. About 44% of the sequence is from BAC clones derived from the same strain as that sequenced by the BDGP and by Celera; in contrast, the cosmid clones sequenced were from a different strain (Fig. 1). The relationship between these strains cannot be determined. Both strains were free ofP-elements.
The cosmid library used for the construction of the Xchromosome physical map was derived from a wild-type (Canton-S) strain and described in detail by Sidén-Kiamos et al. (1990). It has an estimated average insert size of 35 Kb and contains ∼18,000 clones providing a fourfold coverage of the genome. The library is available on high density double spotted filters from the MRC HGMP Resource Centre (http://www.hgmp.mrc.ac.uk/Biology/Bio.html).
Three BAC clone libraries were used; each was constructed from DNA from the y2; cn bw sp isogenic strain. Two BAC libraries were made at CEPH (Centre d'Etude du Polymorphisme Humaine). One (BACN clones) was prepared with NdeII inserts and the other (BACH clones) with HindIII inserts, both in the vector pBeloBACII. These two libraries were made with pools of size-fractioned DNA that gave mean insert sizes of up to 90 Kb. The 23,400 clones gave ∼10-fold coverage of the genome. The third library was ofEcoRI digested DNA (BACR clones) and was constructed in the vector pBACe.3.6 by Aaron Mammoser and Kazutoyo Oseogawa at the Roswell Park Cancer Institute (Buffalo, NY) in collaboration with the BDGP (Hoskins et al. 2000). This library gave an ∼17-fold coverage of the genome with an average insert size of 165 Kb.
Sequencing
Cosmids and BACs were sequenced by a two-stage approach involving random sequencing of sub-clones followed by directed sequencing to resolve problems. DNA from cosmids and BACs was sonicated and fragments of 1.4–2 Kb were cloned into either M13 or pUC18 vectors. Clones were sequenced using dye-terminator chemistry and loaded on ABI373 or ABI377 automated sequencing machines. Sequence base calling and contig assembly was accomplished using Phred/Phrap software (Ewing and Green 1998; Ewing et al. 1998) and editing took place in either Consed (Gordon et al. 1998) or Gap4(Bonfield et al. 1995). Gaps were filled using a combination of custom primer walking and PCR.
Cosmid and BAC DNAs were nebulized and end repaired. Following agarose gel purification, fragments of ∼1500 nucleotides were ligated to linearized vector (pTZ19R or pCR-BluntII) and cloned in the KK2186 strain of Escherichia coli. Bacterial clones were picked at random and cultured overnight. Plasmid DNAs were prepared by an alkaline lysis method and purified using the QIAprep 96 Turbo Miniprep kit (QIAGEN). Insert DNA were sequenced from both ends using universal primers. Cycle sequencing was performed with labeled terminators using AmpliTaq and the Big Dye Terminator Cycle Sequencing Ready Reaction kit (Applied Biosystems).
The Heidelberg group employed the RANDI strategy that combines the advantages of RANdom and DIrected approaches. It involves systematic simultaneous sequencing on both strands from clones of combined libraries without cloning gaps. The random library fragments were generated by separate partial digestion with two four-cutter restriction enzymes (Tsp, Sau3A), gel-purified and ligated into plasmid vector. In parallel, BAC or cosmid DNA was completely digested with EcoRI (or HindIII) and fragments were isolated from agarose gel and inserted into the pUC vector. Their sequences served as a “scaffold” in the assembly of the complete sequence of the BAC genomic insert and also as templates for primer walking in the finishing stage. Cycle sequencing of plasmid DNA was performed with the AmpliTaqFS core kit (Applied Biosystems), using forward and reverse primers labeled with FITC or CY5. An MJ Research PT-200 cycler was used for 25 cycles (97°C, 15 sec; 55°C, 30 sec; 68°C, 30 sec). Reactions were loaded off-gel on the 72-clone porous-membrane combs, applied to 60-cm long polyacrylamide gels (4.5% Hydrolink Long Ranger gel solution, FMC) and analyzed on the ARAKIS sequencing system with array detectors, developed at EMBL (Erfle et al. 1997). This system allows simultaneous on-line sequencing of both strands (doublex sequencing), with the two sequencing products obtained in a single sequencing reaction, each labeled with a different fluorescent dye (Wiemann et al. 1995). Up to 2000 bases are thus obtained simultaneously in one sequencing reaction, which represents an efficient system for identifying large numbers of long sequences in one run. Raw sequencing data were evaluated, analyzed, and the consensus sequence assembled, using the software packages (LaneTracker and GeneSkipper) developed at EMBL. Remaining sequencing gaps were covered by primer walking (Voss et al. 1993). Direct cosmid or BAC DNA sequencing was carried out essentially as described elsewhere (Benes et al. 1997).
P-element Stocks and Mapping
A large-scale screen for insertions of the enhancer trap vectorP{lacW} (Bier et al. 1989) in essential Xchromosome genes has been performed in H. Jäckle's laboratory (Peter et al., in prep.). Females homozygous for a male sterile insertion of the P{lacW} element in chromosome 2 were crossed en masse to w/Y; wg Sp/CyO; P{ry +=delta2–3}(99B)males. In the next generation five homozygous FM6 females were mated to two w/Y; P{lacW}/CyO; P{ry +=delta2–3}(99B)/+ males. F2 daughters in which the CyO andP{lacW} chromosomes had cosegregated were individually mated to Fm7c/Y males. Lines that produced only FM6sons in the F3 generation were kept as candidates for a lethal insertion. If these re-tested, then the lethal insertion was kept in stock balanced with FM7c.
P{lacW} insertion sites were mapped by either plasmid rescue or inverse PCR. DNA from adult flies was isolated using a QIAGEN column, digested overnight with an appropriate restriction enzyme, and then ligated under conditions favoring intramolecular joining. For plasmid rescue, E. coli cells were electroporated with the DNA and plated for the selection of ampicillin resistant colonies. These were used to inoculate small scale overnight cultures from which plasmid DNA was then isolated. Cycle sequencing was performed with a primer complementary to the 31-bp inverted repeat of the P-element on an ABI373 DNA sequencer using dye terminator technology. In the case of inverse PCR, we followed essentially the protocol from the BDGP. We used their primers Plac1 and Plac4 for the amplification of 5′ sequences and primers Pry4 and Plw3–1 for the amplification of 3′ sequences, respectively. Sequencing was done as before with primer SP1 for 5′ and primer SP6 for 3′ analysis.
Sequence Analysis
Sequences were analyzed by the EDGP on a clone-by-clone basis; i.e., only fully sequenced clones (cosmids or BACs) were included. The overall analysis scheme is similar to that adopted by other genome projects (e.g., C. elegans Sequencing Consortium 1998).
tRNA genes were identified by tRNAscan-SE program, v. 1.0 (Lowe and Eddy 1997). Candidate protein coding genes were predicted independently by GENEFINDER version 0.84 (P. Green, unpubl.) and the publicly available Genscan version 1.0 (Burge and Karlin 1997). These two programs employ fundamentally different algorithms and complemented each other on gene discovery. GENSCAN andGENEFINDER had been trained on a vertebrate gene set and aDrosophila-specific set (compiled by G. Helt, pers. comm.), respectively. We measured the accuracy of prediction of the two programs with already known Drosophila genes and we found them to be comparable. However, each of them performed better on a different set of genes. As expected, Drosophila-trained GENEFINDER showed a preference for genes with fewer exons and smaller introns when compared to the vertebrate-trainedGENSCAN.
Additional supporting evidence for the predicted genes, as well as indications of their function, was obtained by similarity searches against SWISS-PROT and TrEMBL protein databases (Bairoch and Apweiler 2000), Drosophila nucleic acid sequences (derived from EMBL-Bank), and Drosophila EST sets, generated by the BDGP (Rubin et al. 2000b) and by Andrews et al. (2000). (Note that the annotation of version 1 of the Joint Sequence did not use the entire BDGP EST data set; in particular 4,654 3′ ESTs, out of a total of 86,121, were not used [S. Lewis, pers. comm.]). EST alignments were also used to fine-tune the intron/exon boundaries of the predicted genes. Simple repetitive sequences were filtered out byTANDEM, INVERTED, andQUICKTANDEM programs (R. Durbin, pers. comm..) whereas repeats of higher complexity were screened out using similarity searches against Drosophila repetitive and transposable element databases (see below). For protein and nucleotide database searches we used BLASTX and BLASTN, v. 1.4.9. (Altschul et al. 1990), respectively.
Finally, protein domains/motifs of the predicted genes were identified by PPSEARCH and HMMER (v. 2.1.1) programs, scanning the PROSITE and PFAM databases, respectively. PROSITE output was further filtered using the EMOTIF program (Nevill-Manning et al. 1998).
All data generated by the automatic computational analysis described above were parsed into an ACeDB-based database (http://www.acedb.org/), XDrosDB, tailored to the needs of the EDGP. The combined data were manually examined/analyzed using ACeDB software. During this analysis we disregarded genes with a GENEFINDER score <50, if there was no other supporting evidence for them (i.e., protein similarity and/or EST matches). This cutoff is stricter than the one used by the BDGP (cutoff = 20) for the analysis of the Adhregion (Ashburner et al. 1999); and, presumably, increases the number of rejected genes (false negatives). However, we chose to set it this high to avoid overpredicting genes (false positives).
During the initial phase of our work, we, in collaboration with the BDGP, created and subsequently curated three datasets. One consisted of 1332 D. melanogaster coding sequences from genes that have been previously studied genetically and/or biochemically. This is a nonredundant set, i.e., only one copy of each gene is included in it. In case a gene appears in multiple entries in the public databases (e.g., alternatively transcribed, submitted from more than one laboratory, etc.), we manually selected one copy (usually the best documented or longest open reading frame). We used this dataset to test the accuracy of the two chosen gene prediction programs (GENEFINDER, GENSCAN), as well as a source for hexanucleotides score calculation (GENEFINDER). This dataset has been subsequently expanded/updated to include genes identified by Drosophila genome projects (EDGP, BDGP, and Celera), with the help of Leyla Bayraktaroglou (FlyBase at Harvard). Both the original and expanded versions, together with information about their history, can be found at:ftp://ftp.ebi.ac.uk/pub/databases/edgp/sequence_sets/ or fromhttp://fruitfly.berkeley.edu/.
Similarly, a nonredundant collection of 47 D. melanogastertransposable elements and another consisting of 96 miscellaneous repetitive sequences were also assembled during the initial phase of our project. These datasets were used to identify complex repetitive regions, as described previously. They are also available from the same ftp site or from the BDGP site.
For clarity, we use the term “Joint Sequence” to refer to v1.0 of the complete sequence of the genome of D. melanogaster (Adams et al. 2000) released on March 24, 2000 by Celera. Comparisons of predicted, or known, protein sequences from the EDGP project with those from the Joint Sequence were done by CLUSTALW using the protein sequences of release 1.0 of the Joint Sequence (http://www.fruitfly.org/sequence/sequence_db/aa_gadfly.dros of March 21, 2000). These comparisons were then analyzed by hand. The comparison of the entire sequence of the X chromosome tip with the sequence of the same region from the Joint Sequence was done using theMUMmer program (Delcher et al. 1999), which aligns long genomic regions by finding corresponding maximal unique matches. Nine separate alignments were done using the following GenBank accession nos.: AE003417, AE003418, AE003419, AE003420, AE003421, AE003422,AE003423, AE003424, and AE003425, each being matched against the entire EDGP sequence. The resulting alignments were analyzed by hand to find regions where the discrepancies between the sequences were large. Figure 3 was drawn by hand and is a graphic depiction of the alignment produced by MUMmer. Large segments absent from one of the sequences have been highlighted.
The results presented in this study were obtained by or before February 7, 2000. However, if we had repeated the same analysis today we would have assigned function (by protein similarity) to 23 more of the predicted genes (raising the percentage of the genes with significant protein similarities to 66% of the 206 newly identified genes).
Supplementary data are available fromftp://ebi.ac.uk/pub/databases/edgp/EDGP-GenomeResearch_suppdata_2001.
This work was supported by a Contract from the European Commission under Framework Programme 4 (coordinator D.M. Glover), by a grant from the Medical Research Council, London to M.A. and D.M.G., by a grant from the Dirección General de Investigacion Cientı́fica y Técnica to J.M., by a grant from the Hellenic Secretariat General for Science and Technology to K.L., and by a grant from the Deutsche Humangenomprojekt to H.J. R.D.C.S. was supported by a Wellcome Trust Senior Fellowship. We thank many colleagues for their help. We are grateful to Gerry Rubin and his colleagues at the BDGP, particularly Suzanna Lewis, Sima Misra, and Susan Celniker (and, of course, Gerry himself) for the exchange of materials, information, and ideas over the years. Greg Helt of the BDGP was very helpful in providing us with the initial Drosophila gene training set. We also thank Rolf Apweiler and his SWISS-PROT/TrEMBL team at the EBI, particularly Alexander Kanapin and Wolfgang Fleischmann for their help with the protein motif analysis. We also thank Rolf Apweiler, head of that team, for his blessings. Richard Durbin's group at the Sanger Center have been extraordinarily helpful; in particular, Daniel Lawson gave tremendous help with ACeDB despite having to bend double at times. Kim Rutherford of the Pathogen Sequencing Unit at the Sanger Center provided the software to draw Figure 1; without this we may have been lost. We thank Brian Oliver of the NIH, Bethesda for a pre-print copy of his paper on testis ESTs, Leyla Bayraktaroglou (FlyBase group, Harvard) for her help in the curation of reference sequence data sets, and David Judge of the Cambridge School of Biological Sciences Biocomputing Unit for help.
The publication costs of this article were defrayed in part by payment of page charges. This article must therefore be hereby marked “advertisement” in accordance with 18 USC section 1734 solely to indicate this fact.
Notes
[18] Present address: Department of Genetics, School of Medicine, Washington University, 4566 Scott Avenue,St. Louis, MO 63110 USA.
[19] Corresponding author.
Notes
[20] E-MAIL [email protected]; FAX 44-1223-333992.
[21] Article and publication are at www.genome.org/cgi/doi/10.1101/gr.173801.
REFERENCES
- ↵M. AdamsS.E. CelnikerR.A. HoltC.A. EvansJ.D. GocayneP.G. AmanatidesS.E. SchererP.W. LiR.A. HoskinsR.F. Galle(2000) The genome sequence of Drosophila melanogaster. Science 287:2185–2195.
- ↵I.J. Agol(1929) Treppenartiger Allelomorphismus bei Drosophila melanogaster. Zur Frage nach der Struktur und der Natur des Gens. Zh. Eksp. Biol. Med. 5:86–101.
- ↵J.W. AjiokaD.A. SmollerR.W. JonesJ.P. CarulliA.E.C. VellekD. GarzaA.J. LinkI.W. DuncanD.L. Hartl(1991) Drosophila genome project — one-hit coverage in yeast artificial chromosomes. Chromosoma 100:495–509.
- ↵S.I. Alikhanian(1937) A study of the lethal mutations in the left end of the sex-chromosome in Drosophila melanogaster. Zool. Zh. 16:247–279, (Russian, English summary)..
- ↵M.C. AlonsoC.V. Cabrera(1988) The achaete-scute gene complex of Drosophila melanogaster comprises four homologous genes. EMBO J. 7:2585–2591.
- ↵S.F. AltschulW. GishW. MillerE.W. MyersD.J. Lipman(1990) Basic local alignment search tool. J. Mol. Biol. 215:403–410.
- ↵J. AndrewsG. BouffardC. CheadleJ. LuK. BeckerB. Oliver(2000) Gene discovery using computational and microarray analysis of transcription in the Drosophila melanogaster testis. Genome Res. 10:2030–2043.
- ↵M. Ashburner(1969) Patterns of puffing activity in the salivary gland chromosomes of Drosophila. II. The X-chromosome puffing patterns of Drosophila melanogaster and Drosophila simulans. Chromosoma 27:47–63.
- ↵(2000) A biologist's view of the Drosophila Genome Annotation Assessment Project. Genome Res. 10:391–393, ibid.
- ↵M. AshburnerS. MisraJ. RooteS.E. LewisR. BlazejT. DavisC. DoyleR. GalleR. GeorgeN Harris(1999) An exploration of the sequence of a 2.9-Mb region of the genome of Drosophila melanogaster. The Adh region. Genetics 153:179–219.
- ↵A. BairochR. Apweiler(2000) The SWISS-PROT protein sequence database and its supplement TrEMBL in 2000. Nucleic Acid Res. 28:45–48.
- ↵C.A. BayerB. HolleyJ.W. Fristrom(1996) A switch in Broad-Complex zinc-finger isoform expression is regulated posttranscriptionally during the metamorphosis of Drosophila imaginal discs. Dev. Biol. 177:1–14.
- ↵C.A. BayerL. von KalmJ.W. Fristrom(1997) Relationships between protein isoforms and genetic functions demonstrate functional redundancy at the Broad-Complex during Drosophila metamorphosis. Dev. Biol. 187:267–282.
- ↵H.J. Becker(1962) Die Puffs der Speicheldrusenchromosomen von Drosophila melanogaster. II. Die Auslosung der Puffbildung, ihre Spezifitat und ihre Beziehung zur funktion der Ringdruse. Chromosoma 13:341–384.
- ↵V. BenesC. KilgerH. VossS. PääboW. Ansorge(1997) Direct primer walking on P1 plasmid DNA. Biotechniques 23:98–100.
- ↵P.V. BenosM.K. GattM. AshburnerL. MurphyD. HarrisB. BarrellC. FerrazS. VidalC. BrunJ. Demailles(2000) From sequence to chromosome: The tip of the X chromosome of D. melanogaster. Science 287:2220–2222.
- ↵J.B. BergeR. FeyereisenM. Amichot(1998) Cytochrome P450 monooxygenases and insecticide resistance in insects. Phil. Trans. R. Soc. 353:1701–1705.
- ↵E. BierH. VaessinS. ShepherdK. LeeK. McCallS. BarbelL. AckermanR. CarrettoT. UemuraE. Grell(1989) Searching for pattern and mutation in the Drosophila genome with a P-lacZ vector. Genes & Dev. 3:1273–1287.
- ↵H. BiessmannJ.M. Mason(1997) Telomere maintenance without telomerase. Chromosoma 106:63–69.
- ↵J.K BonfieldK.F. SmithR. Staden(1995) A new DNA sequence assembly program. Nucl. Acids Res. 23:4992–4999.
- ↵C.B. Bridges(1916) Non-disjunction as proof of the chromosome theory of heredity. Genetics 1:1–52, ; 107–163..
- ↵(1935) Salivary chromosome maps with a key to the banding of the chromosomes of Drosophila melanogaster. J. Hered. 26:60–64, ibid.
- ↵(1937) Correspondences between linkage maps and salivary chromosome structure, as illustrated in the tip of chromosome 2R of Drosophila melanogaster. Cytologia Fujii Jubil. Vol. 745–755, ibid.
- ↵C. BurgeS. Karlin(1997) Prediction of complete gene structures in human genomic DNA. J. Mol. Biol. 168:78–94.
- ↵C. elegans Sequencing Consortium (1998) Genome sequence of the nematode C. elegans: A platform for investigating biology. Science 282:2012–2018.
- ↵S. CampuzanoJ. Modolell(1992) Patterning of the Drosophila nervous system: The acheate-scute complex. Trends Genet. 8:202–207.
- ↵S. CampuzanoL. CarramolinoC.V. CabreraM. Ruiz-GómezR. VillaresA. BoronatJ. Modolell(1985) Molecular genetics of the achaete-scute gene complex of D. melanogaster. Cell 40:327–338.
- ↵V.M. ChávezG. MarquésJ.P. DelbecqueK. KobayashiM. HollingsworthJ. BurrJ.E. NatzleM.B. O'Connor(2000) The Drosophila disembodied gene controls late embryonic morphogenesis and codes for a cytochrome P450 enzyme that regulates embryonic ecdysone levels. Development 127:4115–4126.
- ↵W. ChiaG. HowesM. MartinY.B. MengK. MosesS. Tsubota(1986) Molecular analysis of the yellow locus of Drosophila. EMBO J. 5:3597–3605.
- ↵C. Dambly-ChaudièreA. Ghysen(1987) Independent subpatterns of sense organs require independent genes of the achaete-scute complex in Drosophila larvae. Genes & Dev. 1:297–306.
- ↵P. DeakM. OmarR.D.C. SaundersM. PalO. KomonyiJ. SzidonyaP. MaroyY. GuoX. ZhangK. Kaiser(1997) P-element insertion alleles of essential genes on the third chromosome of Drosophila melanogaster: Correlation of physical and genetic maps in chromosomal region 86E-87F. Genetics 147:1697–1722.
- ↵J. DeatrickM. DalyN.B. RandsholtH.W. Brock(1991) The complex genetic locus polyhomeotic in Drosophila melanogaster potentially encodes two homologous zinc-finger proteins. Gene 105:185–195.
- ↵A.L. DelcherS. KasifR.D. FleischmannJ. PetersonO. WhiteS.L. Salzberg(1999) Alignment of whole genomes. Nucleic Acids Res. 27:2369–2376.
- ↵P.R. DiBelloD.A. WithersC.A. BayerJ.W. FristromG.M. Guild(1991) The Drosophila Broad-Complex encodes a family of related proteins containing zinc fingers. Genetics 129:385–397.
- ↵H. ErfleR. VentzkiH. VossS. RechmannV. BenesJ. StegemannW. Ansorge(1997) Simultaneous loading of 200 sample lanes for DNA sequencing on vertical and horizontal, standard and ultrathin gels. Nucleic Acids Res. 25:2229–2230.
- ↵B. EwingP. Green(1998) Base-calling of automated sequencer traces using phred. II. Error probabilities. Genome Res. 8:186–194.
- ↵B. EwingL. HillierM.C. WendlP. Green(1998) Base-calling of automated sequencer traces using phred. I. Accuracy assessment. Genome Res. 8:175–185.
- ↵A. Garcı́a-Bellido(1979) Genetic analysis of the achaete-scute system of Drosophila melanogaster. Genetics 91:491–520.
- ↵M.J. Garcı́a-Garcı́aP. RamainP. SimpsonJ. Modolell(1999) Different contributions of pannier and wingless to the patterning of the dorsal mesothorax of Drosophila. Development 126:3523–3532.
- ↵F. González(1989) Estructura Molecular de los Genes del Complejo achaete-scute de Drosophila melanogaster. Ph.D thesis. (Universidad Autónoma, Madrid).
- ↵D. GordonC. AbajianP. Green(1998) Consed: A graphical tool for sequence finishing. Genome Res. 8:195–202.
- ↵R.A. HoskinsC.R. NelsonB.P. BermanT.R. LavertyR.A. GeorgeL. CiesiolkaM. NaeemuddinA.D. ArensonJ. DurbinR.G. David(2000) A BAC-based physical map of the major autosomes of Drosophila melanogaster. Science 287:2271–2274.
- ↵T. HummelK. KrukkertJ. RoosG. DavisC. Klambt(2000) Drosophila Futsch/22C10 is a MAP1B-like protein required for dendritic and axonal development. Neuron 26:357–370.
- ↵F. JiménezJ.A. Campos-Ortega(1987) Genes of the subdivision 1B of the genome of Drosophila melanogaster and their participation in neural development. J. Neurogenet. 4:179–200.
- ↵B.H. Judd(1998) Genes and chromomeres: A puzzle in three dimensions. Genetics 150:1–9.
- ↵B.H. JuddM.W. ShenT.C. Kaufman(1972) The anatomy and function of a segment of the X chromosome of Drosophila melanogaster. Genetics 71:139–156.
- ↵F.C. KafatosC. LouisC. SavakisD.M. GloverM. AshburnerA.J. LinkI. Sidén-KiamosR.D.C. Saunders(1990) Integrated maps of the Drosophila melanogaster genome. Trends Genet. 7:155–160.
- ↵W. KimmerlyK. StultzS. LewisK. LewisV. LustreR. RomeroJ. BenkeD. SunG. ShirleyC. Martin(1996) A P1-based physical map of the Drosophila euchromatic genome. Genome Res. 6:414–430.
- ↵D.E. Lea(1955) Actions of radiations on living cells (Cambridge University Press, Cambridge, UK), 2nd edition.
- ↵G. Lefevre(1976) A photographic representation and interpretation of the polytene chromosomes of Drosophila melanogaster salivary glands. in The genetics and biology of drosophila, Vol. 1a, eds M. AshburnerE. Novitski(Academic Press, London, UK), pp 31–66.
- ↵G. LefevreW.S. Watkins(1986) The question of the total gene number in Drosophila melanogaster. Genetics 113:869–895.
- ↵S. LewisM. AshburnerM.G. Reese(2000) Annotating eukaryotic genomes. Curr. Opin. Struct. Biol. 10:349–354.
- ↵J.K. LimL.A. Snyder(1974) Cytogenetic and complementation analysis of recessive lethal mutations induced in the X-chromosome of Drosophila by three alkylating agents. Genet. Res. 24:1–10.
- ↵T.M. LoweS.R. Eddy(1997) tRNAscan-SE: A program for improved detection of transfer RNA genes in genomic sequences. Nucleic Acids Res. 25:955–964.
- ↵C. LouisE. MadueñoJ. ModolellM. OmarG. PapagiannakiR.D.C. SaundersC. SavakisI. Sidén-KiamosL. SpanosP. Topalis(1997) 105 new potential Drosophila melanogaster genes revealed through STS families. Gene 195:187–193.
- ↵E. MadueñoG. RimmingtonR.D.C. SaundersC. SavakisI. Sidén-KiamosG. SkavdisL. SpanosJ. TrennearP. AdamM. Ashburner(1995) A physical map of the X chromosome of Drosophila melanogaster: Cosmid contigs and sequence tagged sites. Genetics 139:1631–1647.
- ↵T.H. Morgan(1910) Sex limited inheritance in Drosophila. Science 32:120–122.
- ↵H.J. Muller(1935) The origination of chromatin deficiencies as minute deletions subject to insertion elsewhere. Genetica 17:237–252.
- ↵E.W. MyersG.G. SuttonA.L. DelcherI.M. DewD.P. FasuloM.J. FlaniganS.A. KravitzC.M. MobarryK.H.J. ReinertK.A. Remington(2000) A whole-genome assembly of Drosophila. Science 287:2196–2204.
- ↵Nelson, D. 2000. http://drnelson.utmem.edu/CytochromeP450.html.
- ↵C.G. Nevill-ManningT.D. WuD.L. Brutlag(1998) Highly specific protein sequence motifs for genome analysis. Proc. Natl. Acad. Sci. 95:5865–5871.
- ↵D.N. NguyenY. LiuM.L. LitskeR. Reinke(1997) The sidekick gene, a member of the immunoglobulin superfamily, is required for pattern formation in the Drosophila eye. Development 124:3303–3312.
- ↵P. RørthK. SzaboA. BaileyT. LavertyJ. RehmG. RubinK. WeigmannM. MilanV. BenesW. Ansorge(1998) Systematic gain-of-function genetics in Drosophila. Development 125:1049–1057.
- ↵G.M. Rubin(1996) Around the genomes: The Drosophila genome project. Genome Res. 6:71–79.
- ↵(1998) The Drosophila genome project: A progress report. Trends Genet. 14:340–343, ibid.
- ↵G.M. RubinM.D. YandellJ.R. WortmanG.L.G. MiklosC.R. NelsonI.K. HariharanM.E. FortiniP.W. LiR. ApweilerW. Fleischmann(2000a) Comparative genomics of the eukaryotes. Science 287:2204–2215.
- ↵G.M. RubinL. HongP. BroksteinM. Evans-HolmE. FriseM. StapletonD.A. Harvey(2000b) A Drosophila complementary DNA resource. Science 287:2222–2224.
- ↵M. Ruiz-GómezJ. Modolell(1987) Deletion analysis of the achaete-scute locus of D. melanogaster. Genes & Dev. 1:1238–1246.
- ↵R.D.C. SaundersD.M. GloverM. AshburnerI. Sidén-KiamosC. LouisM. MonastiriotiC. SavakisF.C. Kafatos(1989) PCR amplification of DNA microdissected from a single polytene chromosome band: A comparison with conventional microcloning. Nucleic Acids Res. 17:9027–9037.
- ↵I. Sidén-KiamosR.D.C. SaundersL. SpanosT. MajerusJ. TreanearC. SavakisC. LouisD.M. GloverM. AshburnerF.C. Kafatos(1990) Towards a physical map of the Drosophila melanogaster genome: Mapping of cosmid clones within defined genomic divisions. Nucleic Acids Res. 18:6261–6270.
- ↵V. Sorsa(1988) Chromosome maps of Drosophila. 2 vols . (CRC Press, Boca Raton, FL).
- ↵A.C. SpradlingD. SternA. BeatonE.J. RhemT. LavertyN. MozdenS. MisraG.M. Rubin(1999) The BDGP gene disruption project: Single P element insertions mutating 25% of vital Drosophila genes. Genetics 153:135–177.
- ↵A.H. Sturtevant(1913) The linear arrangement of six sex-linked factors in Drosophila, as shown by their mode of association. J. Exp. Zool. 14:43–59.
- ↵J. SulstonF. MallettR. StadenR. DurbinT. HorsnellA. Coulson(1988) Software for genome mapping by fingerprinting techniques. Comput. Appl. Biosci. 4:125–132.
- ↵T. TörökG. TickM. AlvaradoI. Kiss(1993) P-lacW insertional mutagenesis on the second chromosome of Drosophila melanogaster: Isolation of lethals with different overgrowth phenotypes. Genetics 135:71–80.
- ↵G. TzolovskyW.M. DengT. SchlittM. Bownes(1999) The function of the Broad-Complex during Drosophila melanogaster oogenesis. Genetics 153:1371–1383.
- ↵J.C. VenterM.D. AdamsG.G. SuttonA.R. KervalageH.O. SmithM. Hunkapiller(1998) Shotgun sequencing of the human genome. Science 280:1540–1542.
- ↵R. VillaresC.V. Cabrera(1987) The achaete-scute gene complex of D. melanogaster: Conserved domains in a subset of genes required for neurogenesis and their homology to myc. Cell 50:415–424.
- ↵H. VossS. WiemannD. GrothuesC. SensenJ. ZimmermannC. SchwagerJ. StegemannH. ErfleT. RuppW. Ansorge(1993) Automated low-redundancy large-scale DNA sequencing by primer walking. Biotechniques 15:714–721.
- ↵S. WiemannJ. StegemannD. GrothuesA. BoschX. EstivillC. SchwagerJ. ZimmermannH. VossW. Ansorge(1995) Simultaneous on-line DNA sequencing on both strands with two fluorescent dyes. Anal. Biochem. 224:117–121.
- ↵M.W. YoungB.H. Judd(1978) Nonessential sequences, genes, and the polytene chromosome bands of Drosophila melanogaster. Genetics 88:723–742.
- ↵I.F. Zhimulev(1999) Genetic organization of polytene chromosomes. Adv. Genet. 39:1–599.
- ↵I.F. ZhimulevE.S. BelyaevaO.M. MazinaM.L. Balasov(1995) Structure and expression of the BRC locus in Drosophila melanogaster, Diptera: Drosophilidae. Eur. J. Ent. 92:263–270.