Abstract
Genetic perturbation response prediction plays a critical role in virtual cell research, yet the performance of current deep learning models still leaves room for improvement. In this study, we present a prior-guided response inference model (PRIM) that leverages a valuable priori knowledge of gene expression in control cells to model the effects of perturbations at the cellular level. This allows PRIM to predict the amount of change in gene expression after perturbation to better approximate the real situation. Compared with existing deep learning approaches, PRIM achieves superior performance across multiple data sets and notable advantages in predicting combinatorial perturbation responses. Moreover, it is more lightweight than current deep learning models and enables faster forward inference. Importantly, PRIM effectively captures nonadditive genetic interactions and shows the potential to uncover associations between combinatorial perturbations and new biologically meaningful phenotypes. These findings provide new insights into the application of deep learning for predicting cellular responses to genetic perturbations.
Gene perturbation is achieved by altering the expression levels of specific genes in cells or organisms to observe their effects on the entire cell or organism (Liberali et al. 2015). There are several ways for disrupting gene inheritance, including gene knockout, knockdown, overexpression, or activation of one or more target genes (Yu et al. 2025). It is possible to explore the relationship between gene expression and cell function by analyzing the relationship between genes and cell function after perturbation, thereby discovering potential therapeutic targets (Sachs et al. 2005; Nelson et al. 2015; Jaitin et al. 2016; Jiang et al. 2025).
The activation or inhibition of certain genes not only alters their own expression levels but also indirectly affects the expression of other genes through complex downstream regulatory networks (Binan et al. 2025; Nadig et al. 2025; Yu et al. 2025). These effects are often nonlinear and multilayered, thereby posing challenges to the analysis of gene function (Ishikawa et al. 2023). Therefore, it is necessary to have technologies that can capture and quantify these changes at the genome-wide scale in order to explore the global effects of gene perturbations.
Transcriptomics can simultaneously measure changes in the expression of a large number of genes across the entire genome, thereby comprehensively depicting the transcriptional response after perturbation (Monzo et al. 2025; Wang and Dwivedi 2025). The combination of perturbation data and computational modeling enables the construction of “virtual cells” to simulate the effects of genetic perturbations (Bunne et al. 2024; Li et al. 2025; Schaffer et al. 2025). It is possible to predict the effects of different genetic operations on cell states without actual experiments, providing potential support for revealing biological mechanisms such as gene regulation, signaling pathways, and cell functions, as well as for developing drugs.
Nevertheless, predicting perturbation outcomes at the whole-genome level remains challenging. For instance, the number of potential gene combinations increases exponentially, making comprehensive experimental coverage impractical, with challenges such as combinatorial explosion being virtually unavoidable (Horlbeck et al. 2018; Norman et al. 2019; Frangieh et al. 2021; Przybyla and Gilbert 2022). To this end, some computational methods have been developed to infer perturbation effects (Duan et al. 2019; Skinnider et al. 2021; Bravo González-Blas et al. 2023; Dong et al. 2023b; Kamimoto et al. 2023; Gavriilidis et al. 2024; Peidli et al. 2024; Song et al. 2025). He et al. (2023) introduced ASGARD, which enables drug repurposing by defining drug scores using consistently differentially expressed genes as input to identify drugs that can significantly reverse their expression levels. Dann et al. (2022) proposed Milo, which performs differential abundance testing by assigning cells to partially overlapping neighborhoods on a k-nearest neighbor graph to identify perturbations masked by clustering. Dong et al. (2023a) proposed CINEMA-OT based on the concept of optimal transport, a framework for causal learning and optimal transport, which separates confounding variation from perturbation effects to construct optimal transport matching that captures the relationships between counterfactual cell pairs.
However, traditional methods typically rely on predefined rules or prior assumptions, which limits their ability to capture nonlinear and complex interactions. Deep learning that can learn feature representations from transcriptomic data holds great promise for predicting gene perturbations (Ahlmann-Eltze et al. 2025). Lotfollahi et al. (2019) proposed scGen, a model that combines variational autoencoders with latent space vector operations, which reveals significant linear relationships in low-dimensional manifolds and captures variations induced by perturbation effects in high-dimensional single-cell data sets. Roohani et al. (2024) developed GEARS, which integrates deep learning with a gene relationship knowledge graph to predict transcriptional responses under both single-gene and multigene perturbations. Cui et al. (2024) introduced scGPT, a novel single-cell foundation model pretrained on more than 10 million single-cell data sets, which employs gene dimension self-attention to learn intricate interactions between perturbed genes and other genes. It is worth noting that integrating biologically meaningful prior knowledge is crucial for improving the accuracy and interpretability of the model (Tsuru and Furusawa 2025; Zhang et al. 2025). Gene Ontology (GO) provides a structured vocabulary for describing gene functions and biological processes, and gene coexpression networks capture functional relationships between genes inferred (Harris et al. 2004; The Gene Ontology Consortium 2019; Roohani et al. 2024). These sources of prior knowledge can be integrated into deep learning algorithms to guide feature representation learning and model constraints, thereby enhancing prediction outcomes.
In this work, we propose a deep learning–based framework for predicting transcriptional responses to genetic perturbations. PRIM is designed to effectively integrate multiple sources of biologically meaningful prior knowledge in order to capture key determinants of perturbation responses. Specifically, we leverage a GO knowledge graph to encode perturbation conditions (i.e., genes), enabling PRIM to learn functional relationships among perturbed genes. In parallel, we incorporate a gene coexpression network to encode genes, allowing PRIM to capture regulatory and expression-coupled relationships. Furthermore, by introducing a cell-encoding module based on control-cell expression profiles, PRIM learns heterogeneous cellular responses to genetic perturbations. Building upon the GEARS (Roohani et al. 2024) framework, our goal is to integrate diverse prior knowledge to enable accurate prediction of cell-specific perturbation effects, achieving improved performance while maintaining a lightweight model architecture. We anticipate that this framework offers a lightweight yet expressive paradigm for incorporating biological priors into deep learning models for genetic perturbation response prediction.
Results
Task description and model overview
In this study, we aim to predict the expression of all genes in cells under perturbation. A schematic of the perturbation process is shown in Figure 1A. To achieve this, we develop a deep learning framework capable of predicting both single-perturbation and combinatorial-perturbation responses (Fig. 1B). Importantly, our approach incorporates valuable prior knowledge from the gene expression profiles of control (unperturbed) cells, thereby enabling PRIM to account for perturbation effects at the cellular level. This design allows our predictions to better approximate the real situation.
Incorporating valuable prior knowledge to predict postperturbation gene expression. (A) Demonstration of the perturbation process. One or more genes from the gene list of unperturbed cells are selected for perturbation, and the expression of all genes is observed in the postperturbation state. (B) PRIM is capable of predicting both single-perturbation and combinatorial-perturbation responses. The inputs to PRIM mainly include the gene list, the set of perturbation conditions, and the unperturbed cells. (C) Schematic diagram of PRIM framework for predicting combinatorial perturbation responses. The gene list, perturbation conditions, and unperturbed cell are encoded separately, and the resulting representations are integrated in the latent space to obtain the postperturbation embedding. This embedding is then decoded by two distinct MLP decoders to yield the final predicted postperturbation expression changes of each gene. ⊕ indicates the sum operation; concat, for the concatenation.
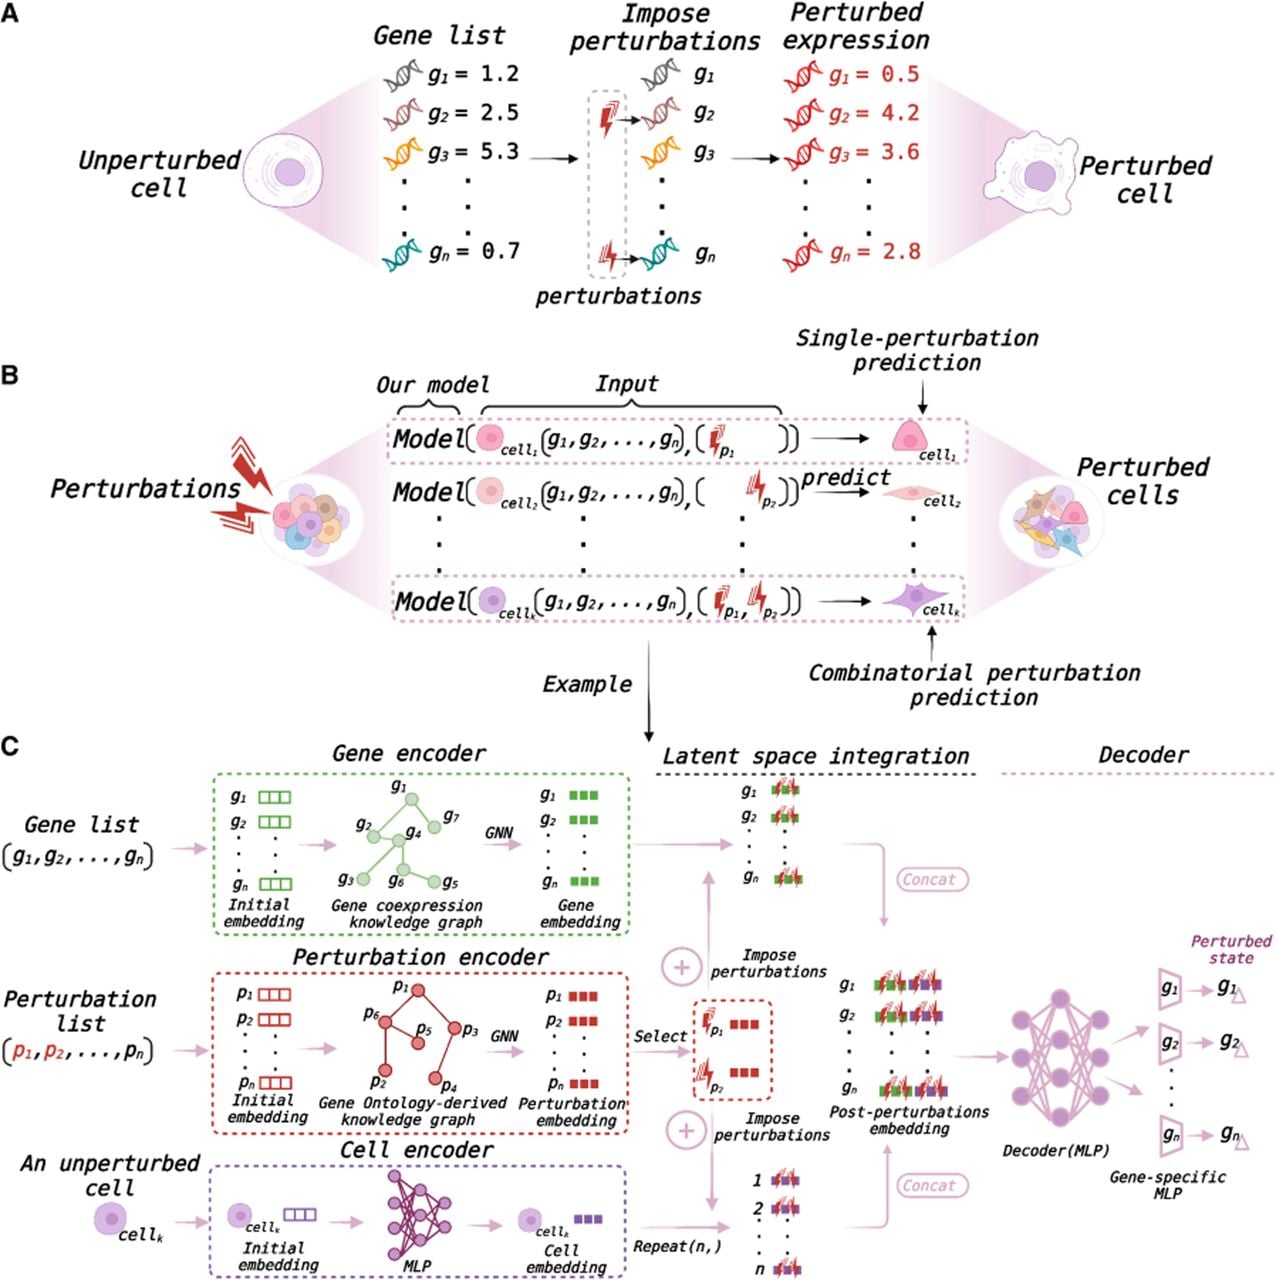
To illustrate the proposed framework, we present an example of combinatorial perturbation response prediction (Fig. 1C). The primary inputs to PRIM include a list of genes, a list of perturbation conditions, and the expression profile of an unperturbed cell. The objective is to predict the gene expression profile of this unperturbed cell after exposure to a given combinatorial perturbation. Specifically, the gene list, perturbation list, and unperturbed cell are encoded separately. For the gene list, we construct a gene coexpression network and apply a graph neural network (GNN) to learn embeddings for individual genes. For the perturbation list, we construct GO graphs and again employ a GNN to obtain embeddings of perturbation conditions. Detailed descriptions of the gene coexpression network and GO graph are provided in the Methods section. For the unperturbed cell, its gene expression profile serves as the initial embedding, which is further encoded using a multilayer perceptron (MLP) to obtain the corresponding cell embedding.
In the latent space, the embeddings of selected perturbation conditions are integrated with the gene and cell embeddings, thereby capturing perturbation effects at both the gene and cellular levels. The perturbed gene embeddings and cell embeddings are then concatenated to form the final postperturbation embedding. This embedding is subsequently decoded using an MLP and a gene-specific MLP to generate predictions of postperturbation expression changes for each gene. Through these steps, PRIM supports both single-perturbation and combinatorial-perturbation response prediction.
Analysis of gene expression in control cells
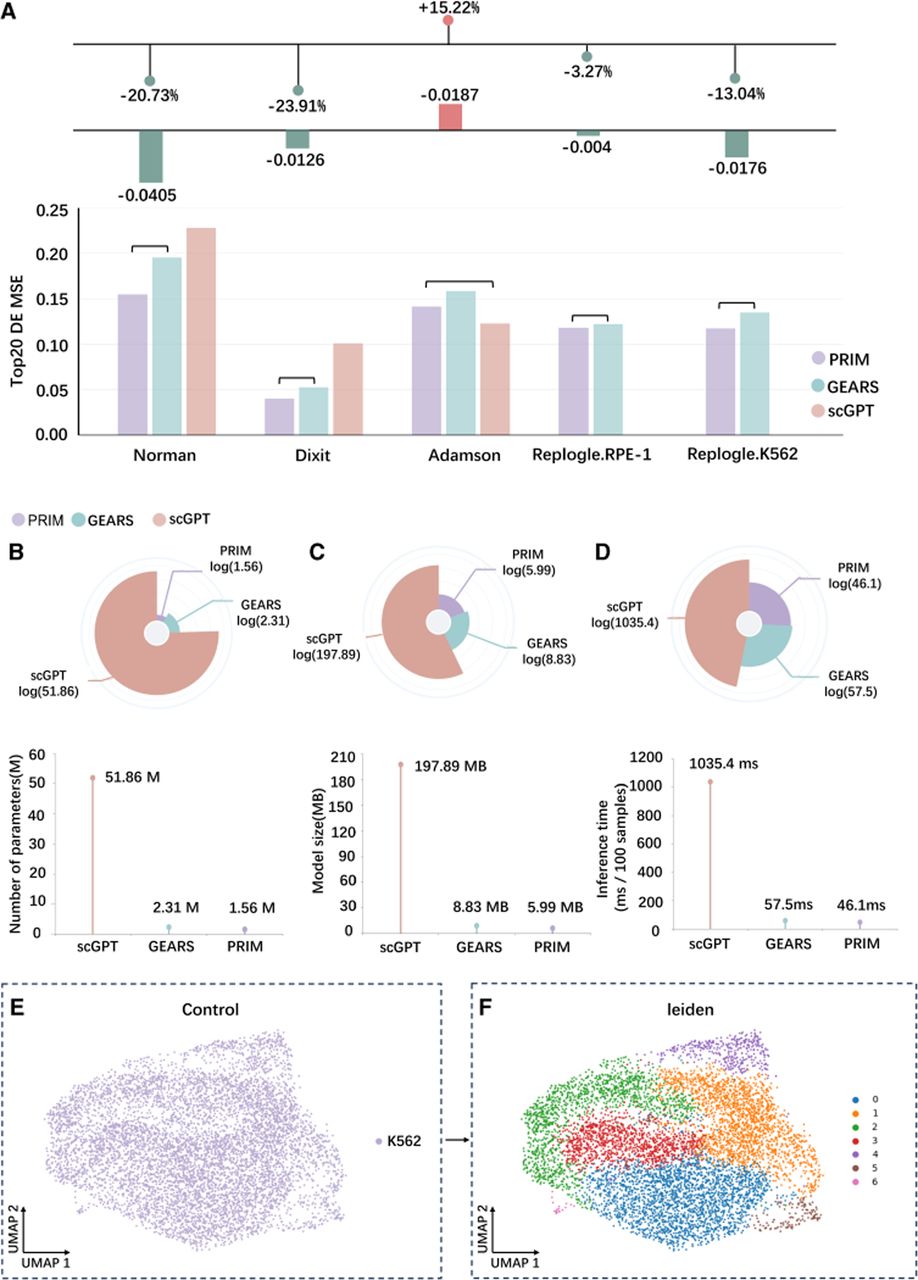
The purpose of this study is to use a deep learning model to predict gene expression in a cell after perturbation. When constructing the data set, we randomly sample an unperturbed cell for each perturbed cell. After the model predicts the change in gene expression following perturbation, we add this to the expression of the unperturbed cell. As can be seen from the above description, PRIM uses these unperturbed cells to make predictions. Therefore, at the beginning of the experiment, we conducted a preliminary analysis of these control cells. We selected a collection of all control cells from the Norman data set, downscaled their gene expression, and plotted a UMAP plot (Fig. 2E). We colored the sample points according to cell type. It can be seen that all control cells belong to the K562 cell type. However, the distribution of the sample points in the plot is clearly more scattered. This suggests that even within the same cell type, there may be heterogeneity in gene expression between individual cells. Based on this, we further clustered the cells after dimensionality reduction. The clustering algorithm used was Leiden (Blondel et al. 2008; Traag et al. 2019) with the resolution parameter set to 0.3, and the results are shown in Figure 2F. As can be seen in the figure, multiple clusters were still clustered with a small setting of the resolution parameter, which further illustrates the existence of heterogeneity among the cells in the control group. Similarly, Supplemental Figure S1 shows that the perturbed cells were also clustered into multiple clusters. We believe that these heterogeneities cannot be ignored and therefore added cell encoding and considered the effects of perturbation at the cellular level when building the model. The framework of PRIM is shown in Figure 1. Splicing the perturbed cellular embeddings after the gene embeddings acts similarly to introducing positionally encoded embeddings.
Comparison of predictive performance, model efficiency, and preliminary analysis of control cells. (A) Mean squared error (MSE) of predictions for the top 20 differentially expressed genes across five data sets: Norman et al. (2019), Dixit et al. (2016), Adamson et al. (2016), Replogle.RPE-1, and Replogle.K562 (Replogle et al. 2020). A lower MSE indicates better performance, and the same applies below. (B–D) Evaluation of model efficiency on the Norman data set. (B) Comparison of model parameter counts. (C) Comparison of model sizes. (D) Comparison of forward inference time per 100 samples. (E) Downscaled visualization of gene expression profiles of control cells from the Norman data set. (F) Clustering of control cells using the Leiden algorithm with the resolution parameter set to 0.3.
A comparison of model performance and lightweighting
Next, we compared PRIM's performance with that of other deep learning models across five data sets, with the overall results presented in Figure 2A. PRIM achieved superior performance in terms of the MSE metric when evaluated on the top 20 differentially expressed genes from the Norman, Dixit, Replogle.RPE-1, and Replogle.K562 data sets. Notably, for the Norman data set, which contains multiple perturbation combinations, PRIM yielded a more substantial improvement over GEARS. For the Replogle.RPE-1 and Replogle.K562 data sets, certain perturbation conditions were absent from the gene list in the gene expression matrix. Because scGPT can only predict postperturbation gene expression when the perturbation conditions are present in the gene list, excluding those absent conditions would result in the loss of a considerable amount of usable data. Therefore, for these two data sets, we conducted comparisons exclusively with GEARS. Even so, scGPT achieved the best performance on the Adamson data set, underscoring the potential of single-cell foundation models for perturbation prediction. On this data set, PRIM performed less well than scGPT but still outperformed GEARS.
Beyond predictive performance, we also assessed the degree of model lightweighting in terms of the number of parameters, model size, and forward inference time per 100 samples, as shown in Figure 2, B through D. The results indicate that PRIM exhibits a clear advantage in lightweighting. Although scGPT shows higher values across all metrics owing to its role as a foundation model, PRIM remains more lightweight than GEARS and achieves a modest improvement in forward inference speed, which can substantially reduce prediction time in practical applications.
More detailed evaluation of models on single perturbation data sets
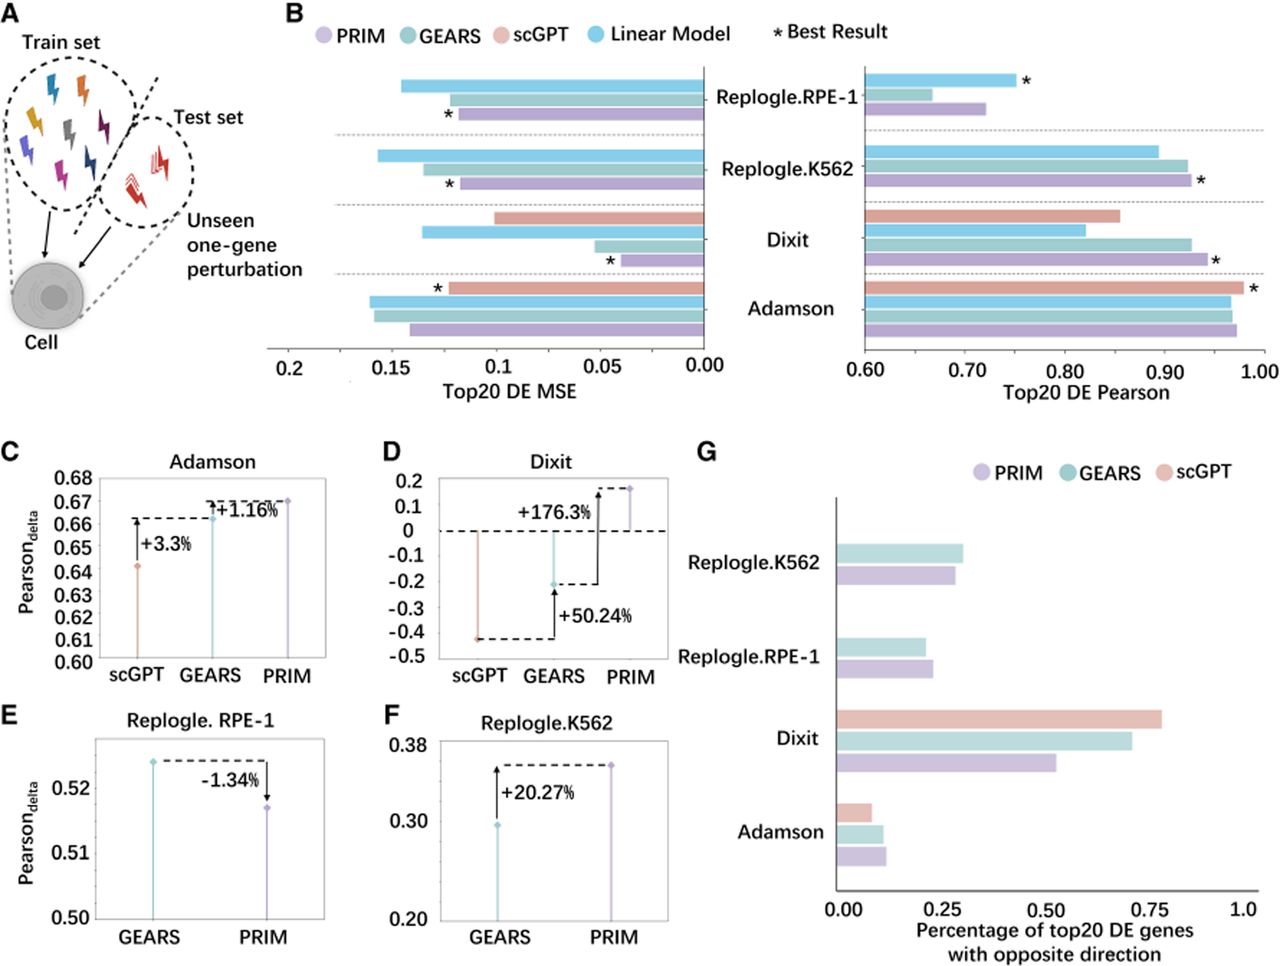
The Adamson, Dixit, Replogle.RPE-1, and Replogle.K562 data sets used in our experiments are all single-perturbation data sets, and their training-test split scheme is illustrated in Figure 3A. In addition to the MSE metric, we compared the Pearson's correlation of the top 20 differentially expressed genes predicted by each model (Fig. 3B). We included the linear model (Ahlmann-Eltze et al. 2025) as a baseline for comparison. Across the four data sets and two evaluation metrics, PRIM achieves the best performance in most cases. scGPT shows the best performance on both metrics in the Adamson data set, whereas the linear model achieves the highest Pearson's correlation on the Replogle.RPE-1 data set. These results indicate that simple baseline models can remain competitive with more complex deep learning approaches in certain scenarios. Nevertheless, compared with the linear model, our proposed PRIM demonstrates a consistent performance advantage across most data sets and metrics, indicating that deep learning models can still provide additional predictive power in this context. A direct comparison between PRIM and the linear model is provided in Supplemental Figure S7A. Furthermore, we evaluated the Pearsondelta metric, detailed in Supplemental Table S1, with the results shown in Figure 3, C through F. Interestingly, for this metric, PRIM achieved the best performance on the Adamson data set, whereas scGPT performed the worst. On the Dixit data set, PRIM showed a substantial improvement, shifting from a negative to a positive value, whereas on the Replogle.RPE-1 data set, it underperformed compared with GEARS. Because perturbations can induce both positive and negative changes in gene expression, we also examined the percentage of model predictions with incorrect directions of change, as illustrated in Figure 3G. PRIM exhibited the smallest percentage of errors on the Replogle.K562 and Dixit data sets. These findings indicate that different evaluation metrics produced different performance rankings; nevertheless, PRIM achieved optimal performance on most data sets across the various evaluation metrics.
Training-test perturbation partitioning and performance comparison across single-perturbation data sets (Adamson, Dixit, Replogle.RPE-1, and Replogle.K562). (A) Schematic of the training-test perturbation partitioning strategy for single-perturbation data sets. (B) Comparison of Pearson's correlation and MSE metrics for different models in predicting the top 20 differentially expressed genes. Higher Pearson's correlation indicates better performance, and the same applies below. (C–F) Performance comparison of different models based on the Pearsondelta metric across single-perturbation data sets. A higher Pearsondelta indicates better performance. (C) Adamson. (D) Dixit. (E) Replogle.RPE-1. (F) Replogle.K562. (G) Percentage of incorrect model predictions regarding the direction of change in the top 20 differentially expressed genes. Lower values of this metric indicate better performance, and the same applies below.
Evaluation of combinatorial perturbation predictions
First, we performed a training test split on the Norman data set, with the division scheme illustrated in Figure 4A. The test set was further divided into four subsets: three combined-perturbation subsets—(zero seen of two), (one seen of two), and (two seen of two)—and one single-perturbation subset. In our evaluation, we categorized test subsets according to the presence of perturbations in the training set: (zero seen of two) indicates that neither perturbation in a combination was observed during training, (one seen of two) indicates that one perturbation was observed, and (two seen of two) indicates that both perturbations were observed. Generalization difficulty increases progressively from the (two seen of two) subset to the (zero seen of two) subset. We compared the percentage of errors in predicting the direction of change for each model on these subsets (Fig. 4B). PRIM exhibited the lowest error rates across all four subsets. We also evaluated the MSE and Pearson's correlation of the top 20 differentially expressed genes predicted by each model on these subsets (Fig. 4C,D). PRIM achieved a clear advantage in MSE across all subsets, whereas for Pearson's correlation, it performed best on the three combined-perturbation subsets and underperformed scGPT only on the single-perturbation subset. These results highlight the strong advantage of PRIM in predicting outcomes for combined perturbations.
Training-test perturbation partitioning on the Norman data set with combined perturbations and performance comparison across models. (A) Schematic of the training-test partitioning strategy for combined perturbations, along with a single perturbation test subset divided out as shown in Figure 3A, resulting in four test subsets in total. (B) Percentage of incorrect predictions by different models regarding the direction of change in the top 20 differentially expressed genes across each test subset. (C) Comparison of MSE metrics of different models for predicting the top 20 differentially expressed genes across each test subset. (D) Comparison of Pearson's correlation metrics of different models for predicting the top 20 differentially expressed genes across each test subset. (E) Visualization of the predicted changes in the top 20 differentially expressed genes from PRIM relative to control cells compared with the true values under the perturbation combination CEBPE+CEBPB.
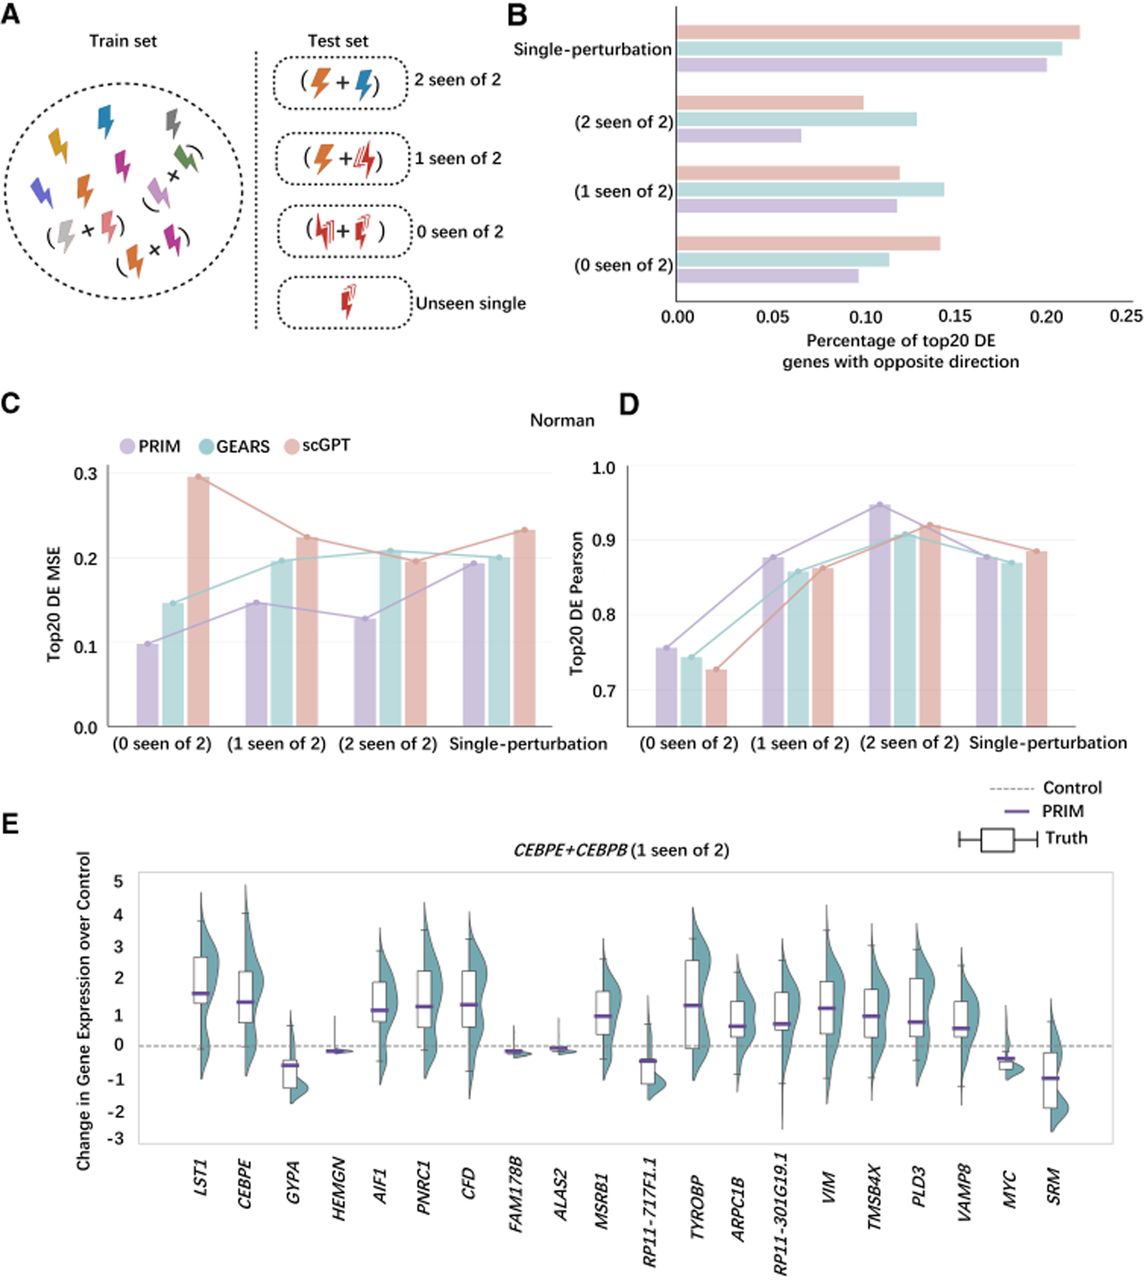
To more intuitively illustrate the agreement between PRIM's predictions and the true values, we selected a perturbation pair from the (one seen of two) subset: CEBPE+CEBPB. We visualized the predicted values of the top 20 differentially expressed genes against their true values, using the gene expression of control cells as a reference (Fig. 4E). For this visualization, PRIM was tasked with predicting the postperturbation gene expression for this combination in 300 cells, after which we computed the mean predicted values. Consequently, PRIM's predictions are presented as points in the figure. Two key observations can be made. First, for all 20 differentially expressed genes, PRIM correctly predicted the direction of change in expression following perturbation. Second, the predicted changes in gene expression were closely clustered around the central tendency of the true values, indicating that PRIM accurately captures not only the direction but also the magnitude of expression changes for differentially expressed genes under perturbation.
In summary, after accounting for perturbation effects at the cellular level, PRIM achieved a substantial improvement in predicting gene expression changes for combined perturbations compared with GEARS. This finding also suggests that the predictive performance of deep learning models on postperturbation gene expression can be enhanced by incorporating more informative prior knowledge.
Predictions about genetic interactions
We also evaluated the performance of different models across various genetic interaction subtypes, focusing on the five nonadditive interaction types defined by Norman et al. (2019): synergy, suppression, redundancy, neomorphism, and epistasis. The bar chart representations of these nonadditive interactions are shown in Figure 5C, whereas the bar chart representation of additive interactions is provided in Figure 5A. These visualizations highlight the diverse patterns of nonadditive gene interactions. We compared the predictive performance of a naive additive prediction approach with that of deep learning models across these nonadditive interaction subtypes. The MSE performance of the different models in predicting gene expression across each genetic interaction subtype in the test set is presented in Figure 5C. PRIM achieved the best performance on the synergy and redundancy subtypes and matched GEARS on the neomorphism subtype. In contrast, both GEARS and scGPT outperformed PRIM on the suppression subtype. Notably, the naive additive model yielded the best performance on the epistasis subtype, suggesting that there remains scope for deep learning models to further enhance their generalization capabilities. We further compared the overall performance of each model across all subtypes, as shown in Figure 5B, in which PRIM achieved the best overall results. We then evaluated the accuracy of each model in predicting specific genetic interaction subtypes, with the results presented in Supplemental Figure S2. The parameter settings and threshold values used to determine the predicted subtypes are detailed in Supplemental Table S2. As shown in Supplemental Figure S2, PRIM maintained the highest overall accuracy and performed best on three specific subtypes: synergy, redundancy, and epistasis. In contrast, GEARS achieved the highest accuracy on the suppression subtype, consistent with the results reported in Figure 5C. In summary, it can be seen that PRIM is more adept at predicting synergy subtypes, whereas GEARS is more adept at predicting suppression subtypes.
Bar chart representations of genetic interaction subtypes and model performance in genetic interaction prediction. (A) Bar chart representation of additive interactions. (B) Comparison of MSE performance of different models on the test set considering all nonadditive genetic interactions collectively. (C) Bar chart representation of nonadditive genetic interaction subtypes (synergy, suppression, redundancy, neomorphism, and epistasis), along with the MSE performance of different models in predicting each subtype individually. (D) Visualization of the nonadditive effects of the perturbation combination UBASH3B+PTPN9 on gene expression. (True) Ground-truth values, (PRIM) predictions from PRIM, and (Additive) predictions from the additive model. UBASH3B and PTPN9 indicate the effects of the corresponding single perturbations. PRIM-True and Additive-True represent the residuals between predictions and ground truth for PRIM and the additive model, respectively.
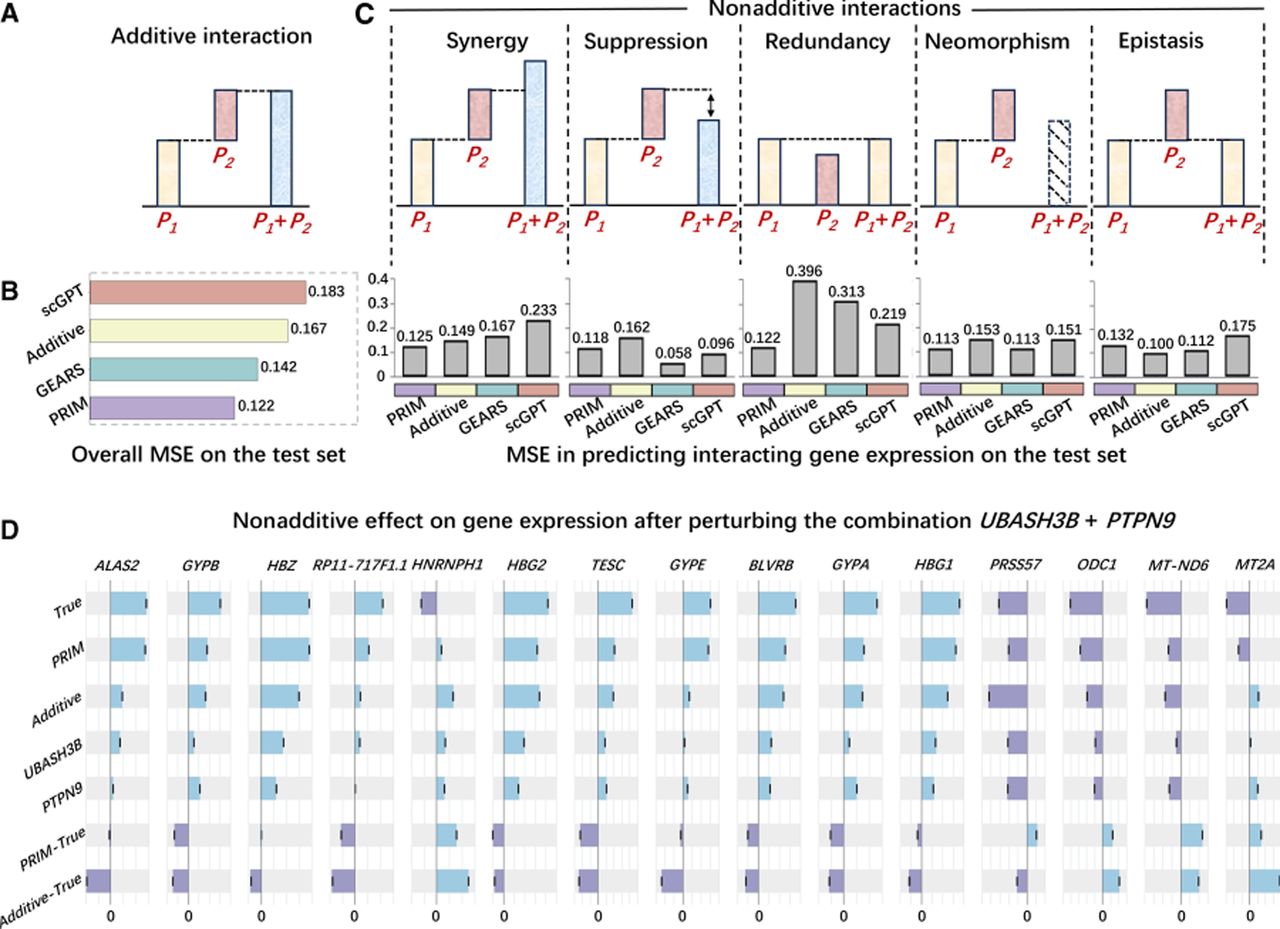
To more clearly illustrate the differences between genetic nonadditive interactions and additive predictions, we selected the combined perturbation UBASH3B+PTPN9 from the synergy subtype and visualized the true expression values of the top 15 most variable genes alongside the predictions of PRIM and the additive model (Fig. 5D). For several genes, such as ALAS2, GYPB, and HBZ, the discrepancy between the true values and the naive additive model's predictions is evident, indicating that the effects of pairwise interactions on certain genes cannot be explained by a simple additive mechanism. In contrast, the predictions from PRIM are notably closer to the true values, suggesting its ability to capture such nonadditive effects. Because genetic interactions are not limited to additive forms, the accurate identification of different interaction types is essential, and deep learning models hold considerable promise for predicting complex genetic interactions.
Analysis and visualization of phenotypes
In this section, we applied PRIM to predict gene expression profiles for all pairwise combinations of the 102 single-perturbation conditions reported by Norman et al. (2019), resulting in a total of 5151 combinatorial perturbations. The predicted expression profiles for all perturbations were first downscaled and then clustered using the Leiden algorithm. To obtain a fine-grained grouping, we set the resolution parameter to its default value of one. The resulting clusters are shown in Supplemental Figure S3. Notably, the clusters outlined with dashed circles are dominated by the genes HBA2 and CEBPA, respectively, and were selected for further analysis.
Using the five phenotypes defined by Norman et al. (2019), we annotated the visualizations of the predicted results, as shown in Figure 6, A and B. Figure 6A displays the distribution of each phenotype within the training set, with several perturbation conditions labeled for reference. Figure 6B presents the visualization of all 5151 predicted combinatorial perturbations and their corresponding phenotype distributions. The cluster highlighted with a dashed circle in Figure 6B corresponds to combinations involving CEBPA, which is associated with the granulocyte phenotype. This cluster is also observed as an independent grouping in Supplemental Figure S3. Consistently, the expression pattern of CEBPA in Figure 6C indicates relatively high expression within this cluster. These findings suggest that CEBPA plays a dominant role when combined with other genes, in agreement with the observations reported by Norman et al. (2019). Collectively, these results demonstrate that PRIM is capable of capturing associations between combinatorial perturbations.
Distributions of individual phenotypes in the training set and in the 5151 combinatorial perturbations predicted by PRIM, along with gene expression patterns. (A) Distribution of individual phenotypes in the training set. Each × represents a perturbation condition, and several conditions are randomly labeled. (B) Distribution of individual phenotypes in the 5151 combinatorial perturbations predicted by PRIM. Clusters highlighted with dashed circles correspond to CEBPA in combination with other perturbations. (C) Expression of CEBPA. (D–F) Expression of three marker genes associated with the granulocyte phenotype: CSF3R (D), LST1 (E), and ITGAM (F).
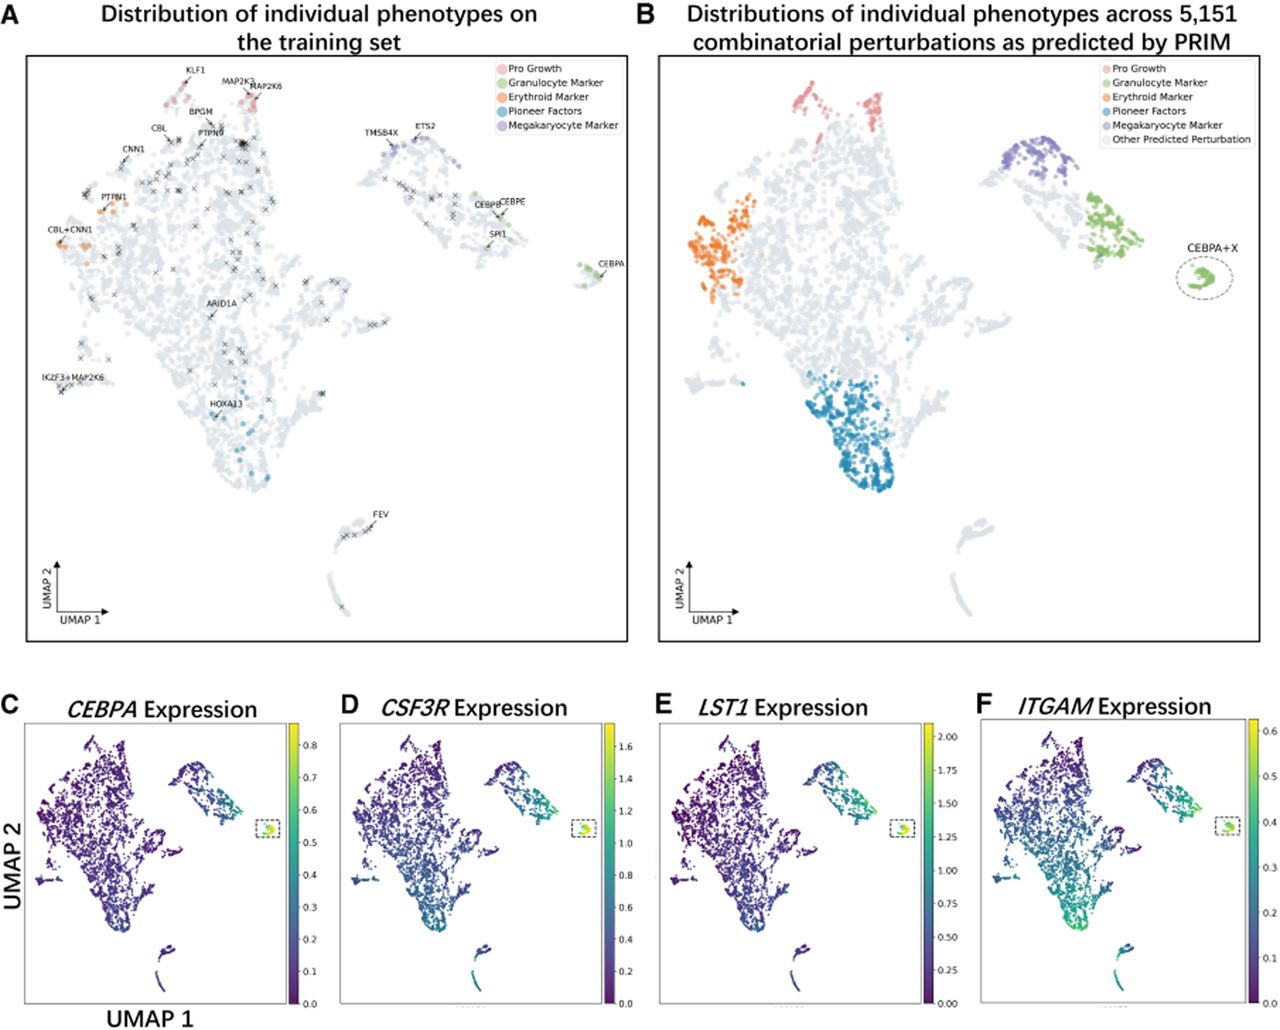
Next, we examined three marker genes associated with the granulocyte phenotype—CSF3R, LST1, and ITGAM—and analyzed their expression patterns, as shown in Figure 6, D through F. All three genes exhibited relatively high expression within the CEBPA-dominated cluster, further confirming its granulocyte phenotype. We then analyzed four marker genes associated with the erythroid phenotype—GYPA, HBA2, HBG1, and HBZ—with results presented in Supplemental Figure S4. These genes showed consistently high expression in the HBA2-dominated cluster identified in Supplemental Figure S3. Because parts of this cluster overlap with the training set, it does not represent a newly identified cluster. Nevertheless, the high expression of erythroid markers in this cluster is reminiscent of the novel biologically meaningful phenotypes previously reported by GEARS. To explore this further, we visualized a subset of combinatorial perturbations from this cluster (Supplemental Fig. S5) and found that they overlap with those present in the new cluster identified by GEARS (Roohani et al. 2024). This suggests that even in the absence of novel clustering patterns, PRIM retains the potential to reveal previously unrecognized, biologically meaningful phenotypes.
Analyzing the impact of cell-embedded modules
To investigate the impact of modeling perturbation effects at the cellular level, we first performed ablation experiments on the Norman data set by removing the cellular coding module (Fig. 7A). When this module was excluded, the MSE values of the top 20 differentially expressed genes increased across all four test subsets, with particularly pronounced increases in the three combinatorial perturbation subsets. Similarly, Pearson's correlation values decreased in all subsets, and the decline was more substantial in combinatorial perturbation settings. These findings indicated that incorporating cellular-level perturbation effects improved the predictive performance of PRIM. Meanwhile, we performed ablation experiments on the GO graph and the gene coexpression graph, as shown in Supplemental Figure S7C. The results indicate that removing either the GO graph or the gene coexpression graph leads to a certain decrease in performance, with the GO graph having a larger overall impact. These findings highlight the importance of perturbation condition encoding.
Ablation experiments on the cell-embedding module and further analyses. (A) Performance of PRIM on the Norman data set after removing the cell-embedding module. An asterick indicates the best performance. (B) Expression of the differentially expressed gene LST1 under the combinatorial perturbation CEBPE+CEBPB, compared with its expression in control cells and with control values shifted by a fixed increment Δ. (C) Expression changes of selected differentially expressed genes under the combinatorial perturbation ETS2+MAPK1, showing the ground truth, predictions from PRIM, and predictions after removing the cell-embedding module.
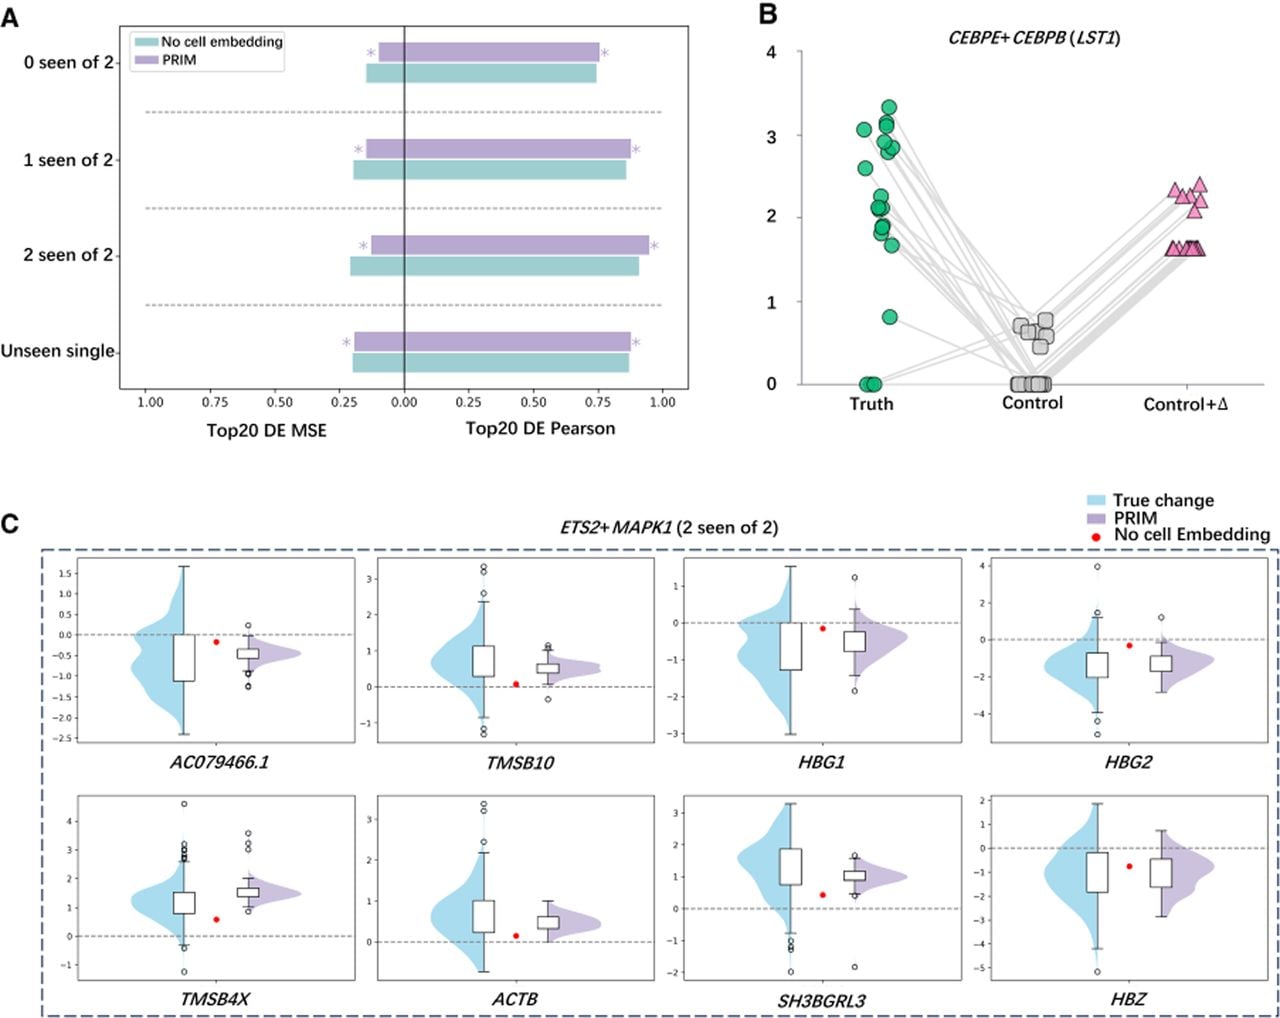
To further explore how this improvement arose, we examined the gene LST1 under the combinatorial perturbation CEBPE+CEBPB (Fig. 7B). We sampled 20 control cells and 20 perturbed cells and simulated the perturbations by assuming a fixed additive effect on the control cells. In this scenario, the expression values in perturbed cells should have been parallel shifts of those in control cells. However, the actual perturbed expression values showed heterogeneous, nonparallel shifts, suggesting that perturbation effects varied across individual cells. This observation explained why the cell-embedding module improved performance: With the module included, PRIM predicted heterogeneous gene expression changes across cells; without it, predictions were constrained to fixed shifts.
We next analyzed the combined perturbation ETS2+MAPK1 and visualized gene expression changes for several differentially expressed genes (Fig. 7C). The true expression changes displayed broad, heterogeneous distributions, whereas PRIM without cell embeddings predicted uniform fixed shifts. This mismatch was particularly problematic when true changes were distributed around zero with both positive and negative values (e.g., HBG1 and HBG2), as fixed predictions near zero led to large errors. In contrast, PRIM with cell embeddings captured the dispersed distributions and provided more accurate predictions.
We observed similar phenomena in additional examples (Supplemental Fig. S6). In Supplemental Figure S6A, real expression changes were centered near zero but spread across both positive and negative values, whereas the fixed prediction failed to capture this variation, resulting in larger errors. In Supplemental Figure S6B, real changes were mostly positive, and PRIM provided more accurate estimates. In Supplemental Figure S6C, real changes were mostly positive, whereas fixed predictions were negative, further amplifying errors.
Taken together, these results demonstrated that accounting for perturbation effects at the cellular level enabled PRIM to generate heterogeneous predictions across cells that better matched real-world gene expression changes. This heterogeneity appeared to be the key factor underlying the improved predictive performance observed when the cell-embedding module was included.
Discussion
In this study, we explicitly model perturbation effects at the cellular level by introducing a dedicated cell-embedding module. Unlike approaches that treat all cells within a condition as homogeneous, PRIM leverages gene expression profiles from control cells to initialize cell embeddings, thereby encoding cell-specific baseline states as informative prior knowledge. This design allows PRIM to account for intrinsic heterogeneity among cells, even within the same cell type, and to condition perturbation responses on each cell's baseline expression profile. By incorporating such prior information, PRIM can better approximate realistic gene expression changes following perturbation rather than learning perturbation effects solely from scratch.
Empirically, this strategy leads to consistent performance improvements across multiple data sets, with particularly notable gains in predicting combinatorial perturbations. These results suggest that explicitly modeling cell-specific context is especially beneficial when perturbation effects are nonlinear or context dependent, as is often the case for multigene perturbations.
Conceptually, PRIM differs from existing methods such as GEARS and scGPT in that performance gains are achieved not by increasing architectural complexity but by integrating biologically meaningful prior knowledge into the model. Despite being more lightweight, PRIM demonstrates faster forward inference while achieving superior or comparable predictive accuracy. This highlights that incorporating informative priors can be a more effective and efficient strategy than relying solely on deeper or more complex model architectures for modeling gene expression responses to genetic perturbations.
Through deep learning modeling, we can effectively address the efficiency challenges arising from the combinatorial explosion of perturbations. Moreover, by predicting gene expression under various combinatorial perturbations, we are able to investigate diverse genetic interaction mechanisms. Genetic interactions encompass multiple subtypes, not limited to simple additive interactions, making it challenging for linear or additive models to accurately capture nonadditive effects. In contrast, deep learning models are better equipped to recognize such nonadditive interactions. Our experiments further demonstrate that both PRIM and GEARS outperform simple additive models in predicting genetic interactions, highlighting the advantages and potential of deep learning approaches in this context.
Nevertheless, our results also indicate that there remains room for improving the generalization ability of deep learning models for genetic interaction prediction. Additionally, by modeling gene expression across a wide range of combinatorial perturbations, we can explore novel biologically meaningful phenotypes. These newly identified phenotypes often reflect underlying biological mechanisms, offering valuable opportunities for further investigation. Overall, our experiments suggest that PRIM has the capacity to learn associations between perturbation combinations and to uncover new, biologically meaningful phenotypes. This also underscores the significant utility of deep learning approaches in advancing research on genetic perturbations.
Of course, deep learning models also have certain limitations. PRIM uses perturbation embeddings derived from GO-term overlap via Jaccard similarity, which does not capture regulatory direction or mechanism. Although numerical accuracy is ensured by our loss functions, the model still lacks strong interpretability, a common challenge in deep learning–based perturbation prediction. Additionally, the linear combination of perturbation, gene, and cell embeddings may fail to capture complex interactions such as suppression or epistasis. Although we explored more expressive methods like cross-attention, these led to performance degradation, and PRIM, while performing best overall, shows weaker results on suppression and epistasis, which remains an area for future work. Regarding zero-shot generalization, the genetic perturbation data sets used are inherently limited by shared gene lists across training and testing, making strict zero-shot validation difficult. Nevertheless, we ensure that perturbation conditions from the test set are not observed during training. Although PRIM is primarily validated on K562 and RPE1 cells, it can be retrained with data from other cell types, making it adaptable to different genetic perturbation data sets. Systematic evaluation on unseen cell types represents an important avenue for future work and would further strengthen evidence for the biological generalizability of the framework. Currently, PRIM predicts only the presence or absence of a perturbation, without accounting for the magnitude or dose of the perturbation. Given that data sets capturing dose-dependent effects are already available (Huang et al. 2025), future research could explore genetic perturbations in greater detail by considering perturbation dose, which would provide more nuanced insights into gene regulation under combinatorial perturbations.
Finally, PRIM demonstrates excellent performance in predicting genetic perturbations, highlighting the potential of deep learning in this field. Beyond methodological advancements, our work also has practical implications for drug target discovery, precision medicine, and virtual cell modeling, underscoring its broad significance. Moreover, this study provides a reference framework for the application of deep learning in genetic perturbation research, offering guidance for future studies in this area.
Methods
PRIM adopts an encoder–decoder architecture, in which the encoder is composed of three modules: a perturbation encoder, a gene encoder, and a cell encoder. The embeddings generated by each module are integrated through an allocation mechanism to produce gene embeddings under perturbation for each cell. These integrated embeddings are then decoded by two decoders—one being a shared-weight MLP and the other a gene-specific MLP—to predict the perturbation-induced gene expression changes at the single-cell level.
Encoding perturbations in conjunction with the GO graph
The GO graph is defined as a prior knowledge graph with perturbation conditions as nodes, and the node set is denoted as Vp. To define the edges between nodes, the GO database is first screened to obtain the sets of GO terms associated with each perturbation gene (Harris et al. 2004). For two perturbation condition genes k and j, whose sets of GO terms are GOk and GOj respectively, Sk,j is defined as the proportion of shared pathways between the two perturbation genes, as shown below:. In the event of a threshold δ being established and in the circumstance that Sk,j > δ, it is to be considered that there is an edge between k and j, with the edge weight being Sk,j. Subsequent to the aforementioned steps, the edge set Ep and the edge weights are determined, and the GO graph can be represented as . The GO-based perturbation graph is intended to capture high-level functional relationships among genes and to enable information propagation between functionally related genes. We use an undirected GO-based graph, as it provides a robust and scalable framework while avoiding the introduction of potentially noisy directional assumptions. We then preliminarily encode the nodes in Vp as learnable embeddings Xρ,d ∈ ℝρ×d to serve as initial node features, where ρ denotes the number of nodes and d denotes the embedding dimension. Finally, a GNN is employed to encode perturbations based on the GO graph, where Hp is the final perturbation encoding embedding.
Leveraging the gene coexpression network for gene encoding
Similarly, the encoding of genes is necessary, preceded by the construction of a gene coexpression network. In this network, genes are represented as nodes, with the node set denoted as Vg. For any given gene u, the following procedure is undertaken. First, the Pearson's correlation between the gene's own expression and that of other genes in the training set is calculated. Using the entire training data set to construct the gene coexpression network is more advantageous than using only control cells, as indicated by the analysis shown in Supplemental Figure S7B. Then, the Ttop genes with the highest correlations are sorted and selected. Finally, the genes with correlations greater than the threshold β are selected from these Ttop genes as the neighbor nodes of gene u. This process determines the edge set for gene u, with the Pearson's correlation serving as the edge weight. By performing the aforementioned operations on all genes, it is possible to determine the edge set Eg and edge weights of the gene coexpression network. This results in the definition of the gene coexpression network as . In the subsequent stage of the process, the genes contained within the node set Vg are to be encoded, in a preliminary manner, into learnable embeddings Xn,d ∈ ℝn×d, where n denotes the number of gene nodes. Specifically, we use the nn.Embedding function to initialize embeddings based solely on gene identities (i.e., gene names), without incorporating any gene expression values during the encoding process. Utilizing the gene coexpression network Ggene, a GNN is employed to encode genes and obtain the final gene embeddings .
Encoding cells
To construct the data set, it is necessary to sample from a set of unperturbed cells, namely, the control group cells. PRIM then predicts the transcriptional expression after perturbation based on these unperturbed cells. In this step, the randomly sampled unperturbed cells are to be encoded. Suppose we randomly sample an unperturbed cell c with Xc ∈ ℝ1×n. We use Xc as the initial embedding for c, then encode it using an MLP to obtain the embedding for cell c as Hc = MLPc(Xc) ∈ ℝ1×d. This is exemplified by a single cell; in the experiment, all randomly sampled unperturbed cells in the data set will be encoded.
Integration of postcoding perturbation embedding, gene embedding, and cellular embedding
We take a cell as an example to describe how to integrate the encoded perturbation embedding, gene embedding, and cellular embedding. It is known that the perturbation embedding is Hp ∈ ℝρ×d, the gene embedding is Hg ∈ ℝn×d, and the cellular embedding is Hc ∈ ℝ1×d. Assuming the set of perturbation conditions to be imposed on this cell is Pset = {p1, p2, …, pl}, where l is the number of perturbations. Perturbation embeddings corresponding to all perturbation conditions in Pset are selected from Hp and then summed; namely, . The next step is to process them using an MLP; namely, , where abstractly represents the effects of all the perturbations that are about to be imposed on this cell. The perturbation impact is assigned to each gene embedding, thereby yielding . A similar process is then undertaken for the cell embedding, yielding , which represents the impact of the perturbation at the cell level. Finally, splicing to each gene embedding in yields Hemb ∈ ℝn×2d, which is the result of integrating perturbation embeddings, gene embeddings, and cell embeddings on the cell and which abstracts the effects of perturbations at the gene level and the cellular level, reflecting the cellular specificity.
Decoding the perturbation-induced gene expression changes
Here we aim to decode perturbation-induced gene expression changes from the perturbed gene embeddings Hemb. Two decoders are utilized in the decoding process: One is a shared-weight MLP, which is shared at the gene level; the other is a gene-specific MLP. First, it goes through the first decoder; namely, . Then, it goes through the second decoder, in which each gene embedding in D1 is assigned a parameter vector of dimension d and a bias term to map each gene embedding to a scalar; that is, the embedding of gene u in D1, , and is PRIM's prediction of the expression change of gene u under perturbation induction. The implementation of this process for all gene embeddings in D1 will result in the model-predicted expression change of all genes under perturbation induction, denoted as D2 ∈ ℝn×1. Finally, the summation of the gene expression Xc of the unperturbed cell, , is the model-predicted gene expression result of that cell after perturbation. This is an example of a single cell, which can be generalized to multiple cells.
Direction-aware loss function
Following the introduction of the overall process framework of PRIM, the next step is to optimize PRIM's parameters. To this end, a form similar to the mean square error is used to make PRIM fit the real value directly. Based on this, PRIM includes a directional loss to encourage correct up- or downregulation trends in gene expression, in addition to a standard regression loss for numerical accuracy. Although the directional loss is not fully smooth, it is piecewise differentiable and acts as an auxiliary term, so it does not adversely affect convergence. This design allows the loss to encode biologically meaningful constraints without dominating the primary optimization objective. That is to say, the gain of the perturbation on the different directions of gene expression is considered, and the overall loss function is expressed as follows:
Data sets
This study utilized data preprocessed by GEARS (Roohani et al. 2024), originally sourced from Norman et al. (2019), under NCBI Gene Expression Omnibus (GEO; https://www.ncbi.nlm.nih.gov/geo/) accession numbers GSE133344; Adamson et al. (2016), GSE90546; Dixit et al. (2016), GSE90063; and Replogle et al. (2020). The Replogle et al. data set is available for download at Figshare (https://doi.org/10.25452/figshare.plus.20022944).
Code availability
The code implementation of PRIM proposed in this study is available at GitHub (https://github.com/fxh1001/GPR) and as Supplemental Code.
Competing interest statement
The authors declare no competing interests.
Acknowledgments
This publication is based upon work supported by the King Abdullah University of Science and Technology (KAUST) Office of Research Administration (ORA) under award nos. REI/1/5289-01-01, REI/1/5992-01-01, URF/1/6713-01-01, and FCC/1/5932-12-11; Center of Excellence for Smart Health (KCSH), under award no. 5932; and Center of Excellence on Generative AI, under award no. 5940.
Author contributions: X.F. and C.Y. designed research. X.F., C.Y., C.C., and A.G. performed research. X.F. and Y.S. analyzed data. X.F., C.Z., X.G., L.W., F.C., Q.Z., and Z.Z. discussed research and results. X.F., C.Y., and F.C. wrote the paper.
Notes
[1] Supplementary material [Supplemental material is available for this article.]
[2] Article published online before print. Article, supplemental material, and publication date are at https://www.genome.org/cgi/doi/10.1101/gr.281523.125.
References
- ↵Adamson B, Norman TM, Jost M, Cho MY, Nuñez JK, Chen Y, Villalta JE, Gilbert LA, Horlbeck MA, Hein MY, 2016. A multiplexed single-cell CRISPR screening platform enables systematic dissection of the unfolded protein response. Cell 167: 1867–1882.e21. 10.1016/j.cell.2016.11.048
- ↵Ahlmann-Eltze C, Huber W, Anders S. 2025. Deep-learning-based gene perturbation effect prediction does not yet outperform simple linear baselines. Nat Methods 22: 1657–1661. 10.1038/s41592-025-02772-6
- ↵Binan L, Jiang A, Danquah SA, Valakh V, Simonton B, Bezney J, Manguso RT, Yates KB, Nehme R, Cleary B, 2025. Simultaneous CRISPR screening and spatial transcriptomics reveal intracellular, intercellular, and functional transcriptional circuits. Cell 188: 2141–2158.e18. 10.1016/j.cell.2025.02.012
- ↵Blondel VD, Guillaume J-L, Lambiotte R, Lefebvre E. 2008. Fast unfolding of communities in large networks. J Stat Mech Theory Exp 2008: P10008. 10.1088/1742-5468/2008/10/P10008
- ↵Bravo González-Blas C, De Winter S, Hulselmans G, Hecker N, Matetovici I, Christiaens V, Poovathingal S, Wouters J, Aibar S, Aerts S. 2023. SCENIC+: single-cell multiomic inference of enhancers and gene regulatory networks. Nat Methods 20: 1355–1367. 10.1038/s41592-023-01938-4
- ↵Bunne C, Roohani Y, Rosen Y, Gupta A, Zhang X, Roed M, Alexandrov T, AlQuraishi M, Brennan P, Burkhardt DB, 2024. How to build the virtual cell with artificial intelligence: priorities and opportunities. Cell 187: 7045–7063. 10.1016/j.cell.2024.11.015
- ↵Cui H, Wang C, Maan H, Pang K, Luo F, Duan N, Wang B. 2024. scGPT: toward building a foundation model for single-cell multi-omics using generative AI. Nat Methods 21: 1470–1480. 10.1038/s41592-024-02201-0
- ↵Dann E, Henderson NC, Teichmann SA, Morgan MD, Marioni JC. 2022. Differential abundance testing on single-cell data using k-nearest neighbor graphs. Nat Biotechnol 40: 245–253. 10.1038/s41587-021-01033-z
- ↵Dixit A, Parnas O, Li B, Chen J, Fulco CP, Jerby-Arnon L, Marjanovic ND, Dionne D, Burks T, Raychowdhury R, 2016. Perturb-Seq: dissecting molecular circuits with scalable single-cell RNA profiling of pooled genetic screens. Cell 167: 1853–1866.e17. 10.1016/j.cell.2016.11.038
- ↵Dong M, Wang B, Wei J, de O. Fonseca AH, Perry CJ, Frey A, Ouerghi F, Foxman EF, Ishizuka JJ, Dhodapkar RM, 2023a. Causal identification of single-cell experimental perturbation effects with CINEMA-OT. Nat Methods 20: 1769–1779. 10.1038/s41592-023-02040-5
- ↵Dong X, Ding L, Thrasher A, Wang X, Liu J, Pan Q, Rash J, Dhungana Y, Yang X, Risch I, 2023b. NetBID2 provides comprehensive hidden driver analysis. Nat Commun 14: 2581. 10.1038/s41467-023-38335-6
- ↵Duan B, Zhou C, Zhu C, Yu Y, Li G, Zhang S, Zhang C, Ye X, Ma H, Qu S, 2019. Model-based understanding of single-cell CRISPR screening. Nat Commun 10: 2233. 10.1038/s41467-019-10216-x
- ↵Frangieh CJ, Melms JC, Thakore PI, Geiger-Schuller KR, Ho P, Luoma AM, Cleary B, Jerby-Arnon L, Malu S, Cuoco MS, 2021. Multimodal pooled perturb-CITE-seq screens in patient models define mechanisms of cancer immune evasion. Nat Genet 53: 332–341. 10.1038/s41588-021-00779-1
- ↵Gavriilidis GI, Vasileiou V, Orfanou A, Ishaque N, Psomopoulos F. 2024. A mini-review on perturbation modelling across single-cell omic modalities. Comput Struct Biotechnol J 23: 1886–1896. 10.1016/j.csbj.2024.04.058
- ↵The Gene Ontology Consortium. 2019. The Gene Ontology Resource: 20 years and still GOing strong. Nucleic Acids Res 47: D330–D338. 10.1093/nar/gky1055
- ↵Harris MA, Clark J, Ireland A, Lomax J, Ashburner M, Foulger R, Eilbeck K, Lewis S, Marshall B, Mungall C, 2004. The Gene Ontology (GO) database and informatics resource. Nucleic Acids Res 32: D258–D261. 10.1093/nar/gkh036
- ↵He B, Xiao Y, Liang H, Huang Q, Du Y, Li Y, Garmire D, Sun D, Garmire LX. 2023. ASGARD is A single-cell guided pipeline to aid repurposing of drugs. Nat Commun 14: 993. 10.1038/s41467-023-36637-3
- ↵Horlbeck MA, Xu A, Wang M, Bennett NK, Park CY, Bogdanoff D, Adamson B, Chow ED, Kampmann M, Peterson TR, 2018. Mapping the genetic landscape of human cells. Cell 174: 953–967.e22. 10.1016/j.cell.2018.06.010
- ↵Huang AC, Hsieh T-HS, Zhu J, Michuda J, Teng A, Kim S, Rumsey EM, Lam SK, Anigbogu I, Wright P, 2025. X-Atlas/Orion: genome-wide perturb-seq datasets via a scalable fix-cryopreserve platform for training dose-dependent biological foundation models. bioRxiv 10.1101/2025.06.11.659105
- ↵Ishikawa M, Sugino S, Masuda Y, Tarumoto Y, Seto Y, Taniyama N, Wagai F, Yamauchi Y, Kojima Y, Kiryu H, 2023. RENGE infers gene regulatory networks using time-series single-cell RNA-seq data with CRISPR perturbations. Commun Biol 6: 1290. 10.1038/s42003-023-05594-4
- ↵Jaitin DA, Weiner A, Yofe I, Lara-Astiaso D, Keren-Shaul H, David E, Salame TM, Tanay A, van Oudenaarden A, Amit I. 2016. Dissecting immune circuits by linking CRISPR-pooled screens with single-cell RNA-seq. Cell 167: 1883–1896.e15. 10.1016/j.cell.2016.11.039
- ↵Jiang L, Dalgarno C, Papalexi E, Mascio I, Wessels HH, Yun H, Iremadze N, Lithwick-Yanai G, Lipson D, Satija R. 2025. Systematic reconstruction of molecular pathway signatures using scalable single-cell perturbation screens. Nat Cell Biol 27: 505–517. 10.1038/s41556-025-01622-z
- ↵Kamimoto K, Stringa B, Hoffmann CM, Jindal K, Solnica-Krezel L, Morris SA. 2023. Dissecting cell identity via network inference and in silico gene perturbation. Nature 614: 742–751. 10.1038/s41586-022-05688-9
- ↵Li X, Loscalzo J, Mahmud A, Aly DM, Rzhetsky A, Zitnik M, Benson M. 2025. Digital twins as global learning health and disease models for preventive and personalized medicine. Genome Med 17: 11. 10.1186/s13073-025-01435-7
- ↵Liberali P, Snijder B, Pelkmans L. 2015. Single-cell and multivariate approaches in genetic perturbation screens. Nat Rev Genet 16: 18–32. 10.1038/nrg3768
- ↵Lotfollahi M, Wolf FA, Theis FJ. 2019. scGen predicts single-cell perturbation responses. Nat Methods 16: 715–721. 10.1038/s41592-019-0494-8
- ↵Monzo C, Liu T, Conesa A. 2025. Transcriptomics in the era of long-read sequencing. Nat Rev Genet 26: 681–701. 10.1038/s41576-025-00828-z
- ↵Nadig A, Replogle JM, Pogson AN, Murthy M, McCarroll SA, Weissman JS, Robinson EB, O'Connor LJ. 2025. Transcriptome-wide analysis of differential expression in perturbation atlases. Nat Genet 57: 1228–1237. 10.1038/s41588-025-02169-3
- ↵Nelson MR, Tipney H, Painter JL, Shen J, Nicoletti P, Shen Y, Floratos A, Sham PC, Li MJ, Wang J, 2015. The support of human genetic evidence for approved drug indications. Nat Genet 47: 856–860. 10.1038/ng.3314
- ↵Norman TM, Horlbeck MA, Replogle JM, Ge AY, Xu A, Jost M, Gilbert LA, Weissman JS. 2019. Exploring genetic interaction manifolds constructed from rich single-cell phenotypes. Science 365: 786–793. 10.1126/science.aax4438
- ↵Peidli S, Green TD, Shen C, Gross T, Min J, Garda S, Yuan B, Schumacher LJ, Taylor-King JP, Marks DS, 2024. scPerturb: harmonized single-cell perturbation data. Nat Methods 21: 531–540. 10.1038/s41592-023-02144-y
- ↵Przybyla L, Gilbert LA. 2022. A new era in functional genomics screens. Nat Rev Genet 23: 89–103. 10.1038/s41576-021-00409-w
- ↵Replogle JM, Norman TM, Xu A, Hussmann JA, Chen J, Cogan JZ, Meer EJ, Terry JM, Riordan DP, Srinivas N, 2020. Combinatorial single-cell CRISPR screens by direct guide RNA capture and targeted sequencing. Nat Biotechnol 38: 954–961. 10.1038/s41587-020-0470-y
- ↵Roohani Y, Huang K, Leskovec J. 2024. Predicting transcriptional outcomes of novel multigene perturbations with GEARS. Nat Biotechnol 42: 927–935. 10.1038/s41587-023-01905-6
- ↵Sachs K, Perez O, Pe'er D, Lauffenburger DA, Nolan GP. 2005. Causal protein-signaling networks derived from multiparameter single-cell data. Science 308: 523–529. 10.1126/science.1105809
- ↵Schaffer LV, Hu M, Qian G, Moon KM, Pal A, Soni N, Latham AP, Pontano Vaites L, Tsai D, Mattson NM, 2025. Multimodal cell maps as a foundation for structural and functional genomics. Nature 642: 222–231. 10.1038/s41586-025-08878-3
- ↵Skinnider MA, Squair JW, Kathe C, Anderson MA, Gautier M, Matson KJE, Milano M, Hutson TH, Barraud Q, Phillips AA, 2021. Cell type prioritization in single-cell data. Nat Biotechnol 39: 30–34. 10.1038/s41587-020-0605-1
- ↵Song B, Liu D, Dai W, McMyn NF, Wang Q, Yang D, Krejci A, Vasilyev A, Untermoser N, Loregger A, 2025. Decoding heterogeneous single-cell perturbation responses. Nat Cell Biol 27: 493–504. 10.1038/s41556-025-01626-9
- ↵Traag VA, Waltman L, van Eck NJ. 2019. From Louvain to Leiden: guaranteeing well-connected communities. Sci Rep 9: 5233. 10.1038/s41598-019-41695-z
- ↵Tsuru S, Furusawa C. 2025. Genetic properties underlying transcriptional variability across different perturbations. Nat Commun 16: 2421. 10.1038/s41467-025-57642-8
- ↵Wang Q, Dwivedi Y. 2025. Recent developments in omics studies and artificial intelligence in depression and suicide. Transl Psychiatry 15: 275. 10.1038/s41398-025-03497-y
- ↵Yu H, Qian W, Song Y, Welch JD. 2025. Perturbnet predicts single-cell responses to unseen chemical and genetic perturbations. Mol Syst Biol 21: 960–982. 10.1038/s44320-025-00131-3
- ↵Zhang Y, Zhang T, Yang G, Pan Z, Tang M, Wen Y, He P, Wang Y, Zhou R. 2025. PerturbAtlas: a comprehensive atlas of public genetic perturbation bulk RNA-seq datasets. Nucleic Acids Res 53: D1112–D1119. 10.1093/nar/gkae851