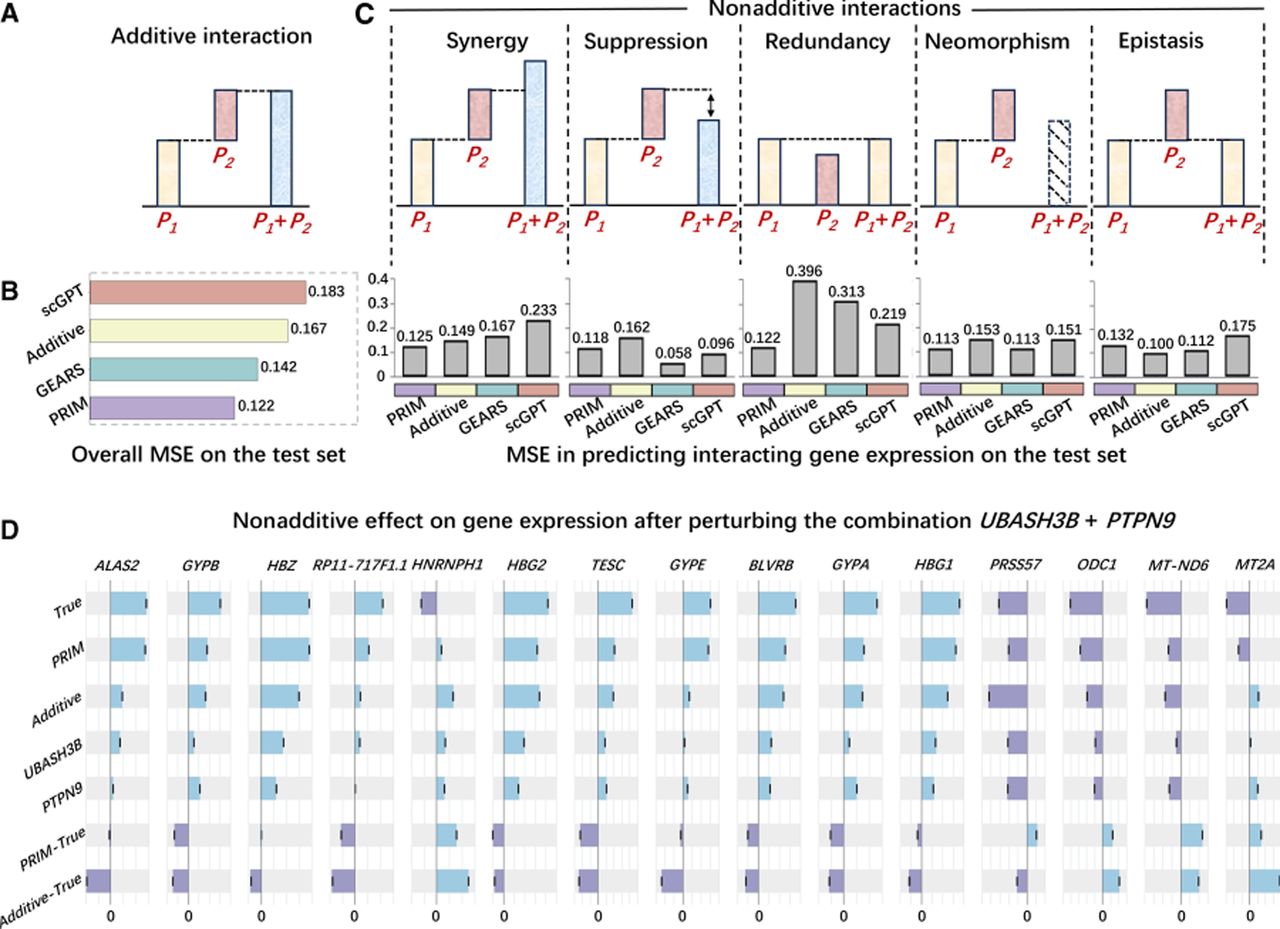
Bar chart representations of genetic interaction subtypes and model performance in genetic interaction prediction. (A) Bar chart representation of additive interactions. (B) Comparison of MSE performance of different models on the test set considering all nonadditive genetic interactions collectively. (C) Bar chart representation of nonadditive genetic interaction subtypes (synergy, suppression, redundancy, neomorphism, and epistasis), along with the MSE performance of different models in predicting each subtype individually. (D) Visualization of the nonadditive effects of the perturbation combination UBASH3B+PTPN9 on gene expression. (True) Ground-truth values, (PRIM) predictions from PRIM, and (Additive) predictions from the additive model. UBASH3B and PTPN9 indicate the effects of the corresponding single perturbations. PRIM-True and Additive-True represent the residuals between predictions and ground truth for PRIM and the additive model, respectively.