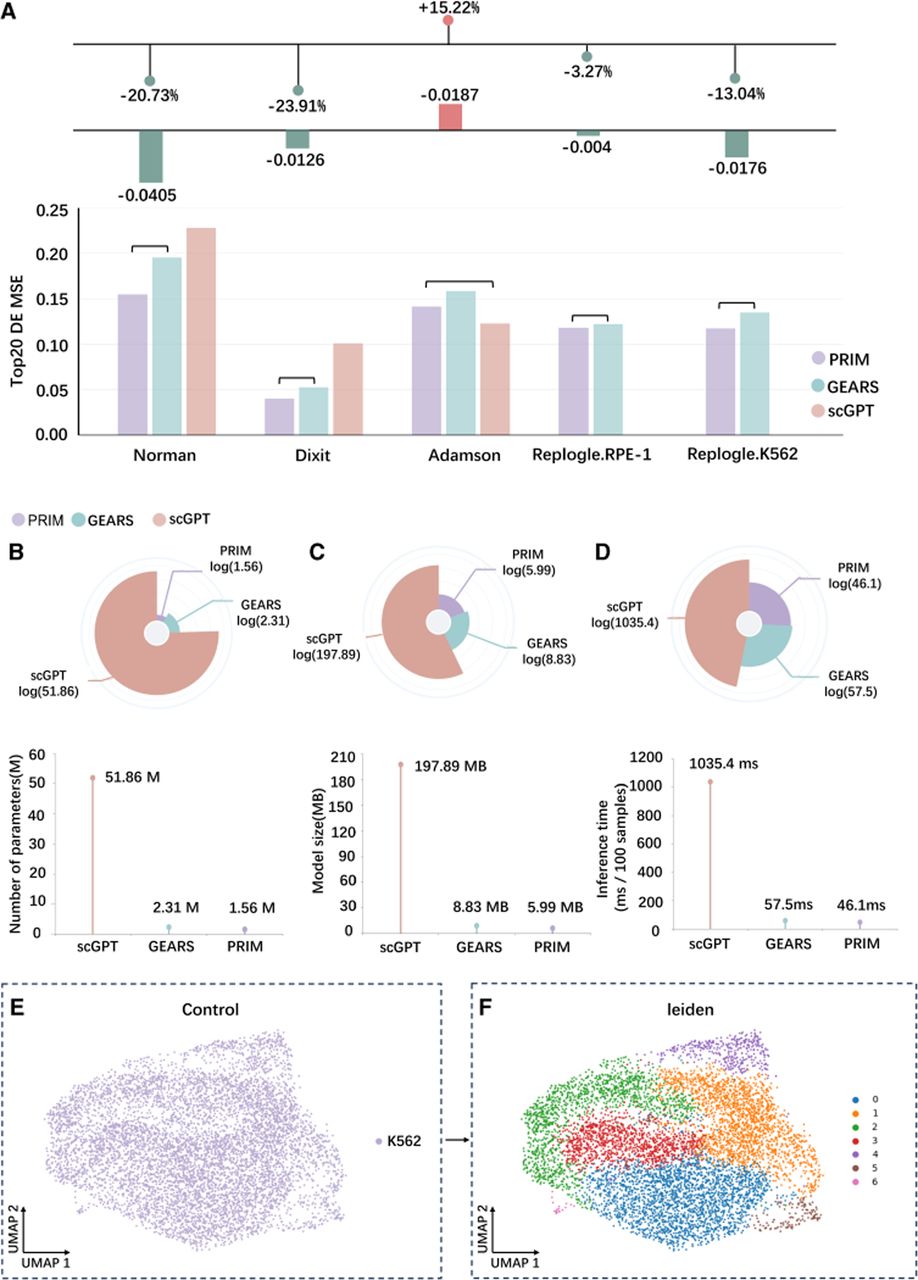
Comparison of predictive performance, model efficiency, and preliminary analysis of control cells. (A) Mean squared error (MSE) of predictions for the top 20 differentially expressed genes across five data sets: Norman et al. (2019), Dixit et al. (2016), Adamson et al. (2016), Replogle.RPE-1, and Replogle.K562 (Replogle et al. 2020). A lower MSE indicates better performance, and the same applies below. (B–D) Evaluation of model efficiency on the Norman data set. (B) Comparison of model parameter counts. (C) Comparison of model sizes. (D) Comparison of forward inference time per 100 samples. (E) Downscaled visualization of gene expression profiles of control cells from the Norman data set. (F) Clustering of control cells using the Leiden algorithm with the resolution parameter set to 0.3.