Abstract
RNA sequencing (RNA-seq) is a pivotal tool for transcriptomic analysis, providing comprehensive exploration of gene expression across diverse biological contexts. However, RNA-seq data are susceptible to various biases that can significantly compromise the accuracy and reliability of transcript quantification. This study investigates the influence of high-dimensional RNA structures on local sequencing efficiency using an innovative unsupervised variational autoencoder-Gaussian mixture model (VAE-GMM). The VAE-GMM effectively captures intricate high-dimensional k-mer structural similarities by learning compact latent representations, which reduces dimensionality while meticulously preserving essential structural features crucial for bias identification. This sophisticated modeling allows precise tracking of local RNA-read conversion dynamics and the identification of complex, often overlooked bias sources. We rigorously validate the VAE-GMM model's performance and robustness against conventional machine learning techniques, including Gaussian mixture models (GMM-only), principal component analysis-based GMMs, k-means clustering, and hierarchical clustering. These validations, using an extensive and diverse array of data sets, including synthetic RNA constructs, various human cell lines, and authentic tissue samples, consistently demonstrate the model's superior versatility and accuracy across different biological systems. Furthermore, in silico simulations of the sequencing process closely align with actual sequencing data, strongly reinforcing the critical role of high-dimensional RNA structures in determining sequencing efficiency and their impact on data quality. Our findings offer valuable insights into the underlying mechanisms of RNA structure–mediated sequencing bias. This deeper understanding enables more accurate and reliable RNA-seq analyses and is expected to improve the interpretation of transcriptomic data in future genomic studies.
RNA sequencing (RNA-seq) has become an essential tool for characterizing transcriptomes (Stark et al. 2019), enabling comprehensive profiling of gene expression, including tissue-specific patterns, disease-associated changes, and cell type–specific signatures (Glinos et al. 2022). Short-read sequencing remains the most widely used method for large-scale studies (Djebali et al. 2012) due to its ability to capture even low-abundance transcripts with high base-calling accuracy through massively parallel read generation (Picelli et al. 2014; SEQC/MAQC-III Consortium 2014; Conesa et al. 2016; Kiselev et al. 2019). However, its accuracy depends on standardized workflows that convert RNA into sequencing reads, such as the TruSeq Stranded mRNA protocol. This RNA-templated conversion step is a major source of variability and bias (Oshlack and Wakefield 2009; Hansen et al. 2010; Li et al. 2010; Trapnell et al. 2010; Garber et al. 2011; Roberts et al. 2011; Risso et al. 2014; Bray et al. 2016; Patro et al. 2017), potentially leading to transcript reconstruction and quantification errors. Accurate modeling of these biases is, therefore, critical for reliable RNA-seq analysis.
Biases often coexist and interact in complex ways (Wang et al. 2009; ‘t Hoen et al. 2013). Whereas some experimental biases from manual sample handling can be reduced by normalization, most are driven by intrinsic RNA structural features (Oshlack and Wakefield 2009; Hansen et al. 2010; Li et al. 2010; Trapnell et al. 2010; Garber et al. 2011; Roberts et al. 2011; Kivioja et al. 2012; Risso et al. 2014; Bray et al. 2016; Love et al. 2016; Patro et al. 2017; Davies et al. 2021). Examples include: GC bias, which links read abundance to GC-content; fragmentation or degradation bias, which unevenly preserves RNA regions; and library preparation bias from hexamer binding preferences. Even technical effects such as PCR cycles can be GC-dependent. Traditional bias modeling assigns weighting parameters to each factor from empirical data, but truly unbiased references are lacking, and models rarely capture the interplay between multiple biases. A deeper understanding of these mechanisms can be achieved by examining the high-dimensional structural properties of local RNA fragments (Ganser et al. 2019; Wang et al. 2021; Childs-Disney et al. 2022). These structures are central to RNA function and similarly affect RNA-to-read conversion in sequencing, where enzymes, RNA templates, and primer ligands interact. By linking local RNA structures to sequencing efficiency, it becomes possible to identify major contributors to complex biases and design more sophisticated correction strategies, ultimately improving RNA-seq accuracy and interpretability.
In this study, we investigate the complexities of RNA-seq bias mechanisms, specifically focusing on how variations in the localized multidimensional structure of RNA segments may introduce biases in sequencing output. Building upon established bias-modeling methods that account for k-mer-based GC-content (Su et al. 2024b) and minimum free energy (MFE) (Su et al. 2024a), we begin our analysis with a one-dimensional (1D) examination of sequence characteristics. This initial phase specifically explores the potential impact of k-mer GC-content on local sequencing efficiency. Subsequently, we extend our analysis to a two-dimensional (2D) framework by incorporating MFE data for k-mers, thereby aiming to elucidate the role of base-pairing interactions in the RNA-read conversion process. Recognizing the limitations of 1D and 2D models in capturing the full complexity of higher-order structural influences, we propose a novel three-dimensional (3D) approach. This 3D analysis leverages a deep-learning variational autoencoder-Gaussian mixture model (VAE-GMM) to examine the high-dimensional structural similarities of k-mers and their potential influence on sequencing efficacy. A key advantage of the VAE (Doersch 2016) model lies in its ability to capture and represent subtle structural nuances of k-mers through its latent dimensions. This capability is anticipated to surpass that of traditional methods, potentially enabling a more precise categorization based on high-dimensional properties. Such a refined categorization could significantly improve our understanding of how k-mer structure influences sequencing efficiency, aligning with previous research suggesting that homogeneous tertiary structures may promote more uniform biological functions (Le and Maizel 1997; Cheng et al. 2001). The VAE-GMM k-mer clustering model, by combining deep neural networks with probabilistic clustering and dimensionality reduction techniques, offers a promising framework for decoding high-dimensional RNA sequence structures and uncovering latent sequence features relevant to sequencing biases.
Results
Architecture and training pipeline of a VAE-GMM k-mer clustering model for tracking local sequence conversion dynamics
The VAE-GMM k-mer clustering model is designed to uncover the underlying structural patterns that impact sequencing efficiency, providing insights into the RNA-read conversion process and enhancing the interpretability of RNA-seq data. A key challenge in analyzing k-mer sequences is their high-dimensional and discrete nature. To address this and learn a compact, continuous, and meaningful representation suitable for downstream clustering and analysis, we employ a variational autoencoder (VAE). The VAE framework is particularly well-suited for this task because it not only performs dimensionality reduction but also learns a probabilistic latent space that captures the underlying data generating distribution. This probabilistic approach encourages a smooth and structured latent space where similar k-mers are mapped to nearby points, which is highly beneficial for identifying clusters related to sequence conversion dynamics. In our VAE-GMM approach (Fig. 1), k-mer RNA sequences are first encoded into one-hot vectors, capturing the categorical nature of nucleotide sequences. These vectors are then processed through an encoder network composed of three layers of one-dimensional convolutional neural networks (CNNs) with kernel sizes of three and progressively decreasing filter sizes of 64, 32, and 16. The deep CNN architecture is chosen for its proven efficacy in extracting local sequence motifs and hierarchical patterns from sequence data, which are hypothesized to be relevant features for modeling local RNA sequence conversion dynamics. The output of the CNN layers is flattened and passed to a fully connected dense layer, which computes the parameters of the latent space: a mean vector (µ) and a standard deviation vector (σ). To enable stochastic sampling in the latent space and promote a smooth encoding of the data distribution, we employ the reparameterization trick inherent in VAEs. Specifically, a noise vector ε, composed of independent standard normal variables (), is sampled such that each εk is independent (e.g., ε = [ε1, ε2] with ε1 ⫫ ε2). The latent variable z is computed using the reparameterization trick: z = µ + σ ⊙ ε, where ⊙ denotes element-wise multiplication, and . Each z resides in an ℝ^(N × latent_dim) dimensional space, with N representing the batch size and latent_dim the dimensionality of the latent space. This reparameterization allows for gradient-based optimization while ensuring that the learned latent space is continuous and generative, meaning variations in z correspond to meaningful variations in the k-mer features. The latent vector z is then passed through the decoder, which consists of a fully connected dense layer followed by three one-dimensional CNN layers, mirroring the encoder architecture, reconstructing the input sequences from the latent representations. By optimizing a loss function that combines reconstruction loss and the Kullback-Leibler (KL) divergence, the VAE learns meaningful and continuous latent representations of k-mer sequences. The KL divergence term regularizes the latent space, encouraging the learned distribution to approximate a prior distribution (typically standard normal). This regularization is crucial; it prevents overfitting, promotes disentanglement of features, and facilitates the clustering of similar sequences in the latent space by ensuring a well-structured manifold. After training the VAE, we encode all available k-mers, including those not used in training, to obtain their latent representations. These representations capture the essential features of the sequences that are most relevant to sequencing efficiency. We then apply a Gaussian mixture model (GMM) to cluster the latent vectors in an unsupervised manner. The GMM assumes that the data is generated from a mixture of several Gaussian distributions, allowing it to model complex, multimodal data distributions inherent in biological sequences that are effectively captured by the VAE's learned latent space. To assess the quality of the clustering, we compute the silhouette score, which measures how similar an object is to its own cluster compared to other clusters. A high silhouette score indicates well-separated and cohesive clusters, suggesting that the latent space meaningfully captures the structural differences among k-mers.
Architecture and training pipeline of the VAE-GMM k-mer clustering model for examining high-dimensional structures unveiling bias mechanisms in RNA-seq. The k-mer RNA sequences are one-hot encoded and processed through an encoder consisting of three one-dimensional CNN layers and a dense layer that outputs mean (µ) and standard deviation (σ) vectors for the VAE's latent space. Latent variables z are sampled using the reparameterization trick z = µ + σ ⊙ ε, where . The decoder mirrors the encoder architecture. The VAE is trained by optimizing a loss function that combines reconstruction loss and Kullback-Leibler divergence. After training, all k-mers are encoded to obtain their latent representations z, which are clustered using a Gaussian mixture model (GMM). Cluster quality is assessed using the silhouette score. For visualization, UMAP projects the latent representations onto a two-dimensional space, where each k-mer is plotted and colored by its GMM cluster label. Each k-mer is associated with a theoretical modeling count and an empirical sequencing count; these counts are aggregated based on cluster labels. The correlation between these aggregates evaluates how high-dimensional structural features determine sequencing biases in RNA-seq.
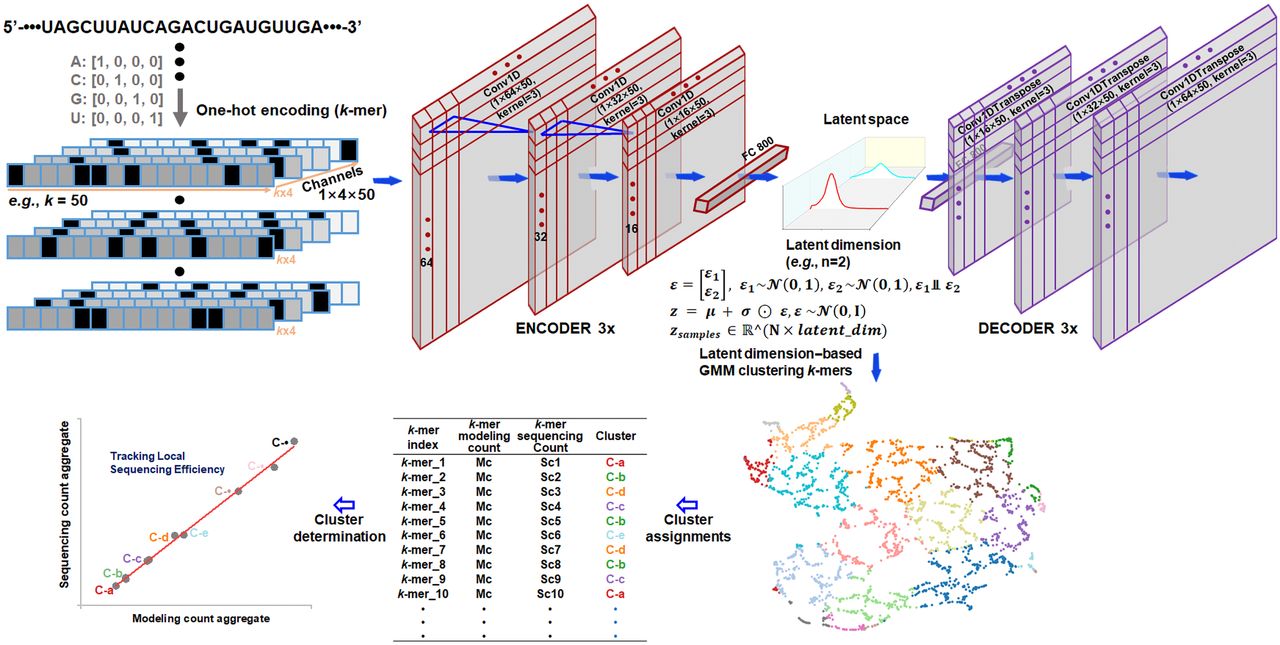
For visualization purposes, we employ Uniform Manifold Approximation and Projection (UMAP) to project the high-dimensional latent representations onto a two-dimensional space. UMAP preserves the topological structure of the data, providing an interpretable visualization of the clustering results. In the resulting scatterplot, each point represents a k-mer colored according to its assigned GMM cluster label, enabling intuitive exploration of the sequence space. To link the clustering results to local sequencing efficiency, we leverage modeling counts (theoretically predefined under certain conditions as benchmarks) and sequencing counts (empirically measured data) associated with each k-mer. By aggregating these counts based on the VAE-GMM cluster labels, we compute cluster-assigned modeling and sequencing count aggregates. Analyzing the correlation between these aggregates allows us to evaluate how high-dimensional structural features captured by the clusters influence local sequencing efficiency.
Structure-determined sequencing biases in synthetic RNA libraries
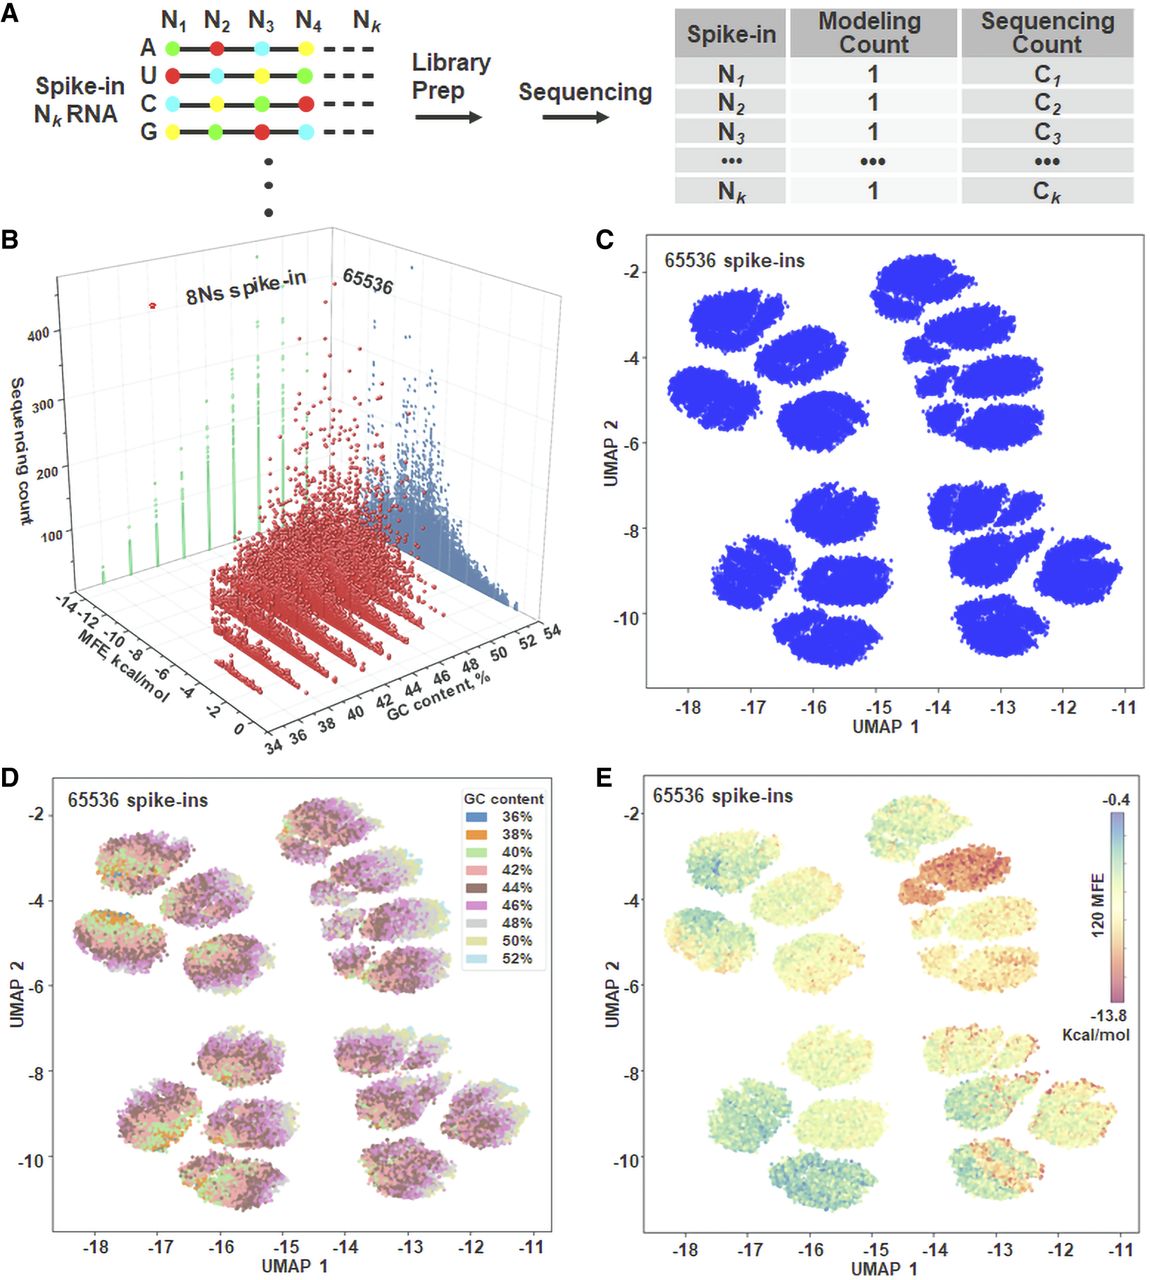
The structural complexity of an RNA transcript can be assessed at three hierarchical levels—primary, secondary, and tertiary. As a proof-of-principle, we used a diverse set of spike-in synthetic RNAs, each representing a single k-mer and serving as an independent sequencing unit (Fig. 2A). These spike-ins were processed with the hexamer-based VAHTS Universal V8 RNA-seq library protocol, sequenced, and grouped by structural features. At the primary structure level, the linear nucleotide arrangement underlies all higher-order structures. To vary sequence composition, we generated spike-ins by randomly permuting G/C bases at each position for a given length, creating a broad GC-content range and allowing classification via a GC-content index. At the secondary structure level, base-pairing interactions form stems, loops, and bulges. To capture differences in thermodynamic stability, spike-ins were grouped by predicted minimal free energy (Supplemental Fig. S1). GC-content was calculated directly from sequences, whereas MFE was predicted bioinformatically. Gaussian distributions of GC-content and MFE were used for categorization (Methods; Supplemental Figs. S2, S3). Our model assumes all spike-ins have equal abundance (relative modeling count = 1). When aggregated by GC-content or MFE, these modeling counts form Gaussian distributions. We compared these model Gaussians to similarly aggregated sequencing counts; systematic deviations indicate structural biases affecting spike-in representation during library preparation or sequencing. At the tertiary structure level—stabilized by base stacking, hydrogen bonding, and metal ion coordination—3D conformational similarity guided spike-in clustering. We applied a VAE-GMM clustering approach (Fig. 1; Methods; Supplemental Fig. S4) and used linear regression to compare aggregated modeling and sequencing counts.
Multidimensional RNA structural features from primary to tertiary levels associated with sequencing biases. (A) Spike-in synthetic RNAs were processed using the hexamer-based standard VAHTS Universal V8 RNA-seq library preparation protocol. Sequencing counts for each spike-in were obtained and subsequently used for downstream grouping. (B) Three-dimensional plot depicting the aggregated sequencing counts for each category across the 65,536 unique spike-in RNAs. Each RNA template is categorized by its GC-content and MFE, with data organized and centralized based on these two parameters. (C) UMAP performed on one-hot encoded spike-in sequences reveals 16 major clusters among the 65,536 spike-ins. (D,E) Visualization of all spike-in RNAs, color-coded by GC-content cluster and by MFE cluster. The nine GC-content categories and 120 MFE levels reflect the full breadth of the 65,536 spike-in sequences.
For validation, we designed synthetic spike-ins of equal length but varying GC-content, MFE, and tertiary structure. Although an RNA of length k can form 4k sequences (Supplemental Fig. S1A), we constrained the design to eight variable sites within a 50-nt core, flanked by 8-nt poly(A) tails at each end. This yielded 48 spike-in variants at equal molarity (Supplemental Fig. S1B), minimizing experimental complexity and ligation bias. In contrast, fully modeling GC-content for 50-mers would require 450 permutations, which is impractical. By systematically analyzing GC-content, MFE, and 3D features, we reveal how specific RNA structural properties shape spike-in representation in RNA-seq data.
In the handling of spike-in raw data, utilizing entire spike-in sequences is crucial for accurately determining the read counts of individual RNA sequences. To ascertain the consistency and intricacy of the sequencing biases, we conducted two biological replicate spike-in RNA-seq experiments. Both experiments demonstrated a high degree of consistency, with strong correlations between the replicates (Supplemental Fig. S1C). This consistency underlines the profound influence that the intrinsic structural properties of each spike-in template have on sequencing effectiveness, a critical factor for accurate data set comparisons. Each spike-in sequence is meticulously examined in the specific order of nucleotides A, T, C, and G at eight positions (Supplemental Fig. S1D). A key observation from this analysis is the high variability in spike-in sequencing counts, diverging from the uniform distributions typically expected in theoretical modeling count, highlighting inherent biases in RNA-seq. In the experimental setup, the pool of spike-in RNAs used as a sequencing substrate ensures that each spike-in type is present at equimolar concentrations. This arrangement mirrors the expectations set by theoretical modeling, assuming a uniform distribution across all spike-in types. Further investigations divided the spike-in sequencing data based on structural features, categorizing them into nine distinct groups by GC-content and further into 120 specific categories by MFE (Fig. 2B). This strategic organization facilitates more focused scrutiny of the data. Although initial interpretations of spike-in sequencing counts show considerable variability, organizing the spike-in counts by their GC-content or MFE leads to a more consistent distribution. Furthermore, a roughly linear relationship between GC-content and MFE is observed (Supplemental Fig. S5). This trend aligns with expectations and highlights a fundamental connection between 1D sequence properties and 2D structural characteristics.
In addition to categorizing the spike-ins by GC-content and MFE, we performed a detailed analysis of their tertiary structures using an unsupervised VAE-GMM clustering algorithm. This method focuses on direct nucleotide sequence clustering, which provides a distinct advantage over techniques that rely on predicted parameters (e.g., torsional angles). Such parameters often prove unreliable in defining RNA structures, largely because of the complex nature of molecular folding, the broad range of computational algorithms available, and the variability of energy landscapes (Cao and Chen 2006; Smith et al. 2017; Li et al. 2022). Indeed, a single RNA segment can fold into multiple tertiary structures, each exhibiting unique parameters. By concentrating on the direct nucleotide sequences (represented as a one-hot encoded matrix), we achieved more robust clustering performance compared to analyses relying solely on predicted torsional parameters. Application of UMAP for dimensionality reduction to these one-hot encoded spike-in sequences revealed approximately 16 major clusters (Fig. 2C), each with well-defined outlines. This distinct clustering pattern is directly attributable to the inherent design of the spike-ins: each 50-nt spike-in sequence is fixed except for eight specific positions where bases (A, U, C, or G) were incorporated randomly during synthesis. Therefore, the unique combinations of nucleotides at these eight variable positions are the fundamental determinants of the sequence identities that UMAP differentiates into the observed clusters. Further inspection involved color-coding the spike-ins by GC-content (Fig. 2D) and by MFE (Fig. 2E). Whereas it appears that some UMAP subclusters are occupied predominantly by either high- or low-GC spike-ins, clear boundaries for either GC-content or MFE are not observed, indicating overlap within the embedding. This dispersion underscores the complexity of the underlying mechanisms governing the UMAP-generated space.
Decoding structure-determined sequencing biases at three levels
To model 1D and 2D structural biases, we first categorized equal-molar spike-ins by GC-content. We modeled their ideal counts with a Gaussian distribution to derive mean and standard deviation parameters (Fig. 3A, left). We then applied this parameterized model to the aggregated sequencing counts (Supplemental Fig. S6); discrepancies between the predicted and observed data revealed GC-content-related biases (Fig. 3A, right). We repeated this process for MFE, which offers a more granular categorization, with over 100 groups compared to just nine for GC-content (Fig. 3B; Supplemental Fig. S7). Again, variations between the model and sequencing data indicated biases linked to secondary structure. To visualize deviations not captured by these individual models, probability-probability (P-P) plots were generated, comparing observed counts against theoretical counts for both GC-content and MFE bins (Supplemental Fig. S8).
RNA structure–driven sequencing biases from primary to tertiary level. (A) Gaussian modeling of spike-in RNAs by GC-content. A total of 65,536 spike-in RNAs were categorized based on their GC-content to establish calibration benchmarks assuming a uniform distribution. Sequencing data are organized by GC-content and aligned using parameters derived from the Gaussian model. Arrows indicate discrepancies between the model's predicted counts and the actual sequencing data at various GC-content levels. (B) Gaussian modeling of spike-in RNAs by MFE. The same set of spike-in RNAs was categorized by MFE values (binned to one decimal place) to set up calibration benchmarks under a uniform distribution assumption. Sequencing data are organized by MFE and adjusted to align with the Gaussian model's parameters. Arrows highlight variances between the predicted counts and the actual sequencing data at different MFE levels. (C) UMAP visualization of VAE-GMM clustering at multiple resolutions. UMAP plots display the clustering results of the spike-in RNAs using a VAE-GMM at three levels of granularity: 10, 200, and 1000 clusters. Each plot shows the distribution of spike-ins across the identified clusters. Clustering performance at each level is quantified using the silhouette score, indicating the degree of cluster separation. (D,E) AlphaFold-predicted 3D structures from distinct VAE-GMM clusters. Three-dimensional structures predicted by AlphaFold are presented for selected spike-in RNAs from two distinct clusters highlighted in panel C at the 1000-cluster level. For each spike-in, the RNA index, cluster ID, nucleotide sequence, and sequencing count (sc) are provided. These structures illustrate the diversity of RNA folding within different clusters. Mol* is used for 3D structure visualization (Sehnal et al. 2021). (F) Aggregated modeling and sequencing counts across VAE-GMM clusters. The modeling predictions and actual sequencing counts are aggregated across VAE-GMM clusters at multiple scales (10, 200, 1000 clusters). This comparison illustrates how complex RNA structural features influence local sequencing efficiency, as reflected in discrepancies between predicted and observed counts. (G) UMAP visualization of GMM clustering on one-hot encoded sequences. Spike-in RNAs are clustered using GMM based on one-hot encoded nucleotide sequences into ten clusters. The UMAP plot visualizes the distribution of RNAs across these clusters, with silhouette scores assessing the quality of cluster separation. (H) GMM clustering with PCA reduction to two components. The spike-in RNAs are clustered using GMM after reducing the data to two principal components via PCA, presetting the number of clusters to 10. The resulting UMAP plot shows the spatial arrangement of clusters in reduced dimensions. (I) GMM clustering with PCA reduction to 25 components. Similar to panel H, but PCA reduces the data to 25 principal components before GMM clustering into 10 clusters. Silhouette scores are presented to evaluate cluster separation. In all UMAP visualizations, clusters are color-coded to represent different groups.
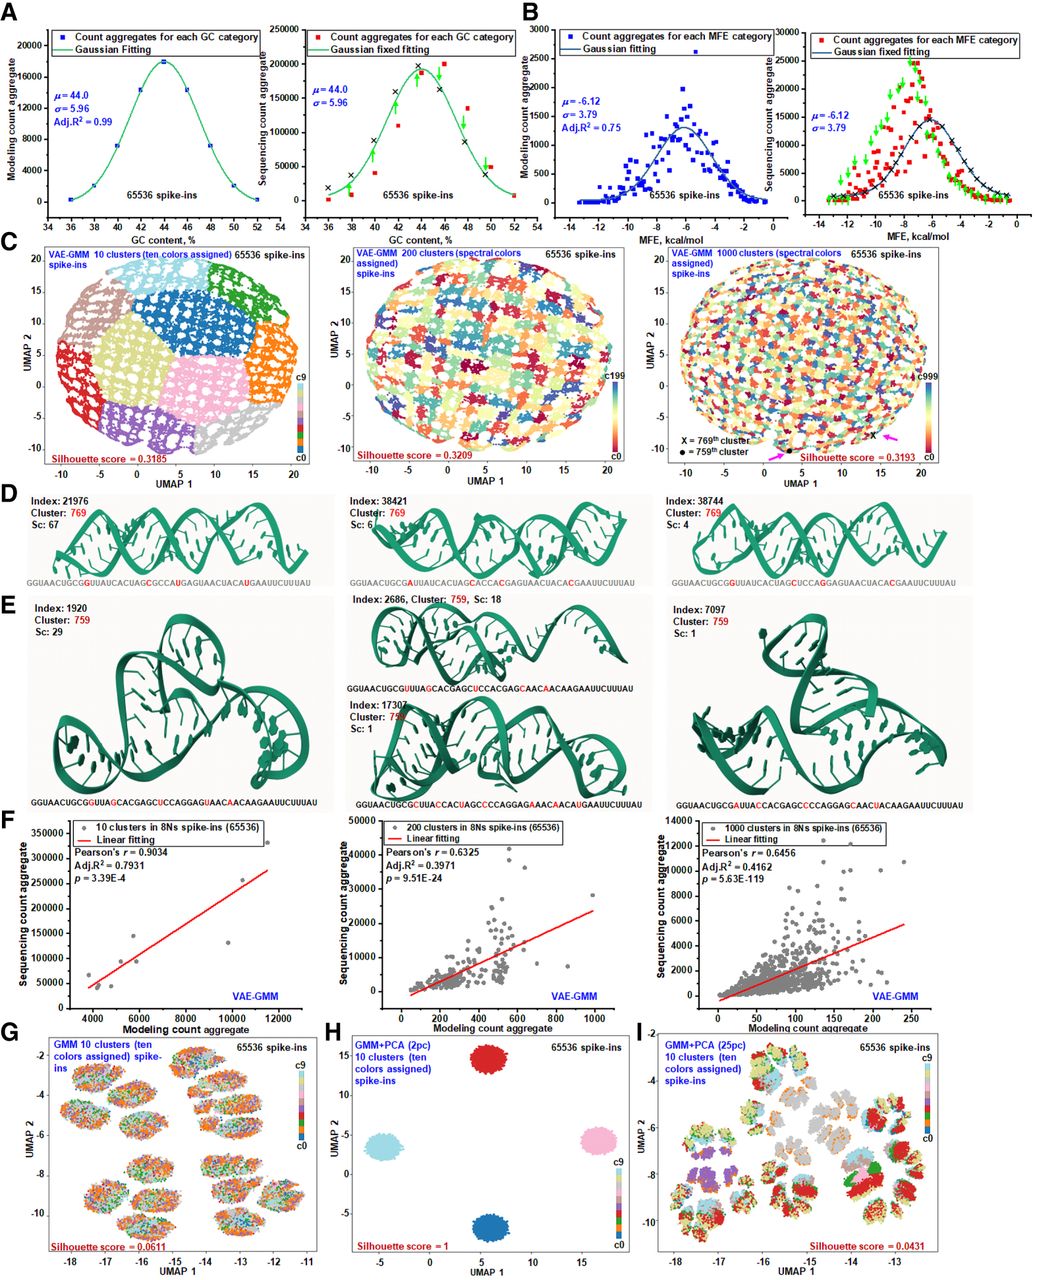
To investigate high-dimensional structural influences, we employed a VAE-GMM clustering algorithm (Fig. 1) to categorize spike-ins into 10, 200, and 1000 clusters. UMAP visualizations revealed compact, well-separated groups, with silhouette scores exceeding 0.3 even at the 1000-cluster scale (Fig. 3C). To validate clustering accuracy, we used AlphaFold to predict the 3D structures of spike-ins from distinct clusters, confirming that intracluster structures were broadly similar, whereas intercluster structures differed (Fig. 3D,E). However, due to its limitations for RNA, AlphaFold served only as a visual aid; our clustering relies on intrinsic sequence features, not direct integration of predictive models. For quantitative analysis, we performed linear regression on the aggregated modeling counts (number of spike-ins per cluster) versus the aggregated sequencing counts (total reads per cluster) for all three clustering levels (Fig. 3F). Across all scales, we observed a strong linear correlation, indicating that high-dimensional structural information significantly determines local sequencing efficiency.
In contrast, traditional clustering methods were less effective. A Gaussian mixture model yielded near-zero silhouette scores and indistinct cluster boundaries, indicating poor separation (Fig. 3G; Lovmar et al. 2005). GMM combined with PCA (GMM-PCA) also struggled. Using only two principal components failed to partition the data into the target 10 clusters (Fig. 3H), and increasing to 25 components resulted in poorly defined, overlapping clusters (Fig. 3I). These challenges arise because the limited structural diversity of N8 spike-ins requires capturing subtle distinctions. VAE-GMM succeeds by leveraging high-dimensional structural information, providing more refined cluster assignments than GMM-only or GMM-PCA, which are less capable of capturing the intricate features of RNA segments necessary for effective clustering.
RNA structure–determined sequencing biases in natural transcript sequencing
Our study extends the multidimensional structure deciphering model beyond traditional spike-in RNAs by analyzing k-mers from natural transcripts (Fig. 4A). In this framework, each k-mer acts as a pseudo-spike-in, capturing variations in GC-content, MFE, and tertiary structure. Our 1D and 2D models categorize transcript-specific k-mers by GC-content and MFE, whereas our 3D model uses VAE-GMM to cluster k-mers by tertiary structure, positing that structurally similar k-mers have similar local sequencing efficiencies. This approach methodically clusters, aggregates, and normalizes k-mer counts against transcript-specific features. To demonstrate this, we clustered each 50-mer from the GAPDH transcript by its GC-content, MFE, and tertiary structure, correlating these with model predictions and empirical sequencing counts (Fig. 4B). Unlike equal-molar spike-ins, natural k-mer counts are influenced by their global overlapping frequency across all isoforms. To isolate the effects of RNA structure, we normalize for this by aligning each k-mer against all isoform sets to calculate its global appearance frequency (Fig. 4C). This ensures that remaining variations in sequencing counts can be attributed to multidimensional RNA structures.
RNA structure–driven sequencing biases in RNA-seq of natural transcripts. (A) Natural transcript k-mers are analyzed based on their GC-content (1D), MFE (2D), and tertiary structure (3D). K-mer counts are aggregated into Gaussian distributions for GC-content and MFE categories, whereas tertiary structures are clustered using VAE-GMM for subsequent regression analysis of sequencing counts. (B) A stacking plot illustrates the distribution of 50-mer sequencing counts across the GAPDH transcript (ENST00000229239). Additional layers represent the GC-content, MFE, and the global overlapping frequency of each 50-mer. (C) The transcript is segmented into distinct k-mer sets per isoform. K-mers from each isoform are globally matched against those from other isoforms to generate an overlapping profile, highlighting the contribution of isoform-specific k-mers to individual sequencing counts. These frequencies serve as theoretical k-mer counts for modeling. (D) Aggregated global-frequency counts of GAPDH 50-mers are modeled using Gaussian distributions across various GC-content categories. Transcript-specific parameters (means and standard deviations) are determined. Actual sequencing data, categorized by GC-content, are aligned with these Gaussian models using predefined parameters. Calibration adjustments for each category are indicated by directional arrows. (E) Aggregated 50-mer counts, categorized by MFE, are compared to theoretical Gaussian distributions derived from global k-mer overlapping frequencies. Actual sequencing counts are matched to the corresponding Gaussian models across different MFE categories. (F) UMAP plot of GAPDH 50-mers clustered into 200 clusters using VAE-GMM. Clusters are color-coded, and specific clusters with notable 50-mer indices are highlighted for visualization. Modeling predictions and actual counts are aggregated for regression analysis. (G) UMAP plot showing clustering using a GMM-only approach, yielding 200 clusters. Cluster 26, containing 1050-mers, is highlighted. Predictions and actual counts are aggregated for regression analysis. (H) UMAP plot displaying clustering using GMM after PCA reduction to 25 principal components, resulting in 200 clusters. Cluster 197 containing four 50-mers is highlighted for visualization. (I) UMAP plot displaying clustering using GMM after PCA reduction to two principal components, resulting in 200 clusters. Cluster 112 containing seven 50-mers is highlighted for visualization. (J) AlphaFold-predicted 3D structures from VAE-GMM clusters are presented. Clusters 26 (index 467), 32 (index 474), and 53 (index 478) each contain a single 50-mer. Clusters 45 (indices 501 and 504) and 197 (indices 520 and 931) contain two 50-mers each. These clusters are highlighted in panel F to emphasize unique structural characteristics. (K) AlphaFold-predicted structural diversity in GMM Cluster 26. Cluster 26 from the GMM-only approach contains 10 GAPDH 50-mers (G), including index 467 from panel J. The structural diversity within this cluster is showcased by 50-mers with indices 215, 257, 812, and 845. (L) AlphaFold-predicted structural diversity in GMM-PCA (25pc) cluster 197. Cluster 197 from the GMM-PCA approach includes four GAPDH 50-mers (H), featuring index 467 from panel J. Structural diversity is illustrated with 50-mers of indices 470 and 890.
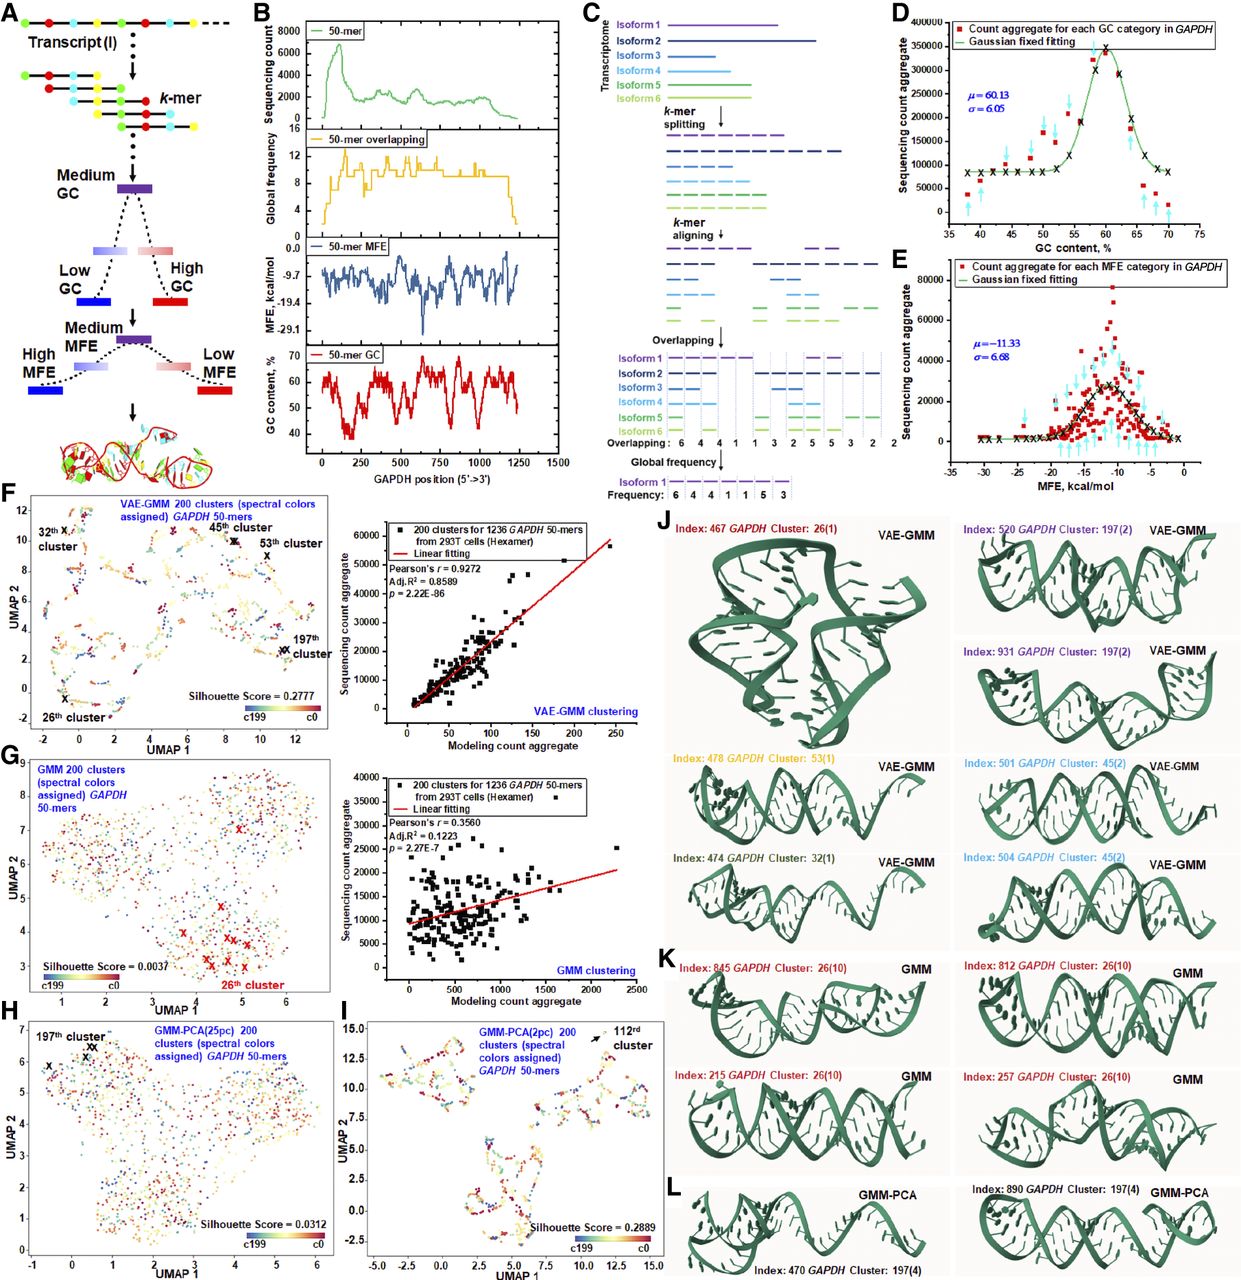
Our analysis identified 17 GC-content categories among the GAPDH 50-mers (Fig. 4D). We modeled count aggregates for each category with Gaussian distributions based on the 50-mers’ global overlapping frequencies. Similarly, we categorized counts by the 176 observed MFE values and modeled them with Gaussian distributions (Fig. 4E). In both the 1D (GC-content) and 2D (MFE) models, we observed significant divergence between the model-predicted counts and the actual sequencing counts. For the 3D analysis, we first clustered the 1236 GAPDH 50-mers into 10 groups using VAE-GMM, which produced well-defined clusters (Supplemental Fig. S9) but still showed discrepancies between predicted and observed counts. In comparison, GMM-only clustering produced less distinct groups (Supplemental Fig. S10). To rigorously compare methods at a higher resolution, we established a consistent framework: all algorithms (VAE-GMM, GMM-only, PCA-based GMM, k-means, and hierarchical clustering) were applied to the same 1236 50-mer one-hot encoded sequences, with a target of 200 clusters.
The VAE-GMM algorithm (two latent dimensions) generated 200 well-separated clusters, showing a strong linear regression between modeled and observed count aggregates (Fig. 4F). In contrast, a GMM-only approach resulted in larger intracluster distances and weaker regression performance (Fig. 4G). We then substituted the VAE with PCA. Using 25 principal components, GMM-PCA clustering performed poorly (Fig. 4H). Reducing to two PCA components improved performance (Fig. 4I; Supplemental Fig. S11) but showed signs of overfitting, with distinct clusters overlapping. Other algorithms using the same two-component PCA data, such as k-means-PCA and hierarchical-PCA, produced similar or uncorrelated results, respectively (Supplemental Figs. S11–S13). Increasing the PCA components back to 25 consistently resulted in poor clustering across all PCA-based methods (Supplemental Fig. S14). To confirm VAE-GMM's general applicability, we analyzed ACTB, SDHA, and TUBA1B transcripts, consistently finding clear clusters and strong linear correlations, reinforcing its robustness for modeling sequencing bias (Supplemental Fig. S15).
A detailed analysis of the VAE-GMM clusters identified benchmark groups, such as singleton clusters (26, 32, 53) and doublets (45, 197) (Fig. 4F, left). We used AlphaFold to predict the 3D structures of their constituent 50-mers (Fig. 4J). The singletons, particularly index 467 in cluster 26, showed unique 3D structures, whereas the 50-mers within the doublet clusters were structurally similar. The 50-mer index 467 was inconsistently clustered by other methods. GMM-only placed it in a 10-member cluster with diverse structures (Fig. 4K; Supplemental Fig. S16). GMM-PCA (25 components) put it in a four-member cluster with poor structural similarity (Fig. 4L). With two PCA components, GMM-PCA assigned it to a seven-member cluster where all k-mers collapsed to a single point in the UMAP visualization, a clear sign of overfitting (Fig. 4I). These findings show that AlphaFold-predicted structures can help validate clustering quality. However, direct integration of AlphaFold predictions into clustering is challenging due to the inherent sequence uncertainty of short 50-mers, as reflected by their Shannon entropy (Supplemental Fig. S17), necessitating careful interpretation.
Deciphering the three-level structural resolution of local sequencing efficiency
Transcript segments with high GC content or low MFE are often assumed to have reduced sequencing depth because such features can promote stable secondary structures that impede primer annealing (Hansen et al. 2010; Aird et al. 2011). Paradoxically, these same features can also increase the binding affinity of hexamer primers, potentially enhancing sequencing efficiency in certain transcript regions. This dual influence suggests a counterbalancing mechanism in which the structural constraints that hinder sequencing are partially offset by improved primer binding (Fig. 5A). To explore this balance, we analyzed 50-mer counts from the USF2 transcript using both global-frequency modeling and empirical sequencing, categorizing the data by GC content. Gaussian fits to these categories (Fig. 5B) and probability-probability plots (Fig. 5C), together with Kolmogorov–Smirnov (K-S) testing (P = 0.7522, Z = 0.6793), revealed no significant differences between modeled and sequenced distributions. This indicates that high-GC regions are not preferentially sequenced across diverse USF2 transcript segments and that structural complexity, rather than GC content alone, is the dominant driver of observed sequencing biases. Extending the analysis to additional transcripts (TUBA1B, ACTB, SDHA, and TRPM5) (Supplemental Fig. S18) confirmed that mean and standard deviation values of GC-based categories match closely between modeled and empirical data (Supplemental Fig. S19). Nonetheless, free-fitting models still showed residual discrepancies, implying that additional features contribute to sequencing bias.
Investigating the impact of RNA structure on local sequencing efficiency at multiple levels. (A) Sequencing efficiency is modulated by RNA structure: low GC-content or high MFE results in weak structural stability and low primer binding affinity. In contrast, high GC-content or low MFE indicates strong structural stability, which inhibits efficient primer loading. (B) Aggregated counts of GC-categorized 50-mers from USF2 (ENST00000222305) were analyzed using global k-mer-overlapping frequency models and empirical sequencing data. Gaussian distributions were applied using a free-fitting method for global frequency-based modeling data to determine key Gaussian parameters and a parameter-fixed fitting method for empirical sequencing data. This analysis highlights discrepancies in 50-mer counts between theoretical predictions and sequencing data within each GC category. (C) P-P plot illustrating the comparison between sequencing count aggregate and modeled count aggregate from panel B. A Kolmogorov–Smirnov test indicates a P-value of 0.7522 (Z = 0.6793) for normalized 50-mer counts, with a linear regression line fitted to the data points. (D) Aggregated counts of MFE-categorized 50-mers were analyzed similarly to panel B using global frequency models and empirical sequencing data. Gaussian distributions were fitted using a free-fitting method to determine Gaussian parameters and a parameter-fixed fitting method to reveal 50-mer count differences between theoretical predictions and actual sequencing data within each MFE category. (E) The P-P plot compares aggregated sequencing counts to modeled counts from panel D. A Kolmogorov–Smirnov test shows a P-value of 0.6087 (Z = 0.7287) for normalized 50-mer counts. A linear regression line fitted to the data points demonstrates consistency between the sequencing data and the MFE-based model. (F) UMAP plots display the clustering results of 1697 USF2 50-mers using VAE-GMM at three levels of granularity: 10, 50, and 100 clusters. Each plot illustrates the distribution of 50-mers across the identified clusters, highlighting the structural diversity within the data set. (G) Modeling predictions and actual sequencing counts were aggregated across VAE-GMM clusters at multiple scales (10, 50, 100, 200, 500, and 1000 clusters). Linear regression analyses were performed for both modeling and sequencing data sets to assess discrepancies between predicted and observed counts, evaluating the accuracy of the clustering models.
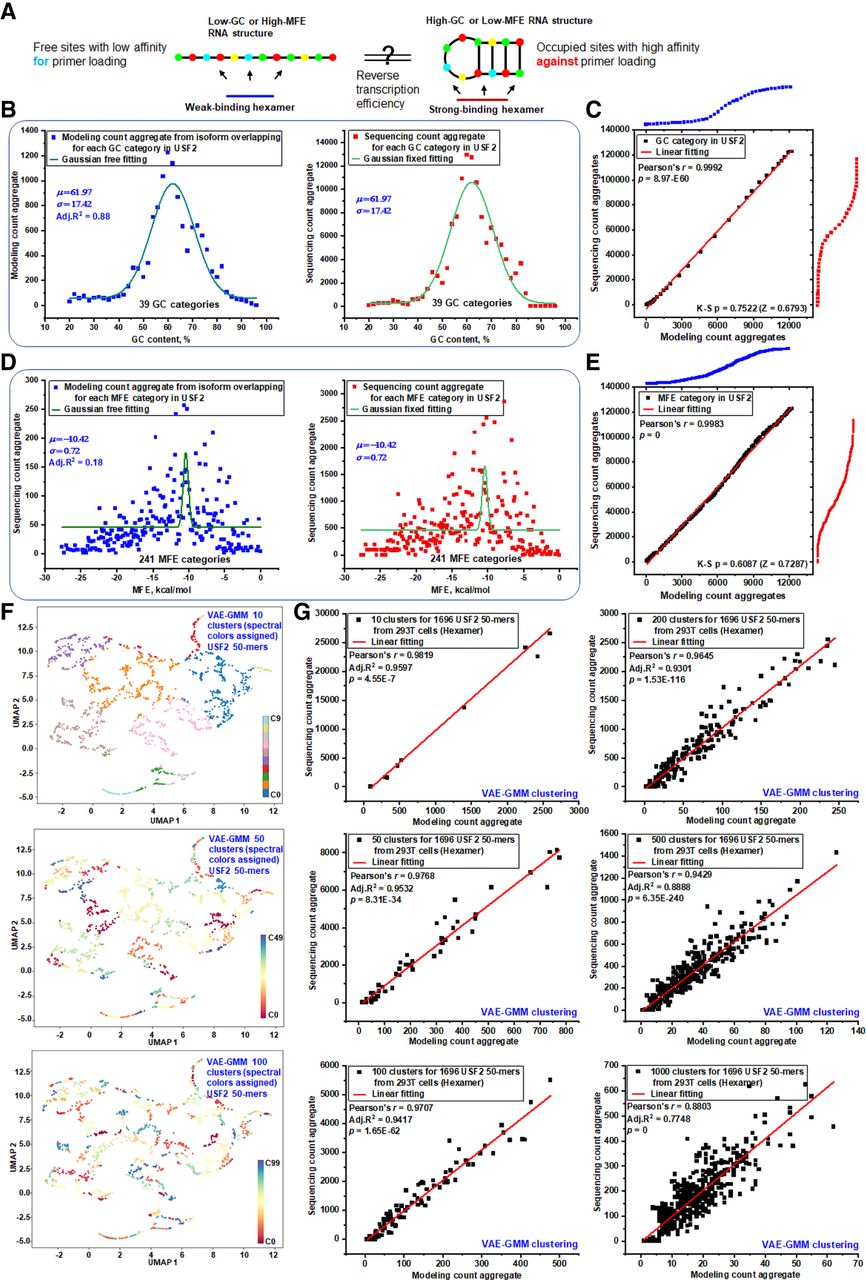
We next examined two-dimensional structural features using MFE. The 1696 USF2 50-mers were split into 39 GC-content groups and 241 MFE categories (Fig. 5D). This revealed a nonlinear relationship in which k-mers of identical GC content span a wide MFE range, and vice versa (Supplemental Fig. S20). MFE-based P-P plots (Fig. 5E) again showed no significant differences between modeled and empirical distributions, underscoring that neither GC nor MFE alone captures the finer structural determinants of sequencing efficiency. Across both 1D and 2D analyses, the global overlapping frequency-based modeling effectively reproduced the empirical distributions, supporting the conclusion that high GC content or low MFE segments are naturally distributed rather than selectively sequenced. To resolve finer structural influences, we applied VAE-GMM clustering to the USF2 50-mers, capturing high-dimensional structural features. This unsupervised approach grouped the 1697 50-mers into clusters visualized by UMAP at multiple resolutions (10, 50, and 100 clusters) (Fig. 5F; Supplemental Fig. S21). Linear regression between modeled and empirical counts for 10-cluster groupings showed a strong correlation (Fig. 5G). The residuals from this regression pinpoint the sequencing biases driven by distinct structural properties. Specifically, a cluster located above the regression line signifies overrepresentation in the empirical data, indicating that its unique structural features led to more efficient library preparation or sequencing. Increasing to 1000 clusters assigned most 50-mers to unique groups, enabling bias assessment at near-single 50-mer resolution while retaining robust regression fits. Although silhouette scores declined at higher resolutions, adjusted R2 values remained consistently high across a wide range of cluster numbers (5 to 1500) (Supplemental Fig. S22B), indicating stable modeling performance. Beyond resolution, the latent space dimensionality of the VAE critically affected clustering quality. Evaluations with 2, 3, 4, 8, and 16 latent dimensions showed that cluster distinctness diminished at higher dimensions, as confirmed by both UMAP projections and spike-in control analyses (Supplemental Fig. S23). A latent dimension of two yielded optimal clustering quality and was therefore used for all subsequent analyses.
In summary, whereas GC- and MFE-based categorizations provide meaningful but coarse-grained views of sequencing efficiency, their statistical equivalence between modeled and empirical data suggests limited utility in isolating bias-prone segments. VAE-GMM, in contrast, enables high-resolution clustering that can resolve biases at or near the single 50-mer level, offering a more precise framework for downstream applications such as siRNA target region selection, where broad GC or MFE bins may overlook optimal sites.
Validation of RNA tertiary structure–determined sequencing efficiency
The influence of RNA tertiary structure on sequencing efficiency was evaluated using RNA-seq data from six colorectal samples. A stacking plot (Fig. 6A) comparing the 50-mer sequencing count profiles of the EMP1-211 transcript revealed significant variability in coverage patterns. These findings suggest that full-length transcript coverage is shaped by both global isoform-overlapping frequency and local RNA segment structure (Supplemental Fig. S24). To isolate the structural effects on RNA-read conversion, a global overlapping frequency-based modeling approach was applied to normalize sequencing coverage. Despite high-dimensional structural variations, the 50-mer count distributions were consistent across colorectal samples, supporting the hypothesis that RNA tertiary structure significantly influences sequencing efficiency at specific transcript regions. This hypothesis was further validated through correlation analysis (Fig. 6B), where Spearman's correlation coefficients demonstrated strong agreement among profiles from different samples. To extend these findings, the GAPDH-201 transcript was analyzed in HEK293T and MCF-7 cell lines, as well as an additional colorectal sample, using three RNA-seq protocols: (1) hexamer-based with Ribo-off rRNA depletion; (2) hexamer-based with oligo(dT) mRNA enrichment; and (3) oligo(dT)-primed total RNA extraction (Fig. 6C). Despite variability introduced by different RNA environments and protocols, the 50-mer count distributions remained consistent across hexamer-based methods, underscoring the substantial impact of RNA tertiary structure on sequencing efficiency. In contrast, oligo(dT) priming produced distinct, uncorrelated profiles (Supplemental Fig. S25) due to its bias toward the poly(A) tail, which minimizes the influence of transcript-wide structures and emphasizes terminal regions. Further analysis of housekeeping transcripts (ACTB-217, B2M-201, HPRT1-201, RPLP0-203, TUBB-201, and UBC-201) across various samples (Supplemental Fig. S26) revealed consistent 50-mer coverage patterns, reinforcing the role of RNA structure in sequencing bias. Simulated 50-mer coverage profiles for two ACTB isoforms (ACTB-215 and ACTB-222) (Supplemental Fig. S27) also demonstrated a discernible correlation with empirical data, despite differences between theoretical models and actual sequencing results.
Validation of RNA structure–driven local sequencing efficiency. (A) Stacked plot showing the distribution of 50-mer sequencing counts across the EMP1-211 transcript template in six human colorectal samples. (B) Spearman's correlation plot illustrating the similarity of 50-mer sequencing profiles for EMP1-211 across the six human colorectal samples. (C) Stacked plot of 50-mer sequencing counts for GAPDH-201 in different samples and protocols. Data includes HEK293T and colorectal samples (center1), sequenced with a hexamer-based Ribo-off rRNA depletion protocol, and MCF-7 samples (center2), sequenced with a hexamer-based oligo(dT) mRNA enrichment workflow. Additionally, HEK293T samples were sequenced using an oligo(dT)-induced reverse transcription for total RNA workflow. (D) UMAP visualization of dimensionality reduction for 1236 unique 50-mer sequences from GAPDH-201, clustered into 100 groups using the VAE-GMM algorithm. (E) Scatterplot comparing aggregated sequencing counts and modeled counts for GAPDH-201 50-mer clusters. Sequencing data from HEK293T (hexamer), MCF-7 (hexamer), colorectal samples (hexamer), and HEK293T (oligo[dT]) are plotted against modeled global-frequency aggregates. Linear regression analysis quantifies the relationship between observed and predicted counts, with regression parameters denoting fit accuracy. (F) Coverage plot showing sequencing depth for GAPDH-201 across nine exons, highlighting variations in single-end read alignment to the genomic reference. (G) Hexamer binding site distribution along the GAPDH-201 template. Of 1031 potential unique sites in coding regions, 977 are actively utilized for hexamer priming, initiating reverse transcription.
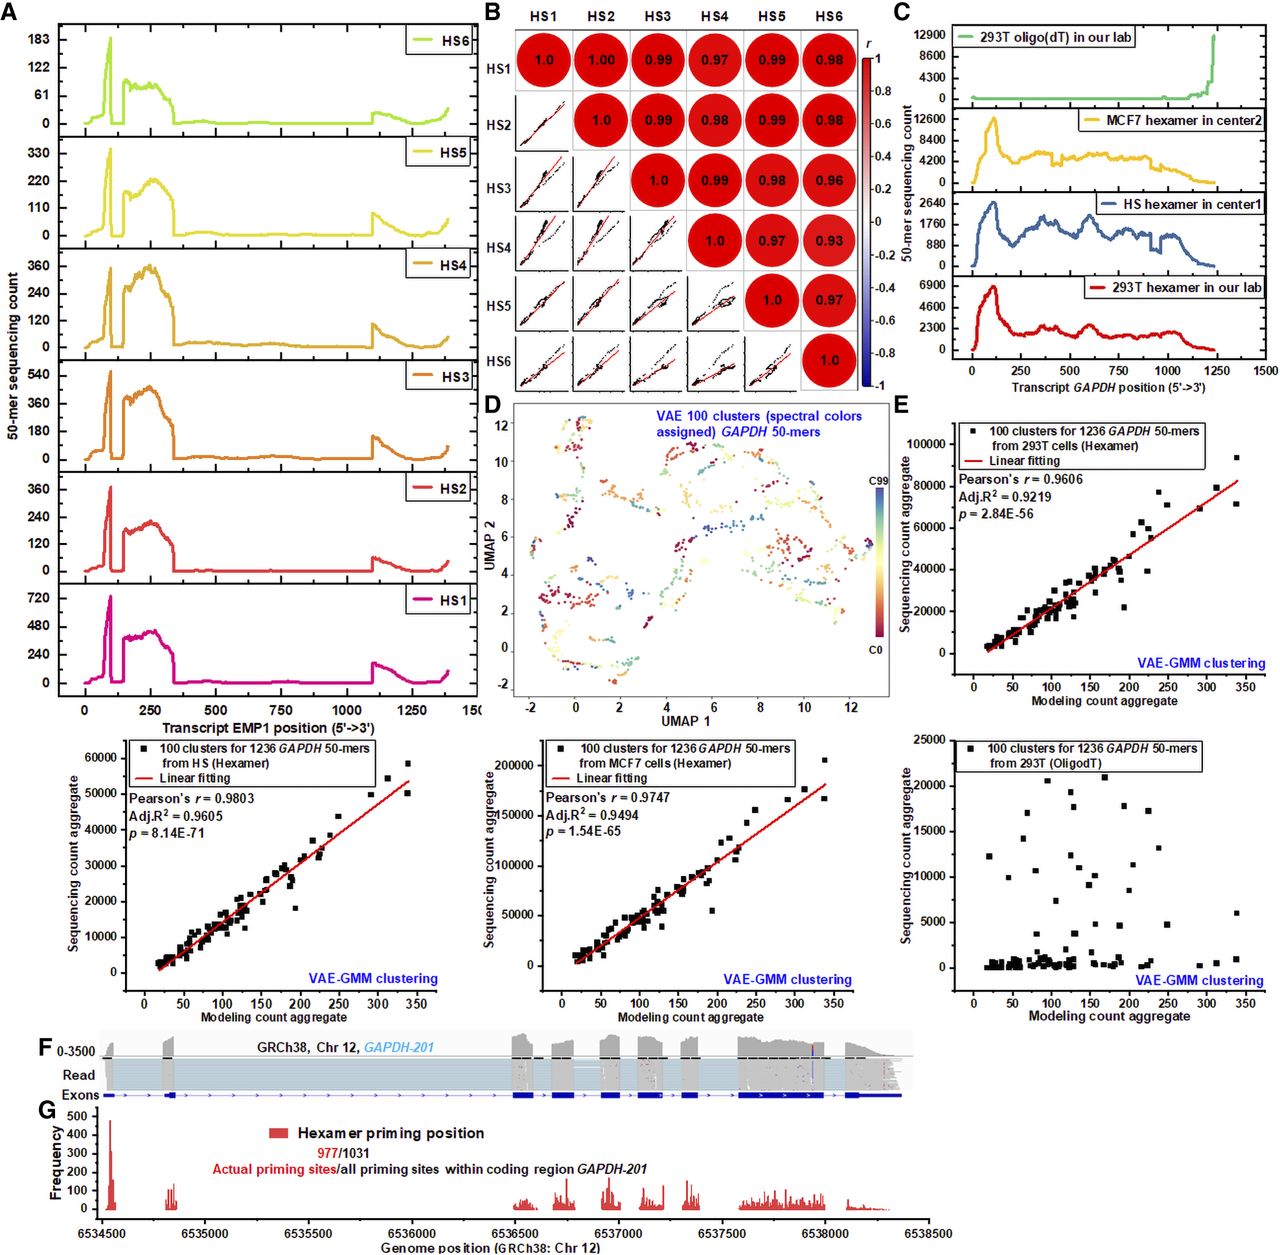
In an extensive analysis of deep structure deciphering, 1236 50-mer sequences of GAPDH-201 were categorized into 100 distinct groups using VAE-GMM clustering. This was applied across four samples under different RNA environments and hexamer-based sequencing protocols. The categorization of GAPDH 50-mers was effectively visualized using UMAP (as shown in Fig. 6D). Further analysis revealed that the aggregated counts from the modeling across all 200 clusters closely matched the sequencing count aggregates obtained from various cell lines and tissues, including HEK293T, MCF-7, and human colorectal samples (illustrated in Fig. 6E). These data were generated using a hexamer-based protocol, which employs random hexamers to initiate reverse transcription. These hexamers tend to bind preferentially to certain transcript regions, influenced by the unique tertiary structures of these regions, thereby affecting the sequencing output. In contrast, linear regression analysis was not applicable to data obtained from the oligo(dT)-based protocol. This method uses a poly(T) primer to initiate cDNA synthesis, focusing almost exclusively on the poly(A) tail at the 3′ ends of transcripts. The oligo(dT) approach is less influenced by the structural elements of transcripts, resulting in extremely high sequencing efficiency at the 3′ ends but potentially lacking in capturing the full diversity of transcripts.
We hypothesize that our VAE-GMM framework captures the complex local RNA substructures that influence sequencing efficiency. By clustering k-mers within its latent space, the model groups segments with similar structural properties, which, in turn, correlate with their observed biochemical behaviors, such as hexamer priming efficiency. To investigate the impact of k-mer-level substructures on sequencing efficiency, we analyzed the distribution of hexamer binding sites across the GAPDH-201 transcript. Single-read alignments against a genomic reference, rather than the full transcript, enabled precise localization of hexamer binding events. Sequencing depth plots derived from these alignments revealed significant variation in read distribution across the transcript's nine exons (Fig. 6F). These inconsistencies highlight the complex interplay of hexamer binding, priming, and elongation, influenced by local RNA substructures. Notably, disruptions in coverage were observed around the eighth exon, likely due to somatic mutations, which interrupted the continuity of 50-mer profiling in this region (Fig. 6C, HS hexamer in center1). These findings demonstrate a strong correlation between k-mer-based count profiles and sequencing depth derived from genomic alignments. Further analysis of hexamer binding positions across the GAPDH-201 coding regions tracked the genomic starting points of mapped reads, revealing diverse preferences for hexamer priming sites. Approximately 95% of identified hexamer priming sites actively initiated reverse transcription at the current sequencing depth (Fig. 6G). The efficiency of local RNA conversion is primarily influenced by the high-dimensional substructures of local hexamer binding sites. However, the overall sequencing efficiency—including binding, priming, and elongation—is shaped by structural variations along the entire transcript. This is evident from discrepancies in sequence count profiles when comparing hexamer priming initiation sites (Fig. 6G) with single-read fragment mapping (Fig. 6F) and 50-mer alignment sites (Fig. 6C). For example, initiation hexamer-binding frequency is highest at the beginning of the GAPDH-201 transcript, whereas peak sequencing read or 50-mer depths occur at other regions. These observations underscore the critical role of RNA substructural features in modulating sequencing efficiency across the transcript.
Discussion
Our multidimensional structure analysis focuses on k-mer segments of RNA rather than full transcripts, given current limitations in predicting the complete 3D structures of long RNA sequences (Zhang et al. 2022). Segment length is a critical parameter, and we selected k = 50 after balancing specificity, sensitivity, structural relevance, and compatibility with standard RNA-seq data. Short k-mers (<30 nt) are often nonspecific, occurring ubiquitously, whereas long k-mers (>75 nt) risk reduced sensitivity, sparse matches in typical 100- to 300-nt reads, and data sparsity. A 50-mer provides sufficient specificity, fits well within common 75- to 150-nt read lengths, and captures meaningful local secondary or tertiary motifs without losing fine structural details. To test robustness, we applied the VAE-GMM to ACTB using k = 25, 50, 75, and 100 nt. The model consistently produced distinct clustering (Supplemental Fig. S28B), showing it is not strictly dependent on 50 nt. However, reduced mapping specificity at 25 nt and data sparsity at ≥75 nt reinforce 50 nt as a practical transcriptome-wide choice.
Sequencing efficiency is strongly influenced by local substructures within k-mers, which are recognized by hexamers and processed by reverse transcriptase. Focusing on these structures provides region-specific insight into RNA transcripts, especially for in vitro RNA-seq. Analogous to proteins where amino acid sequences form α-helices or β-sheets (Dill and MacCallum 2012), RNA segments fold into hairpins, loops, stems, and pseudoknots, mainly via base pairing and nucleotide stacking. Whereas RNA's secondary motifs serve as structural building blocks, their 3D folding is less understood than protein tertiary structures. Adjacent k-mers can adopt dynamically changing tertiary shapes, but linking these directly to sequence counts is challenging. Our clustering-based VAE-GMM approach helps bridge this gap by grouping k-mers with similar learned structural features. High-dimensional RNA complexity demands advanced analysis tools to link structure and function. Modern RNA structure-probing methods,including enzymatic digestion, chemical modification, and crosslinking (Wang et al. 2021), identify sequence features such as reverse-transcription stops, mutations, or ligation junctions. These elements allow reconstruction of secondary structures but often fail to capture the complexity of tertiary folding. As our results show, many structure-specific bases in 3D space cannot be interpreted accurately through secondary structure alone. Large-scale mapping of 3D structures to biological functions is therefore needed. Notably, in vitro structure-probing patterns align closely with in vivo results (Rouskin et al. 2014; Weng et al. 2020), enabling direct correlation of tertiary structures with functional roles. Our multidimensional analysis leverages k-mer sequencing efficiency as an example, where empirical count profiles already inherently reflect high-dimensional structure.
The analysis of both modeled and sequencing data categorized by GC content or MFE revealed no significant differences in their Gaussian distributions. This finding challenges the conventional assumption that high GC content or low MFE inherently drives preferential sequencing or impacts primer and siRNA target selection. Instead, our results suggest that these one- and two-dimensional features capture only coarse structural trends and cannot resolve variations in sequencing efficiency observed between transcript segments that share the same GC or MFE values. This points to other influential factors—particularly high-dimensional structural patterns—being central to understanding sequencing bias. The VAE-GMM framework directly addresses this gap by clustering k-mers based on latent high-dimensional structural representations derived from their sequence-encoded features, allowing resolution down to the individual k-mer level. This deep granularity enables the detection of bias patterns that are completely masked within the broad bins produced by GC or MFE categorization.
A key advantage of VAE-GMM over traditional approaches is its capacity to capture complex, nonlinear relationships between structural features and sequencing efficiency-relationships that cannot be represented in a single axis such as GC content or MFE. In practice, this allows accurate grouping of structurally similar but sequence-diverse k-mers, improving our ability to isolate and characterize bias-prone regions. At the same time, we acknowledge that this increased resolution comes with trade-offs: the method is less immediately interpretable than GC- or MFE-based models and more computationally demanding, which may limit its direct deployment in large-scale pipelines. Nevertheless, these characteristics make VAE-GMM a powerful complementary tool to simpler predictors, providing insights where traditional metrics plateau in explanatory power. Looking forward, our results suggest that VAE-GMM could underpin next-generation bias correction strategies by integrating its fine-resolution clustering into transcript abundance estimation frameworks. Such methods could combine the interpretability and efficiency of low-dimensional features with the detailed structural precision of high-dimensional clustering, bridging the gap between theoretical modeling and practical RNA-seq bias mitigation.
Methods
Computational workflow for analyzing RNA multidimensional structure via k-mer modeling
VAE-GMM-based RNA read-conversion tracking
Identical mRNAs were segmented into non-overlapping 50-nt k-mers, with the first transcript split at positions 1–50, 51–100, and so forth, and subsequent transcripts shifted by one base to generate distinct but consistent 50-mer sets. A uniform single-base shift across all identical mRNAs ensured that each start position produced a unique set, repeating every 50 transcripts to capture all possible k-mers. k-mers were one-hot encoded and embedded using a variational autoencoder (Conv1D/dense encoder, Conv1DTranspose decoder) trained with combined reconstruction and Kullback-Leibler divergence loss, optimized by Adam with early stopping. Latent vectors, obtained via the reparameterization trick, were clustered with a full-covariance Gaussian mixture model, and silhouette scores were calculated to assess clustering quality. For each k-mer, sequence, modeling count, sequencing count, and cluster label were recorded. Counts were summed per cluster for both modeled and observed data, and the two sets were compared to identify discrepancies reflecting 3D structure-related bias (details in Supplemental Methods: “Step-by-Step Procedure for VAE-GMM-Based RNA-read Conversion Tracking Model”). Average differences across clusters were used to derive bias correction factors.
GC-based RNA read-conversion tracking model
k-mer generation and preprocessing followed the same segmentation and encoding procedure described for the VAE–GMM model (details in Supplemental Methods: “Step-by-Step Procedure for GC-Based RNA-read Conversion Tracking Model”). For the modeling data set, each 50-mer's sequence, modeling count, sequencing count, and GC content were recorded and grouped by GC content. Gaussian distributions were fit to the modeling data within each group to estimate intrinsic means and standard deviations. Sequencing counts were likewise grouped by GC content and fit with Gaussian models using these fixed parameters. Differences between modeled and observed fits were averaged across groups to determine GC-related bias.
MFE-based RNA-read conversion tracking model
k-mer generation and preprocessing followed the same segmentation and encoding procedure described for the VAE–GMM model (details in Supplemental Methods: “Step-by-Step Procedure for MFE-Based RNA-read Conversion Tracking Model” [this model is quite similar as the GC-based model]). For the modeling data set, each 50-mer's sequence, modeling count, sequencing count, and minimum free energy predicted by RNAfold were recorded and grouped by MFE. Gaussian distributions were then fit to the modeling data within each group to estimate intrinsic means and standard deviations. Sequencing counts were grouped by MFE and fit with Gaussian models using these fixed parameters. Differences between the modeled and observed fits were averaged across groups to quantify MFE-related bias.
Variational autoencoder for latent representation of RNA k-mers
We tested multiple methods for encoding RNA k-mers into latent vectors and adopted a variational autoencoder for learning compressed, lower-dimensional representations. Each k-mer was one-hot encoded, assigning A, C, G, and U distinct binary codes, yielding an input shape of (k, 4) per sequence, flattened to length 4k (details in Supplemental Methods: “Encoding k-mer sequence into latent vectors and training the convolutional neural network”).
The VAE comprised an encoder and decoder. The encoder reshaped flattened vectors to (k, 4), then applied three Conv1D layers (64, 32, and 16 filters; kernel size = 3) to capture sequence motifs. The output was flattened and passed to dense layers producing a latent mean (zmean) and log variance () of dimension 2. Latent vectors were sampled using the reparameterization trick
After training, the encoder projected all k-mers into latent space. A Gaussian mixture model clustered latent vectors, and silhouette scores evaluated clustering quality. UMAP reduced latent space to two dimensions for visualization, with points colored by cluster membership.
GC- and MFE-based RNA structural modeling
The GC‐ and MFE‐based algorithms are grounded in the binomial distribution, modeling GC occurrences (successes, S) in k‐length RNA fragments, where p = P(S) = 0.5 and q = 1 − p. For X GC bases in k trials,
Extending to MFE-based modeling
The MFE reflects RNA secondary-structure stability and is correlated with GC-content. For each sequence i,
As with GC, MFE distributions can be modeled by a Gaussian
VAE-GMM clustering and bias modeling
k-mers (50-mers) were first one-hot encoded into a 200-dimensional binary vector (50 positions × 4 bases). A variational autoencoder was then employed for dimensionality reduction and feature learning. The VAE architecture comprised a 1D convolutional neural network encoder (three Conv1D layers: 64, 32, 16 filters, kernel size 3, ReLU activation) mapping input k-mers to a two-dimensional latent space (parameterized by z_mean and z_log_var), and a corresponding 1D CNN decoder (three Conv1DTranspose layers: 16, 32, 64 filters, kernel size 3, ReLU activation, final layer with four filters and sigmoid activation) to reconstruct the original one-hot encoded k-mer. The VAE was trained using the Adam optimizer for up to 100 epochs with a batch size of 32, minimizing a loss function composed of binary cross-entropy reconstruction loss and a Kullback-Leibler divergence regularization term. Training utilized an 80/20 train/validation split of the k-mer data, with early stopping (patience = 5 on validation loss, restoring best weights) to prevent overfitting. For robust reproducibility, all random seeds (Python, NumPy, TensorFlow, data splits, GMM, UMAP) were fixed to 42. After training, the encoder transformed all k-mers into their latent representations (sampled from z_mean and z_log_var). A Gaussian mixture model with full covariance was then fitted to these latent representations to perform clustering. The number of clusters (k) was either prespecified (e.g., 200 for GAPDH comparison) or determined by optimizing the Bayesian information criterion (BIC) over a range of k (typically 2 to 30). Cluster assignments, silhouette scores, and UMAP visualizations of the latent space were generated. For bias modeling, aggregated modeling and sequencing k-mer counts within each identified VAE-GMM cluster were compared using linear regression to assess sequence-specific biases.
Data analysis
Raw paired-end sequencing data were analyzed using a quality control and alignment pipeline (details in Supplemental Methods). Initial quality assessment was performed with FastQC (v0.11.8) (https://www.bioinformatics.babraham.ac.uk/projects/fastqc/). Library-specific adapter sequences were removed with Cutadapt (v2.10) (Martin 2011), and additional adapter trimming together with low-quality base removal was performed using Trimmomatic (v0.39) (Bolger et al. 2014) to improve mapping accuracy. Processed reads were aligned to the GRCh38.p14 (Ensembl) reference genome using HISAT2 (v2.2.1) (Kim et al. 2019) or STAR (v2.7.3a) (Dobin et al. 2013) following reference indexing. Postalignment processing with SAMtools (v1.7) (Danecek et al. 2021) included SAM-to-BAM conversion, BAM indexing, extraction of transcript-specific coverage, and calculation of paired-end fragment length distributions for library quality assessment. Alignment quality was evaluated using RSeQC (Wang et al. 2012), and results were visualized with the Integrative Genomics Viewer (IGV) (Robinson et al. 2011). For transcript sequence analysis, k-mer counting was performed using kmer_counting_loop.py (https://github.com/QiangSu/N-sequence). Transcripts were split into 50-nt nonoverlapping k-mers, with subsequent identical mRNAs shifted by one base to capture all possible k-mers. k-mers were vectorized and clustered via a VAE-GMM approach, and UMAP was applied for two-dimensional visualization of high-dimensional cluster structure. For structural analyses, protein 3D conformations were predicted using AlphaFold and visualized in Mol*. RNA-seq simulation data were generated using polyester_simulated_data.R in R (R Core Team 2023) with the reference transcriptome, transcript abundance data, and defined fold-changes. The script installed dependencies, aligned transcript IDs, and output simulated sequencing reads for downstream performance evaluation (details in Supplemental Methods: “Data analysis”).
Collection of tissue samples
Colorectal tissue samples from Sun Yat-sen University Cancer Center and Shenzhen University General Hospital were obtained with informed consent and institutional ethics approval.
Cell culture
HEK293T cells were cultured in DMEM high glucose (HyClone, #SH30022.01) supplemented with 10% FBS (Thermo Fisher Scientific, #10100147). The cells were maintained at optimal conditions, incubated at 37°C with 5% CO2 and maintained in an environment of saturating humidity. MCF-7 cells were cultured in DMEM supplemented with 10% FBS, 5% penicillin/streptomycin, and 1 mg/mL insulin (Gibco). The cells were maintained at 37°C with 5% CO2 in a humidified incubator.
Library preparation
VAHTS Universal V8 RNA-seq Library Prep was used for all samples: Steps - RNA fragmentation, hexamer cDNA synthesis, end repair/dA-tailing, adaptor ligation, PCR amplification, and sequencing. The spike-in library used tagmentation in place of end repair/dA-tailing/ligation.
RNA isolation
Total RNA was extracted with RNAiso Plus (TaKaRa, #9109), resuspended in RNase-free water, quality-checked on a Bioanalyzer RNA picochip, aliquoted (5 µg), and stored at −80°C.
rRNA depletion
rRNA depletion was performed with a Ribo-off rRNA Depletion kit (Vazyme, #N406-01), involving probe hybridization, rRNA-probe degradation, and purification to enrich the non-rRNA fraction.
Spike-in circularization
A synthetic RNA oligonucleotide with a 5′-phosphate and a 3′-hydroxyl terminus was ligated using T4 RNA ligase 1 (NEB) in the presence of PEG 8000 and ATP to form circular molecules. Following the ligation reaction, RNase R digestion was used to remove any remaining linear RNA, leaving a purified sample of circular spike-ins. To ensure sequence diversity, random nucleotide positions (N) in the synthetic oligo were synthesized using an equimolar mixture of all four bases.
Reverse transcription
Reverse transcription was performed with SuperScript IV (Invitrogen, #18090200) and random hexamers in a 20-µL reaction: 25°C 10 min, 42°C 50 min, 70°C 15 min.
Tagmentation
For tagmentation, 50 ng DNA plus insertion buffer plus Tn5 adaptor index (TransNGS kit, #KP101) were incubated at 55°C for 5 min, digested, and prepared for library amplification.
PCR amplification
PCR amplification was carried out with 25 µL HIFI KAPA master mix, 10 µL cDNA, and primers in the following program: 95°C 5 min; 10–15 cycles of 95°C 15 sec, 60°C 30 sec. The samples were then purified with Ampure XP beads.
Sequencing
PE150 libraries were sequenced on Illumina NovaSeq 6000 or MGISEQ‐2000 platforms to target depth.
Statistics
To evaluate the adequacy of linear and Gaussian function fits, Pearson's correlation coefficients and adjusted R2 values were employed. Furthermore, the suitability of the models and potential deviations between the observed data and theoretical distributions were assessed through the use of nonparametric tests, specifically the Kolmogorov–Smirnov test against different sample size. The K-S tests serve as effective tools for comparing empirical data to theoretical distributions, such as the Gaussian distribution and cumulative distribution. Additionally, the strength and direction of the association between two variables were determined using Pearson's correlations.
Software availability
The code used for data analysis is available at GitHub (https://github.com/QiangSu/VAE-clustering) and as Supplemental Scripts. A prebuilt Docker image, containing all required dependencies, can be found on Docker Hub (https://hub.docker.com/r/qiangsu/vae-gmm-clustering).
Data access
All raw sequencing data generated in this study have been submitted to the NCBI BioProject database (https://www.ncbi.nlm.nih.gov/bioproject/) under accession numbers PRJNA999048, PRJNA1051320, and PRJNA1212028.
Competing interest statement
The authors declare no competing interests.
Acknowledgments
We acknowledge financial support from the National Key Research and Development Program of China (2023YFA0914904, 2022YFA1105601). This project is in part supported by the Shenzhen-Hong Kong Collaborative Innovation Research (SGDX20201103095404019), National Natural Science Foundation of China (82170070, 82241022), Shenzhen Municipal Research Grant (JCYJ20210324120206017), Yunnan Provincial People's Hospital Cooperation Project (202201AY070001-224), and Guangdong Provincial Key Laboratory of Regional Immunity and Diseases (2019B030301009). We acknowledge financial support from the Long Yi Postdoctoral Special Fund (S249201002).
Author contributions: Q.S. conceived the study. Y.L. performed structure-related analyses. Q.S. performed data analyses and generated the figures. Q.S. and Y.L. wrote the manuscript with input from all authors. D.G., Q.L., X.Z., and J.Q. contributed raw data and supervised the study. All authors read and approved the final version of the manuscript.
Notes
[1] Supplementary material [Supplemental material is available for this article.]
[2] Article published online before print. Article, supplemental material, and publication date are at https://www.genome.org/cgi/doi/10.1101/gr.280713.125.
References
- ↵Aird D, Ross MG, Chen WS, Danielsson M, Fennell T, Russ C, Jaffe DB, Nusbaum C, Gnirke A. 2011. Analyzing and minimizing PCR amplification bias in Illumina sequencing libraries. Genome Biol 12: R18. 10.1186/gb-2011-12-2-r18
- ↵Bolger AM, Lohse M, Usadel B. 2014. Trimmomatic: a flexible trimmer for Illumina sequence data. Bioinformatics 30: 2114–2120. 10.1093/bioinformatics/btu170
- ↵Bray NL, Pimentel H, Melsted P, Pachter L. 2016. Near-optimal probabilistic RNA-seq quantification. Nat Biotechnol 34: 525–527. 10.1038/nbt.3519
- ↵Cao S, Chen SJ. 2006. Predicting RNA pseudoknot folding thermodynamics. Nucleic Acids Res 34: 2634–2652. 10.1093/nar/gkl346
- ↵Cheng RP, Gellman SH, DeGrado WF. 2001. β-Peptides: from structure to function. Chem Rev 101: 3219–3232. 10.1021/cr000045i
- ↵Childs-Disney JL, Yang X, Gibaut QMR, Tong Y, Batey RT, Disney MD. 2022. Targeting RNA structures with small molecules. Nat Rev Drug Discov 21: 736–762. 10.1038/s41573-022-00521-4
- ↵Conesa A, Madrigal P, Tarazona S, Gomez-Cabrero D, Cervera A, McPherson A, Szcześniak MW, Gaffney DJ, Elo LL, Zhang X, 2016. A survey of best practices for RNA-seq data analysis. Genome Biol 17: 13. 10.1186/s13059-016-0881-8
- ↵Danecek P, Bonfield JK, Liddle J, Marshall J, Ohan V, Pollard MO, Whitwham A, Keane T, McCarthy SA, Davies RM, 2021. Twelve years of SAMtools and BCFtools. GigaScience 10: giab008. 10.1093/gigascience/giab008
- ↵Davies P, Jones M, Liu J, Hebenstreit D. 2021. Anti-bias training for (sc)RNA-seq: experimental and computational approaches to improve precision. Brief Bioinformatics 22: bbab148. 10.1093/bib/bbab148
- ↵Dill KA, MacCallum JL. 2012. The protein-folding problem, 50 years on. Science 338: 1042–1046. 10.1126/science.1219021
- ↵Djebali S, Davis CA, Merkel A, Dobin A, Lassmann T, Mortazavi A, Tanzer A, Lagarde J, Lin W, Schlesinger F, 2012. Landscape of transcription in human cells. Nature 489: 101–108. 10.1038/nature11233
- ↵Dobin A, Davis CA, Schlesinger F, Drenkow J, Zaleski C, Jha S, Batut P, Chaisson M, Gingeras TR. 2013. STAR: ultrafast universal RNA-seq aligner. Bioinformatics 29: 15–21. 10.1093/bioinformatics/bts635
- ↵Doersch C. 2016. Tutorial on variational autoencoders. arXiv:1606.05908 [stat.ML]. 10.48550/arXiv.1606.05908
- ↵Ganser LR, Kelly ML, Herschlag D, Al-Hashimi HM. 2019. The roles of structural dynamics in the cellular functions of RNAs. Nat Rev Mol cell Biol 20: 474–489. 10.1038/s41580-019-0136-0
- ↵Garber M, Grabherr MG, Guttman M, Trapnell C. 2011. Computational methods for transcriptome annotation and quantification using RNA-seq. Nat Methods 8: 469–477. 10.1038/nmeth.1613
- ↵Glinos DA, Garborcauskas G, Hoffman P, Ehsan N, Jiang L, Gokden A, Dai X, Aguet F, Brown KL, Garimella K, 2022. Transcriptome variation in human tissues revealed by long-read sequencing. Nature 608: 353–359. 10.1038/s41586-022-05035-y
- ↵Hansen KD, Brenner SE, Dudoit S. 2010. Biases in Illumina transcriptome sequencing caused by random hexamer priming. Nucleic Acids Res 38: e131. 10.1093/nar/gkq224
- ↵Kim D, Paggi JM, Park C, Bennett C, Salzberg SL. 2019. Graph-based genome alignment and genotyping with HISAT2 and HISAT-genotype. Nat Biotechnol 37: 907–915. 10.1038/s41587-019-0201-4
- ↵Kiselev VY, Andrews TS, Hemberg M. 2019. Challenges in unsupervised clustering of single-cell RNA-seq data. Nat Rev Genet 20: 273–282. 10.1038/s41576-018-0088-9
- ↵Kivioja T, Vähärautio A, Karlsson K, Bonke M, Enge M, Linnarsson S, Taipale J. 2012. Counting absolute numbers of molecules using unique molecular identifiers. Nat Methods 9: 72–74. 10.1038/nmeth.1778
- ↵Le SY, Maizel JVJr. 1997. A common RNA structural motif involved in the internal initiation of translation of cellular mRNAs. Nucleic Acids Res 25: 362–369. 10.1093/nar/25.2.362
- ↵Li J, Jiang H, Wong WH. 2010. Modeling non-uniformity in short-read rates in RNA-seq data. Genome Biol 11: R50. 10.1186/gb-2010-11-5-r50
- ↵Li J, Zhang S, Zhang D, Chen SJ. 2022. Vfold-pipeline: a web server for RNA 3D structure prediction from sequences. Bioinformatics 38: 4042–4043. 10.1093/bioinformatics/btac426
- ↵Love MI, Hogenesch JB, Irizarry RA. 2016. Modeling of RNA-seq fragment sequence bias reduces systematic errors in transcript abundance estimation. Nat Biotechnol 34: 1287–1291. 10.1038/nbt.3682
- ↵Lovmar L, Ahlford A, Jonsson M, Syvänen AC. 2005. Silhouette scores for assessment of SNP genotype clusters. BMC Genomics 6: 35. 10.1186/1471-2164-6-35
- ↵Martin M. 2011. Cutadapt removes adapter sequences from high-throughput sequencing reads. EMBnetJ 17: 10–12. 10.14806/ej.17.1.200
- ↵Oshlack A, Wakefield MJ. 2009. Transcript length bias in RNA-seq data confounds systems biology. Biol Direct 4: 14. 10.1186/1745-6150-4-14
- ↵Patro R, Duggal G, Love MI, Irizarry RA, Kingsford C. 2017. Salmon provides fast and bias-aware quantification of transcript expression. Nat Methods 14: 417–419. 10.1038/nmeth.4197
- ↵Picelli S, Faridani OR, Björklund AK, Winberg G, Sagasser S, Sandberg R. 2014. Full-length RNA-seq from single cells using Smart-seq2. Nat Protoc 9: 171–181. 10.1038/nprot.2014.006
- ↵R Core Team. 2023. R: a language and environment for statistical computing. R Foundation for Statistical Computing, Vienna. https://www.R-project.org/.
- ↵Risso D, Ngai J, Speed TP, Dudoit S. 2014. Normalization of RNA-seq data using factor analysis of control genes or samples. Nat Biotechnol 32: 896–902. 10.1038/nbt.2931
- ↵Roberts A, Trapnell C, Donaghey J, Rinn JL, Pachter L. 2011. Improving RNA-seq expression estimates by correcting for fragment bias. Genome Biol 12: R22. 10.1186/gb-2011-12-3-r22
- ↵Robinson JT, Thorvaldsdóttir H, Winckler W, Guttman M, Lander ES, Getz G, Mesirov JP. 2011. Integrative genomics viewer. Nat Biotechnol 29: 24–26. 10.1038/nbt.1754
- ↵Rouskin S, Zubradt M, Washietl S, Kellis M, Weissman JS. 2014. Genome-wide probing of RNA structure reveals active unfolding of mRNA structures in vivo. Nature 505: 701–705. 10.1038/nature12894
- ↵Sehnal D, Bittrich S, Deshpande M, Svobodová R, Berka K, Bazgier V, Velankar S, Burley SK, Koča J, Rose AS. 2021. Mol* Viewer: modern web app for 3D visualization and analysis of large biomolecular structures. Nucleic Acids Res 49: W431–W437. 10.1093/nar/gkab314
- ↵SEQC/MAQC-III Consortium. 2014. A comprehensive assessment of RNA-seq accuracy, reproducibility and information content by the Sequencing Quality Control Consortium. Nat Biotechnol 32: 903–914. 10.1038/nbt.2957
- ↵Smith T, Heger A, Sudbery I. 2017. UMI-tools: modeling sequencing errors in Unique Molecular Identifiers to improve quantification accuracy. Genome Res 27: 491–499. 10.1101/gr.209601.116
- ↵Stark R, Grzelak M, Hadfield J. 2019. RNA sequencing: the teenage years. Nat Rev Genet 20: 631–656. 10.1038/s41576-019-0150-2
- ↵Su Q, Long Y, Gou D, Quan J, Lian Q. 2024a. Enhancing RNA-seq analysis by addressing all co-existing biases using a self-benchmarking approach with 2D structural insights. Brief Bioinformatics 25: bbae532. 10.1093/bib/bbae532
- ↵Su Q, Long Y, Gou D, Quan J, Lian Q. 2024b. Enhancing RNA-seq bias mitigation with the Gaussian self-benchmarking framework: towards unbiased sequencing data. BMC Genomics 25: 904. 10.1186/s12864-024-10814-0
- ↵‘t Hoen PA, Friedländer MR, Almlöf J, Sammeth M, Pulyakhina I, Anvar SY, Laros JF, Buermans HP, Karlberg O, Brännvall M, 2013. Reproducibility of high-throughput mRNA and small RNA sequencing across laboratories. Nat Biotechnol 31: 1015–1022. 10.1038/nbt.2702
- ↵Trapnell C, Williams BA, Pertea G, Mortazavi A, Kwan G, van Baren MJ, Salzberg SL, Wold BJ, Pachter L. 2010. Transcript assembly and quantification by RNA-seq reveals unannotated transcripts and isoform switching during cell differentiation. Nat Biotechnol 28: 511–515. 10.1038/nbt.1621
- ↵Wang Z, Gerstein M, Snyder M. 2009. RNA-seq: a revolutionary tool for transcriptomics. Nat Rev Genet 10: 57–63. 10.1038/nrg2484
- ↵Wang L, Wang S, Li W. 2012. RSeQC: quality control of RNA-seq experiments. Bioinformatics 28: 2184–2185. 10.1093/bioinformatics/bts356
- ↵Wang XW, Liu CX, Chen LL, Zhang QC. 2021. RNA structure probing uncovers RNA structure-dependent biological functions. Nat Chem Biol 17: 755–766. 10.1038/s41589-021-00805-7
- ↵Weng X, Gong J, Chen Y, Wu T, Wang F, Yang S, Yuan Y, Luo G, Chen K, Hu L, 2020. Keth-seq for transcriptome-wide RNA structure mapping. Nat Chem Biol 16: 489–492. 10.1038/s41589-019-0459-3
- ↵Zhang J, Fei Y, Sun L, Zhang QC. 2022. Advances and opportunities in RNA structure experimental determination and computational modeling. Nat Methods 19: 1193–1207. 10.1038/s41592-022-01623-y