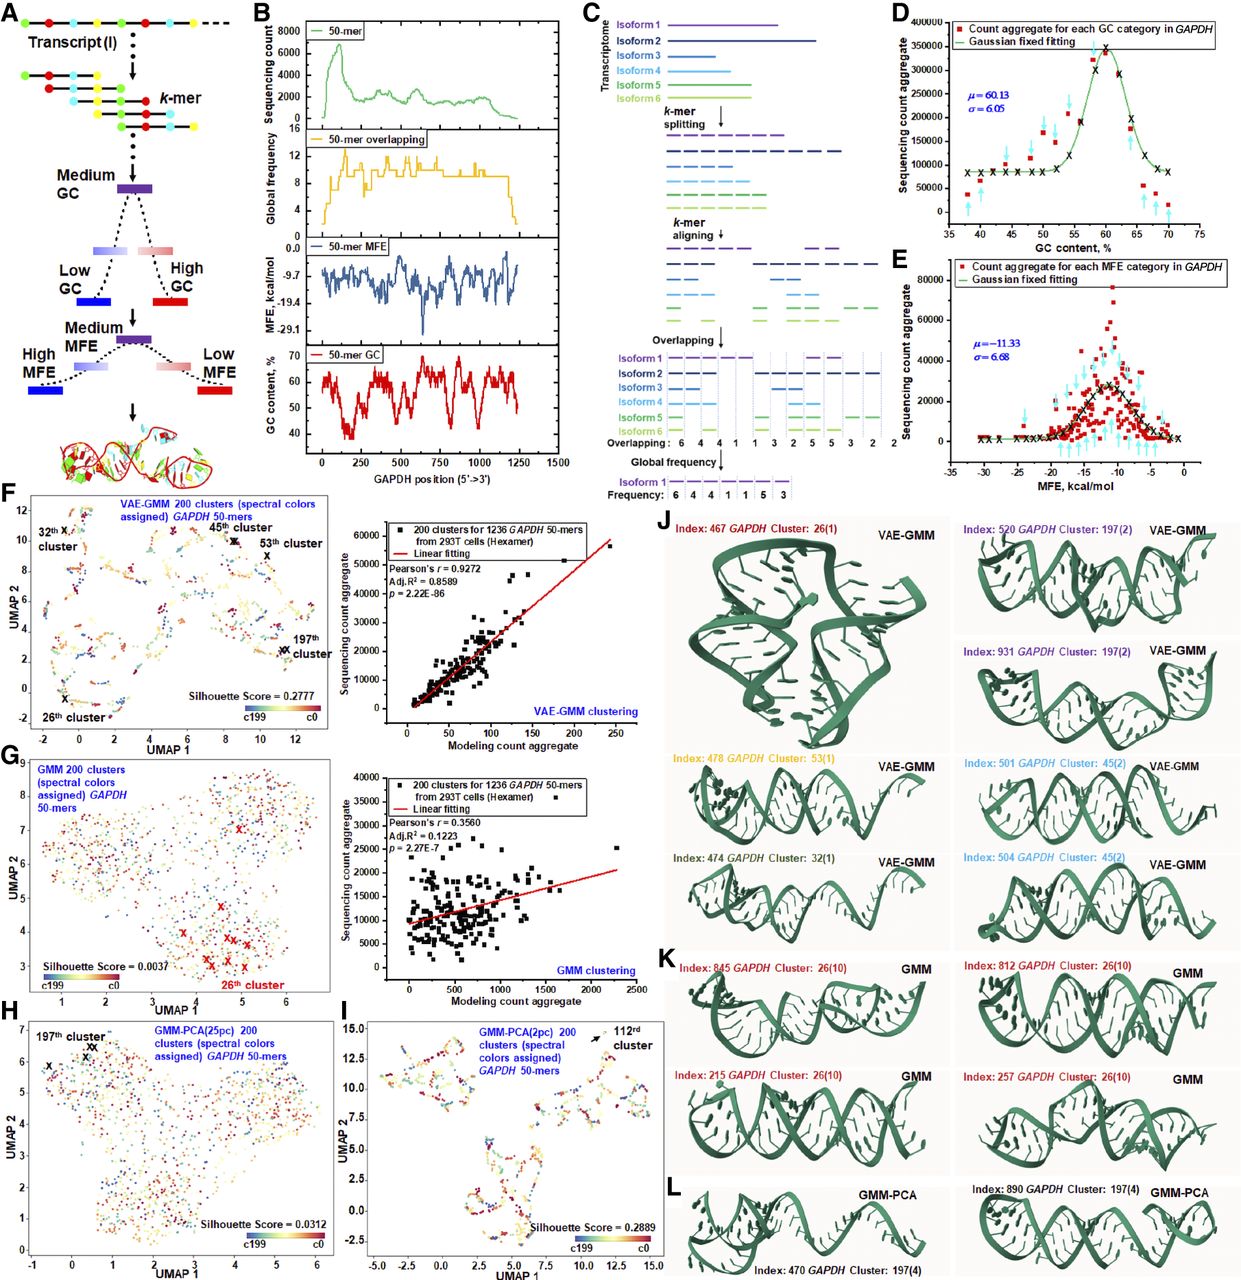
RNA structure–driven sequencing biases in RNA-seq of natural transcripts. (A) Natural transcript k-mers are analyzed based on their GC-content (1D), MFE (2D), and tertiary structure (3D). K-mer counts are aggregated into Gaussian distributions for GC-content and MFE categories, whereas tertiary structures are clustered using VAE-GMM for subsequent regression analysis of sequencing counts. (B) A stacking plot illustrates the distribution of 50-mer sequencing counts across the GAPDH transcript (ENST00000229239). Additional layers represent the GC-content, MFE, and the global overlapping frequency of each 50-mer. (C) The transcript is segmented into distinct k-mer sets per isoform. K-mers from each isoform are globally matched against those from other isoforms to generate an overlapping profile, highlighting the contribution of isoform-specific k-mers to individual sequencing counts. These frequencies serve as theoretical k-mer counts for modeling. (D) Aggregated global-frequency counts of GAPDH 50-mers are modeled using Gaussian distributions across various GC-content categories. Transcript-specific parameters (means and standard deviations) are determined. Actual sequencing data, categorized by GC-content, are aligned with these Gaussian models using predefined parameters. Calibration adjustments for each category are indicated by directional arrows. (E) Aggregated 50-mer counts, categorized by MFE, are compared to theoretical Gaussian distributions derived from global k-mer overlapping frequencies. Actual sequencing counts are matched to the corresponding Gaussian models across different MFE categories. (F) UMAP plot of GAPDH 50-mers clustered into 200 clusters using VAE-GMM. Clusters are color-coded, and specific clusters with notable 50-mer indices are highlighted for visualization. Modeling predictions and actual counts are aggregated for regression analysis. (G) UMAP plot showing clustering using a GMM-only approach, yielding 200 clusters. Cluster 26, containing 1050-mers, is highlighted. Predictions and actual counts are aggregated for regression analysis. (H) UMAP plot displaying clustering using GMM after PCA reduction to 25 principal components, resulting in 200 clusters. Cluster 197 containing four 50-mers is highlighted for visualization. (I) UMAP plot displaying clustering using GMM after PCA reduction to two principal components, resulting in 200 clusters. Cluster 112 containing seven 50-mers is highlighted for visualization. (J) AlphaFold-predicted 3D structures from VAE-GMM clusters are presented. Clusters 26 (index 467), 32 (index 474), and 53 (index 478) each contain a single 50-mer. Clusters 45 (indices 501 and 504) and 197 (indices 520 and 931) contain two 50-mers each. These clusters are highlighted in panel F to emphasize unique structural characteristics. (K) AlphaFold-predicted structural diversity in GMM Cluster 26. Cluster 26 from the GMM-only approach contains 10 GAPDH 50-mers (G), including index 467 from panel J. The structural diversity within this cluster is showcased by 50-mers with indices 215, 257, 812, and 845. (L) AlphaFold-predicted structural diversity in GMM-PCA (25pc) cluster 197. Cluster 197 from the GMM-PCA approach includes four GAPDH 50-mers (H), featuring index 467 from panel J. Structural diversity is illustrated with 50-mers of indices 470 and 890.