Abstract
Epigenetic mechanisms contribute to gene regulation by altering chromatin accessibility through changes in transcription factor (TF) and nucleosome occupancy across the genome. Despite numerous studies focusing on changes in gene expression, the intricate chromatin-mediated regulatory code remains largely uncharted on a comprehensive scale. We address this by employing a factor-agnostic, reverse-genetics approach that uses MNase-seq to capture genome-wide TF and nucleosome occupancies in response to the individual deletion of 201 transcriptional regulators in Saccharomyces cerevisiae, thereby assaying nearly 1 million mutant–gene interactions. We develop a principled new approach to identify and quantify chromatin changes genome-wide, allowing us to observe differences in TF and nucleosome occupancy that recapitulate well-established pathways identified by gene expression data. We also discover distinct chromatin signatures associated with the up- and downregulation of genes and use these signatures to reveal regulatory mechanisms previously unexplored in expression-based studies. Finally, we demonstrate that chromatin features are predictive of transcriptional activity, and we leverage these features to reconstruct chromatin-based transcriptional regulatory networks. Overall, these results illustrate the power of an approach combining genetic perturbation with high-resolution epigenomic profiling; the latter enables a close examination of the interplay between TFs and nucleosomes genome-wide, providing a deeper, more mechanistic understanding of the complex relationship between chromatin organization and transcription.
Every eukaryotic genome encodes the information necessary for cellular viability and growth. Although the underlying instructions embedded in the DNA are identical among the cells of an organism, complex regulatory mechanisms transform these universal instructions into cell type–specific programs that are able to respond to developmental and environmental cues. In part, this regulation is mediated by epigenetic mechanisms, which alter the accessibility of the chromatin in conjunction with changes in transcription factor (TF) and nucleosome occupancy across the genome (Li et al. 2007; Rando and Winston 2012). Although prior studies have provided valuable insights into transcriptional regulation by focusing individually on nucleosome positioning or TF binding (van Bakel et al. 2013; Kemmeren et al. 2014), the ability to characterize the precise interplay of nucleosomes and TFs together in the context of transcriptional regulation is crucial for better understanding gene regulation within an organism.
Although numerous efforts to construct gene regulatory networks (GRNs) have used genome-wide expression profiling under various genetic and environmental perturbations, gene expression alone does not capture all facets of regulation (Birrell et al. 2002; Giaever et al. 2002; Urnov 2003; Hu et al. 2007; Kemmeren et al. 2014). Later efforts augmented these studies by profiling metabolomic (Shakoury-Elizeh et al. 2010; Mülleder et al. 2016; Zelezniak et al. 2018) and proteomic (Messner et al. 2023) responses, but these still do not assay the full range of epigenetic mechanisms contributing to gene regulation. In yeast, chromatin accessibility plays an important role in gene regulation because nucleosomes are typically depleted at promoters in which TFs and other small factors bind directly to the DNA to activate or repress transcription (Marr et al. 2021; Minnoye et al. 2021). Recent advances in sequencing technology have enabled the characterization of chromatin remodelers, nucleosome positioning, and chromatin accessibility using high-throughput assays like ChIP-seq, DNase-seq, and ATAC-seq (Krogan et al. 2006; Johnson et al. 2007; Shivaswamy et al. 2008; Lenstra et al. 2011; Weiner et al. 2012; Toenhake et al. 2018) to supplement GRNs (Zhong et al. 2016; Miraldi et al. 2019; Li et al. 2022). Despite these efforts, these methods do not have the capability to precisely capture nucleosome and TF occupancy simultaneously at a high resolution across the entire genome within a single assay. As such, existing approaches have only been able to ascertain chromatin structure at the level of accessible versus inaccessible regions, or with respect to individual factors using factor-specific antibodies; the exact mechanisms of the interplay of all TFs and nucleosomes have yet to be explored with respect to transcription.
To address these challenges, here we develop a systematic, genetic approach to simultaneously profile nucleosome and TF changes in response to single-gene knockouts in Saccharomyces cerevisiae. We use genome-wide chromatin occupancy profiling (COP) (Henikoff et al. 2011; Belsky et al. 2015) to characterize the chromatin landscape of 201 mutants at near-nucleotide resolution. Using this high-resolution chromatin profiling, we capture genome-wide nucleosome and TF changes in response to these genetic perturbations, allowing us to gain a comprehensive understanding of the chromatin-mediated mechanisms of transcriptional regulation, thereby demonstrating the potential for chromatin profiling to reconstruct and enhance transcriptional regulatory networks (TRNs).
Results
MNase-seq profiling reveals genome-wide chromatin changes in genetic perturbation experiments
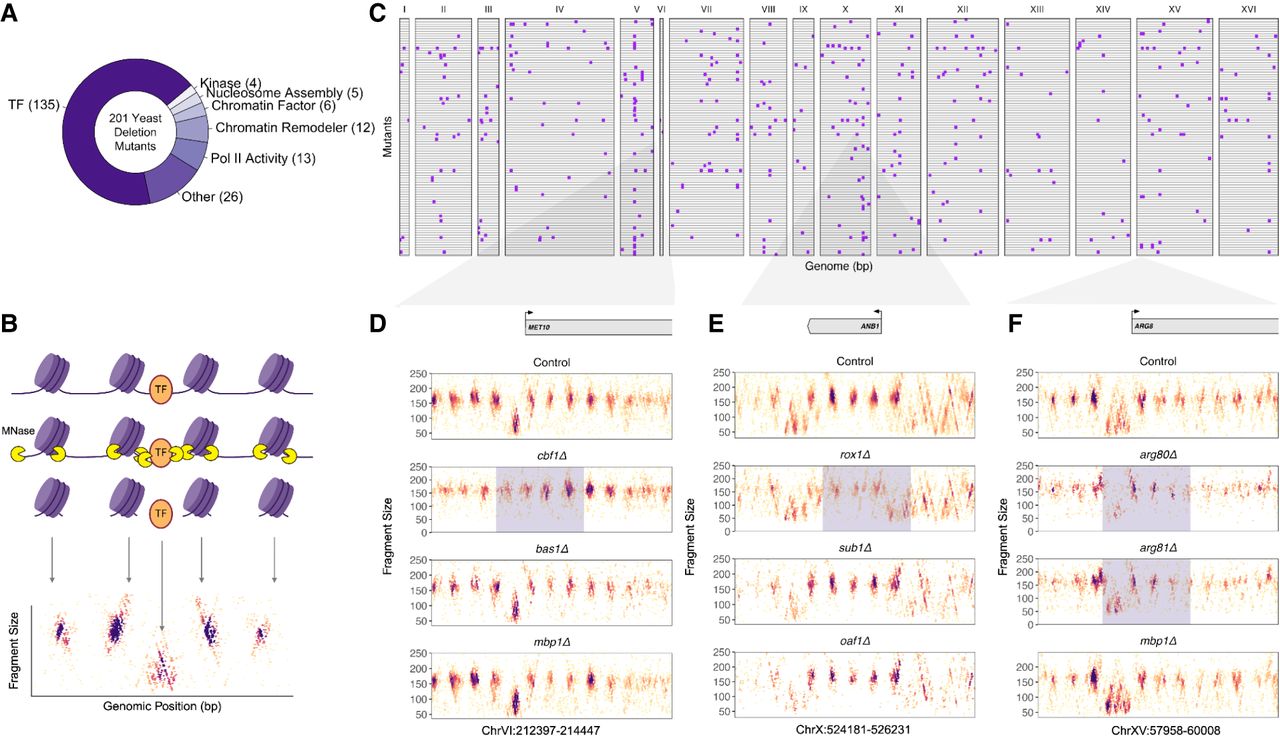
To investigate chromatin changes in response to the deletion of individual transcriptional regulators, we profiled genome-wide chromatin occupancy in 201 yeast knockout strains (Supplemental Fig. S1; Giaever et al. 2002; Giaever and Nislow 2014). We selected nonessential genes that encode primarily DNA-binding TFs, along with a few non-DNA-binding regulators and chromatin remodelers, to capture chromatin signatures of transcriptional regulation (Fig. 1A; Supplemental Table S1). For each mutant, we used micrococcal nuclease (MNase), an endo/exonuclease, to digest unprotected DNA, leaving behind DNA fragments protected by proteins (e.g., TFs and nucleosomes) to be sequenced (Henikoff et al. 2011). The resulting size of the protected fragments is indicative of the bound proteins. For example, histone octamers protect ∼150 bp of DNA, whereas TFs and other smaller DNA-binding factors protect smaller lengths (40–100 bp) (Fig. 1B). Because this approach does not rely on factor-specific antibodies, it can holistically capture the chromatin occupancy throughout the genome within a single assay. To visualize the COPs, we plotted the fragment length as a function of the location of the midpoint of each fragment and colored the points based on their local density. The result is a near-nucleotide-resolution genome-wide view of chromatin occupancy for each deletion strain (Fig. 1D–F).
Genome-wide landscape of chromatin occupancy for 201 transcriptional regulator mutants. (A) Functional classification of the 201 mutants in our MNase-seq data set. Labels are derived from the Saccharomyces Genome Database. (B) Schematic illustrating chromatin occupancy profiling of 201 yeast mutants via MNase-seq. MNase digests unprotected DNA, leaving DNA fragments bound by DNA-binding proteins such as nucleosomes or TFs. The resulting fragments are purified, sequenced, and plotted as a function of length, allowing nucleosome and TF occupancy to be visualized. Fragment midpoints are plotted along the x-axis, and fragment length is plotted on the y-axis, indicating nucleosome or TF-sized DNA. (C) Genome-wide map of chromatin changes in response to genetic perturbations. Loci with significant chromatin changes in response to a deletion are highlighted in purple (those reflecting the mutant deletion itself are excluded). Each row represents a mutant, and the x-axis represents genomic locations (base pairs) grouped by chromosome. (D) Deletion of CBF1 results in a loss of TF occupancy and inward shifting of nucleosomes at the MET10 locus (in contrast, this effect is not seen when BAS1 or MBP1, e.g., are deleted). (E) Deletion of ROX1results in a disruption and loss of nucleosome occupancy at the ANB1 locus. (F) Deletion of ARG80 and ARG81 both result in a loss of TF occupancy at the promoter in the ARG8 locus, with the loss more pronounced in the ARG80 mutant.
To identify changes in chromatin occupancy in each mutant with respect to a fixed yet robust control, we computed a baseline of chromatin occupancy by merging every mutant's MNase-seq profile and subsampling to the same total mapped reads of an individual sample (see Methods). The chromatin profile of this baseline control is highly similar to that of a separate wild-type sample in terms of nucleosome and TF occupancy across all genes (R = 0.91 for nucleosome occupancy and R = 0.89 for TF occupancy), as well as their MNase fragment lengths and positions (Supplemental Fig. S2). By incorporating the full variability of MNase digestion and sequencing depth across all 201 mutants rather than relying on a single wild-type sample, the baseline control serves as a robust estimate of nucleosome and TF occupancy.
Because our COPs provide a rich, multidimensional, and high-resolution view of the landscape of regulatory chromatin, we needed to develop a method for quantifying and identifying changes of all kinds across the genome. To accomplish this, we summarized the total chromatin change for each gene in every mutant by calculating the Jensen–Shannon (JS) divergence (Lin 1991; Menéndez et al. 1997; Fuglede and Topsoe 2004) between the two-dimensional distributions of all MNase fragments in the mutant and the baseline control. The JS divergence quantifies the difference between two probability distributions by measuring the average divergence of each with respect to the other. In our context, a high JS divergence represents a significant chromatin change between the mutant and the control. This serves as a measure to quantify any significant change in the distribution of chromatin fragments without needing to specify nucleosomes, TFs, or other biological interpretations of the fragment data. For each gene, we calculated the JS divergence of MNase fragments within a window from 250 bp upstream of the gene's TSS to 500 bp downstream, which captures not only its promoter but also the region of its gene body containing the +1, +2, and +3 nucleosomes. In total, we quantified interactions between every mutant and gene, 992,940 in total (201 mutants × 4940 genes). We fit these JS divergence values to a gamma distribution, and interactions representing the strongest chromatin changes within mutant–gene pairs were highlighted (Fig. 1C). To validate our measure, we assessed the JS divergence values of mutants at known target genes and found that the values were highly specific in comparison to all other mutants at that same locus (Supplemental Fig. S3). Because of the substantial sequencing depth required for these experiments, our study prioritized breadth over depth by examining as many DNA-binding proteins as possible rather than generating multiple replicates. Nevertheless, we validated 19 of the mutants that feature prominently in our analysis with two additional biological replicates (Supplemental Table S2; Supplemental Figs. S4, S5), and, after confirming concordance, the three independent biological replicates for these 19 mutants were merged for all subsequent analyses. Overall, our JS divergence approach provides a single, biologically agnostic measure for effectively quantifying differences in COPs.
Nucleosome and TF changes can be simultaneously quantified from COPs
After using JS divergence to summarize chromatin differences in a biologically agnostic way, we developed biologically informed measures to interpret the identified differences in chromatin occupancy with respect to how the occupancies of different factors changed (specifically, gain or loss of nucleosomes and TFs). For every gene, the nucleosome occupancy change was calculated as the log2 fold change (log2(FC)) of the total number of nucleosome-sized fragments (140–200 bp) between the control and mutant at the first three (+1/+2/+3) nucleosomes downstream from the TSS (Fig. 2A), as these nucleosomes are typically well positioned (Segal et al. 2006; Jiang and Pugh 2009; Lai and Pugh 2017; Tran et al. 2021). Similarly, we calculated the promoter nucleosome occupancy for the same fragment size range 250 bp upstream of every TSS to capture differences in promoter architecture.
Chromatin occupancy profiling simultaneously reveals nucleosome and TF changes. (A) Example of changing nucleosome occupancy at the PHO89 locus when PHO85 is deleted. (B) Example of changing TF occupancy in the promoter region of MET10 when CBF1 is deleted. (C) Chromatin changes at the GAL1-10 locus as a result of deleting the repressor GAL80. For both GAL10 and GAL1, nucleosomes exhibit decreased occupancy in the gene body, whereas TFs exhibit increased occupancy in the promoter. (D) Bar plots displaying the log2 fold change (log2(FC)) in nucleosome and TF occupancy at both the GAL10 and GAL1 genes as a result of deleting GAL80.
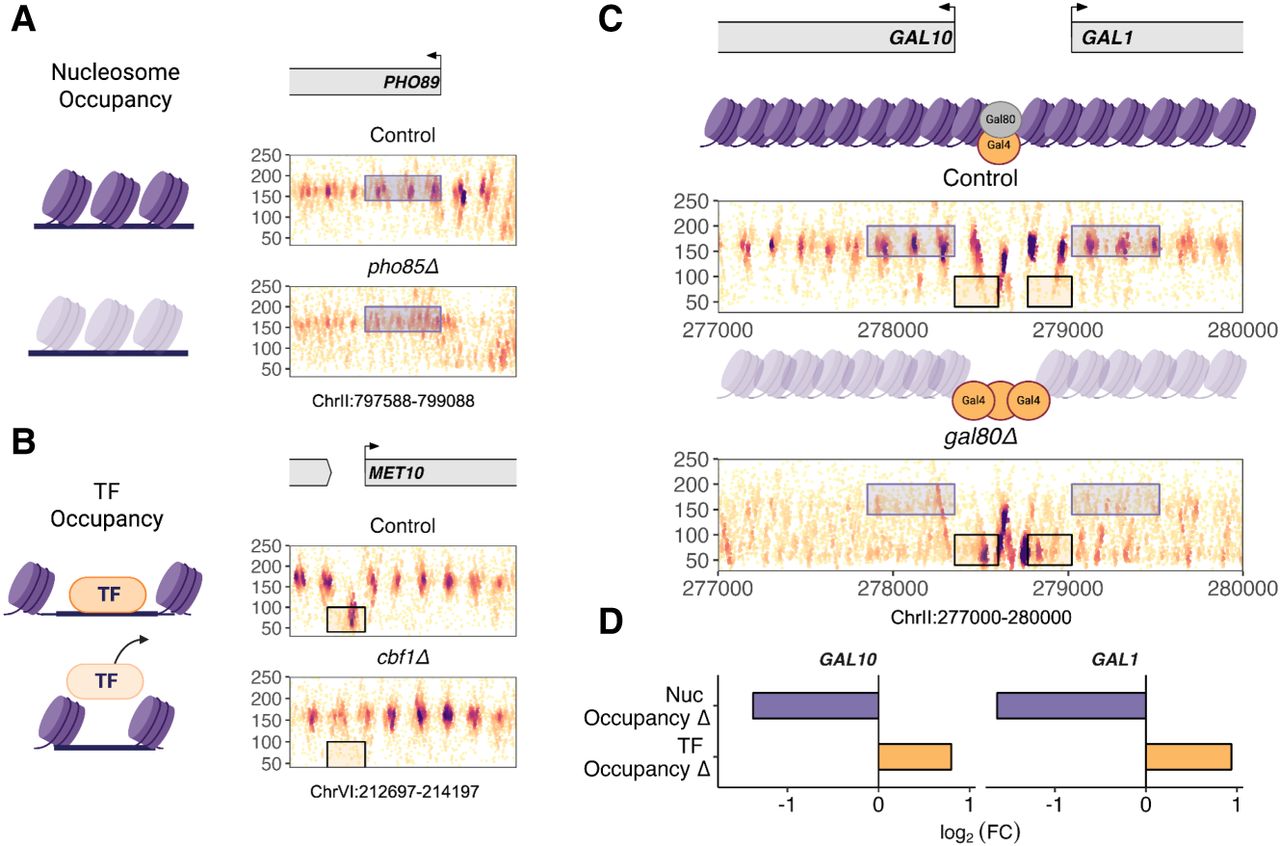
For smaller-sized fragments representing TFs, the TF occupancy change was likewise calculated from the MNase-seq reads. To capture both individual TFs and larger DNA-binding TF complexes, we selected a fragment size range of 40–100 bp and computed the log2(FC) in TF-sized fragments between the control and mutant at every promoter (250 bp upstream of the TSS) (Fig. 2B).
To validate the utility of our occupancy measures, we explored chromatin changes at well-studied genes in the galactose metabolic pathway. Under galactose-depleted conditions, the repressor Gal80 regulates genes associated with this pathway, such as GAL1 and GAL10, by repressing the activation domain of the transcriptional activator Gal4 that binds in their shared promoter (Lohr et al. 1995; Platt and Reece 1998). Accordingly, when we deleted GAL80, we observed a significant gain of TF occupancy at the GAL1-10 promoter and a decrease in nucleosome occupancy in both gene bodies, consistent with robust constitutive transcription of the locus despite the cells remaining in a galactose-depleted condition (Fig. 2C,D; Supplemental Fig. S4). Although early studies noted additional GAL80-independent mechanisms of repression for the GAL genes (mediated by growth in glucose/dextrose) (Torchia et al. 1984; Lohr and Hopper 1985), we and others using the yeast deletion collection (Hu et al. 2007; Kemmeren et al. 2014) found strong constitutive expression of the GAL genes in the gal80Δ mutant, even in the presence of dextrose (Supplemental Fig. S6).
In addition to considering changes in the nucleosome occupancy of genes, we also sought to quantify changes in their nucleosome organization, because nucleosome occupancy and organization, although related, are not entirely dependent on one another (Kaplan et al. 2009; Segal and Widom 2009; Wal and Pugh 2012). For this, we calculated the change in overall nucleosome disorganization between a mutant and the control as the log2(FC) of the Shannon entropy of the positional distribution of nucleosome-sized fragments (140–200 bp) (Supplemental Fig. S7). Each of these scores is described in more detail in the Methods section.
Chromatin changes are associated with gene expression changes and recapitulate known pathways
Next, we sought to compare the relationship between chromatin changes and transcription. Yeast transcription data from the same strains were obtained from a large-scale gene expression study across 1484 knockouts (Kemmeren et al. 2014). Of the 201 mutants in our MNase-seq data set, 191 had expression data from this study, providing us with an extensive overlap of epigenomic and transcriptomic information.
To determine a significance threshold for both gene expression and chromatin changes, we established a cutoff on the fitted JS divergences (gamma P-value) modeled after a Laplacian probability density function (Fig. 3A). This choice was based on the assumption that gene expression is unchanged for the majority of genes (Hu et al. 2007; Kemmeren et al. 2014), and as such, the cutoff for determining significant chromatin changes should be more stringent for genes that have low or no expression changes in order to reduce false positives.
Chromatin changes are associated with gene expression changes in the context of genetic perturbation. (A) Scatter plot of all genes in all mutants plotted by their gene expression change (x-axis) and chromatin change (y-axis). Most points are gray and fall below the Laplacian significance threshold (see Methods). Colored points represent genes whose chromatin changes as a result of a single-gene perturbation were above the Laplacian threshold; a point is blue if the gene's expression is downregulated (log2(FC) ≤ –0.5), red if the gene's expression is upregulated (log2(FC) ≥ 0.5), and green if the gene exhibits low differential expression (–0.5 < log2(FC) < 0.5). Triangles represent direct interactions between the deleted TF and its target gene (on the basis of binding site evidence). (B) The number of upregulated, downregulated, and low differential expression interactions with significant chromatin changes. (C–H) Scatter plots of individual mutants and their target genes plotted by their gene expression change and chromatin change. Significant interactions are labeled as described in A. (I–K) Heat maps of TF and nucleosome occupancy changes and their associated gene expression changes for known biological pathways.
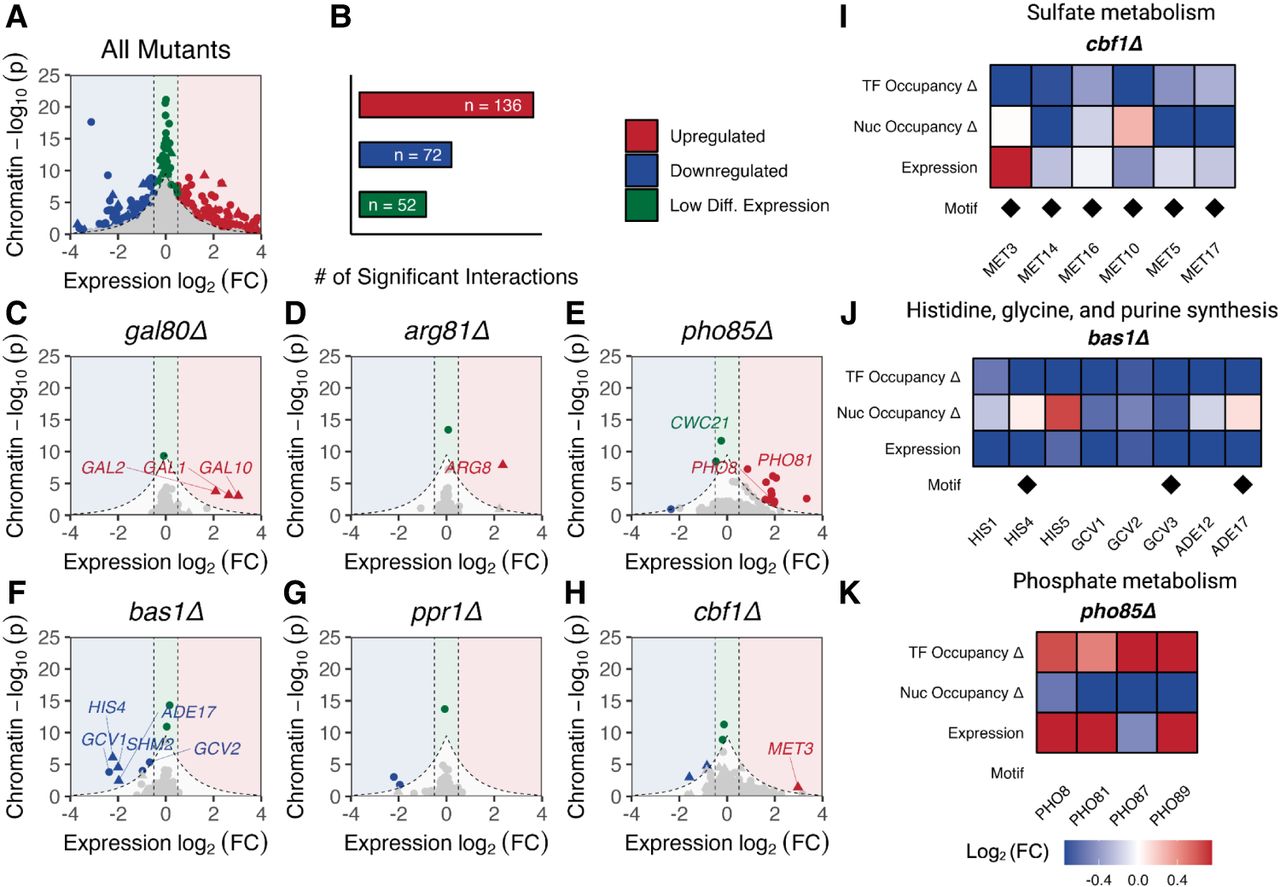
We found that a sizable majority of significant chromatin changes were associated with differentially expressed genes (Fig. 3A,C–H). Of the 260 significant mutant–gene interactions identified, 136 were upregulated genes with significant chromatin changes, and 72 were downregulated genes with significant chromatin changes (Fig. 3B). Next, we validated these significant interactions in a number of well-characterized pathways. As mentioned in the previous subsection, the deletion of GAL80 (gal80Δ) caused significant changes to the chromatin structure of the GAL loci, and we now found it was also associated with transcriptional changes, particularly at GAL1, GAL10, and GAL2 (Figs. 2C,D, 3C; Supplemental Figs. S6, S8). Similarly, the deletion of ARG81 (arg81Δ) and ARG80 (arg80Δ), TFs associated with the negative regulation of arginine biosynthesis genes (Messenguy and Dubois 1983), resulted in significant chromatin changes at ARG8, ARG5, and ARG6 that were also associated with increases in gene expression (Fig. 3D; Supplemental Fig. S8). Deletion of BAS1 (bas1Δ), a TF known to regulate many genes in the purine, histidine, glutamine, and glycine pathways (Arndt et al. 1987; Høvring et al. 1994), resulted primarily in a loss of TF occupancy at the ADE12/ADE17, HIS1/HIS4/HIS5, SHM2, and GCV1/GCV2/GCV3 genes, respectively (Fig. 3F,J). Furthermore, deletion of LYS14, a TF regulating genes in the lysine biosynthetic and metabolic pathways, resulted in both chromatin and expression changes at LYS9, effects that have been reported in prior studies (Supplemental Fig. S8; Borell et al. 1984; Ramos et al. 1988; Feller et al. 1994). Deletion of CBF1 (cbf1Δ), a TF that controls the sulfur assimilation and metabolism pathways (McIsaac et al. 2012; Petti et al. 2012), resulted in a loss of TF occupancy at numerous MET genes (Fig. 3H,I). As a final example, deletion of PHO85 (pho85Δ), a cyclin-dependent kinase, led to an increase in TF occupancy and a decrease in nucleosome occupancy associated with the upregulation of numerous target genes, many of which are related to phosphate metabolism (PHO8, PHO81, PHO89) (Fig. 3K; Toh-e et al. 1988; Schmid et al. 1992; Carroll and O'Shea 2002; Huang et al. 2007) or autophagy (ATG19, ATG22) (Fig. 3E; Kim and Klionsky 2000; Klionsky et al. 2003; Chang and Huang 2007).
In contrast to the high concordance between chromatin and gene expression overall, 52 interactions exhibited significant chromatin changes without corresponding differential expression (log2(FC) between –0.5 and 0.5) (Fig. 3A,B, highlighted in green). Although previous studies typically filter out genes with low differential expression to focus on the most robust expression changes (Kemmeren et al. 2014), the additional information captured from changes in chromatin reveals a deeper level of regulation. We noted a particular example of this at the PHO8–CWC21–KRE2 locus upon deletion of PHO85 (pho85Δ) (Fig. 3E). Although chromatin changes were associated with an upregulation in the gene expression of PHO8, nucleosomes appeared to be disrupted in the nearby CWC21 gene body as well as in the downstream KRE2 locus. Additionally, although we expected an increase in TF occupancy at the PHO8 promoter because it was upregulated, this increased occupancy extended well into the shared promoter of CWC21–KRE2 (Supplemental Fig. S9). This suggests that the regulation of CWC21–KRE2 may be impacted by the transcriptional mechanisms of PHO8 because of their close proximity, which explains the low expression change of CWC21–KRE2 and implicates a potential mechanism of transcriptional interference (for other examples, see Supplemental Fig. S10; Shearwin et al. 2005; Hainer et al. 2011; Yu et al. 2019). This demonstrates the potential of profiling chromatin to reveal additional regulatory interactions not captured by traditional transcriptional assays.
Chromatin signatures are distinct between upregulated and downregulated genes
Transcription initiation in yeast is primarily mediated by chromatin (Struhl 1987; Deshpande and Patel 2012; Brennan et al. 2023). Prior studies have shown that repressed genes frequently contain nucleosomes within their promoter regions, preventing TFs and other DNA-binding factors from binding and subsequently inducing transcription (Schmid et al. 1992; Tran et al. 2021). On the other hand, activated genes typically exhibit promoter regions in which nucleosomes have been evicted or shifted out to allow TFs to bind, as well as gene bodies in which nucleosomes have been disrupted by the passage of RNA polymerase (Jiang and Pugh 2009).
We analyzed the features of chromatin structure that differed among upregulated versus downregulated genes. Among the genes whose expression was upregulated (log2(FC) ≥ 0.5), most were characterized by a gain of TF occupancy at the promoters and a loss of nucleosome occupancy within the promoters and gene bodies (Fig. 4A,C). Conversely, genes that were downregulated (log2(FC) ≤ –0.5) primarily exhibited a loss of TF occupancy at the promoters and an increase in nucleosome occupancy, particularly in the gene body (Fig. 4A,D). Although the occupancy changes of individual chromatin features were observed to be significantly different between the two modes of transcription, we wanted to determine if these chromatin features were linked. Therefore, we extended this analysis by comparing TF, nucleosome, and expression changes within the same gene and found that they were generally coordinated together, suggesting that chromatin occupancy changes in nucleosomes and TFs are dependent on each other and display distinct chromatin signatures between the two modes of transcriptional regulation (Fig. 4C,D).
Distinct chromatin signatures between upregulated and downregulated genes. (A) Violin plots comparing the log2(FC) of TF occupancy at promoters, nucleosome occupancy within gene bodies, and gene expression between upregulated and downregulated genes. Upregulated genes (in red) are characterized by a gain in TF occupancy at the promoters and a loss in nucleosome occupancy within gene bodies, whereas downregulated genes (in blue) are characterized by a loss in TF occupancy at promoters. Significance of comparisons was evaluated using a standard t-test. (B) Violin plots comparing the log2(FC) of TF occupancy at promoters, nucleosome occupancy within gene bodies, and gene expression between established activators (light blue; n = 82) and repressors (pink; n = 25). Plots are split between direct (top) and indirect (bottom) interactions, in which a gene is labeled as direct if it involves a direct interaction implied by a motif (FIMO) or binding site (MacIsaac et al. 2006 and/or Rossi et al. 2021) in the target promoter and is labeled as indirect otherwise. (C) The top 20 upregulated mutant–gene interactions based on change in gene expression. Interactions are sorted by TF occupancy change. Heatmap values are colored by log2(FC). (D) Top 20 downregulated mutant–gene interactions based on change in gene expression. Interactions are again sorted by TF occupancy change.
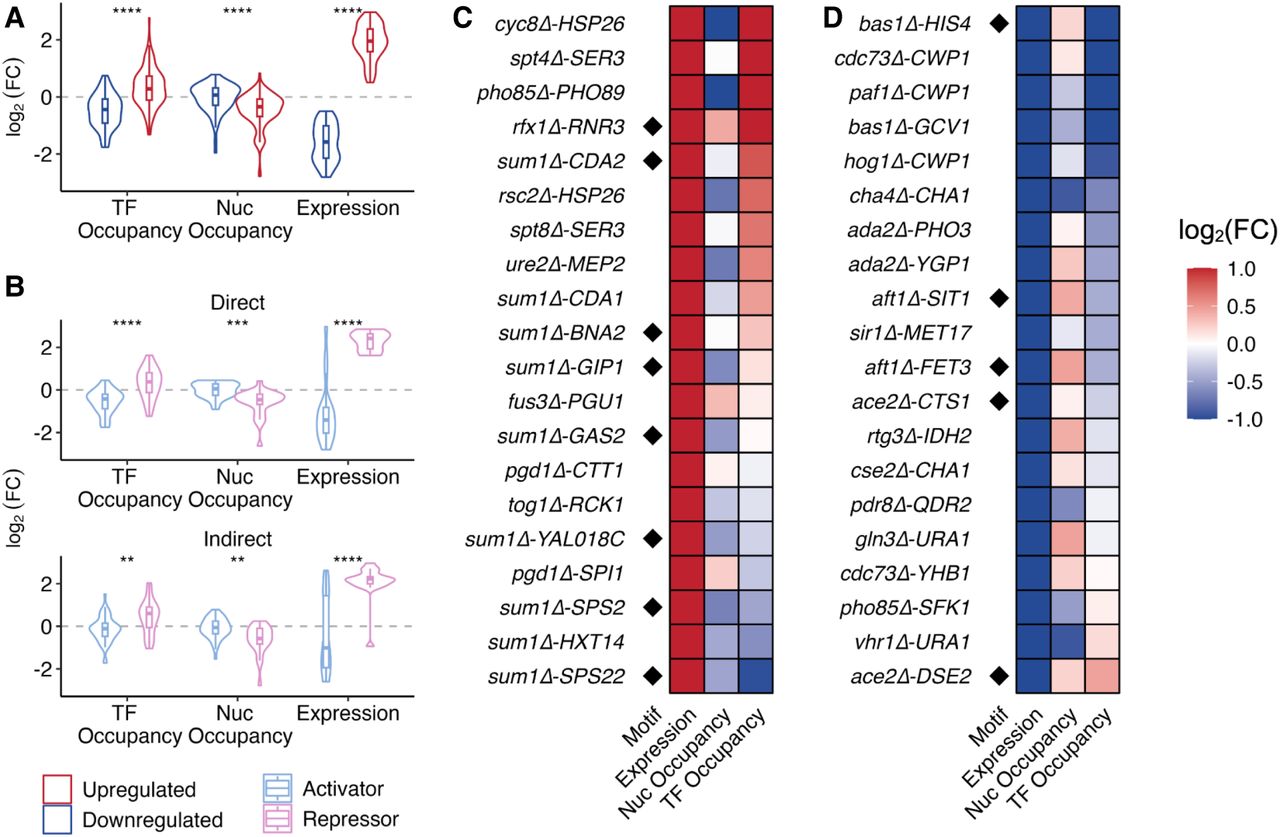
In light of the dynamic regulatory role of chromatin structure in gene expression, we aimed to further characterize the chromatin mechanisms underlying transcriptional regulation associated with established transcriptional activators (n = 82) versus repressors (n = 25). Among all the target genes with significant changes, chromatin signatures were clearly distinct even without relying on expression data to determine if genes were up- or downregulated. Most of the target genes responding to deleted activators resulted in a loss of TF occupancy and gain in nucleosome occupancy, reflecting the decrease in gene expression. The opposite was observed in target genes responding to deleted repressors, which suggests that the loss of a promoter-bound repressor will lead to a subsequent recruitment of other DNA-binding factors to promote transcription (Fig. 4B). We also considered that the direction of regulation may not be the same across a regulatory cascade or pathway. For example, although activators typically promote gene expression by facilitating the recruitment of RNA polymerase and transcriptional machinery, their effects on downstream targets can be nuanced. In some cases, activators may indirectly repress a gene downstream from their initial target through complex regulatory networks or feedback loops. Conversely, repressors can exhibit the opposite effect. To explore these possibilities, we further separated the two groups into direct and indirect interactions. An interaction was characterized as a direct interaction if an annotated binding site related to the mutant was confirmed by a motif or external binding evidence at the specific target gene (MacIsaac et al. 2006; Grant et al. 2011; Rossi et al. 2021). Chromatin signatures were consistent with up- and downregulation, especially among the direct interactions (Fig. 4B, top).
Individual chromatin features are predictive of transcriptional activity
To further investigate how each individual chromatin feature is associated with transcriptional regulation, we compared a gene's nucleosome occupancy, TF occupancy, and nucleosome disorganization to its observed expression change among all significant mutant–gene interactions. TF occupancy changes at promoters showed a moderate positive correlation with gene expression change (R = 0.40, P = 4.8 × 10⁻¹⁰), suggesting that a gain/loss of TF binding activity is typically associated with an increase/decrease in transcriptional activity (Fig. 5A). Conversely, nucleosome occupancy changes at both gene bodies (+1/+2/+3 positions) and promoters are negatively associated with gene expression (Fig. 5B,D). Although the correlations are weaker than with TF occupancy (gene body R = –0.23, P = 1.9 × 10⁻⁵; promoter R = –0.17, P = 0.0089), the most compelling instances are displayed in the loss of nucleosome occupancy in the most upregulated genes. Aside from occupancy, we found that an increase in nucleosome disorganization is only mildly associated with an increase in gene expression (R = 0.19, P = 0.0046), which could suggest that Pol II and other machinery disrupt well-phased nucleosomes in order for transcription to occur (Fig. 5C). Although the strongest nucleosome changes were observed within the first three nucleosomes (500 bp downstream from the TSS), we also investigated alterations in nucleosome occupancy toward the 3′ end of gene bodies. Specifically, we computed occupancy changes surrounding the polyadenylation site (PAS) and observed a negative correlation (R = –0.44, P = 1.8 × 10⁻¹²) between PAS nucleosome occupancy changes and gene expression changes (Fig. 5E).
Relationship between gene expression changes and chromatin features. Each point represents a significant mutant–gene interaction. Points are colored based on log2(FC) in gene expression (red, upregulated; blue, downregulated). Change in gene expression (y-axis) as a function of change in TF occupancy in the promoter (A), nucleosome occupancy in the gene body (B), nucleosome disorganization in the promoter and gene body (C), nucleosome occupancy in the promoter (D), and nucleosome occupancy at the polyadenylation site (PAS; E). (F) Change in gene expression as a function of the NET-seq transcription rate (Churchman and Weissman 2011). (G) Multiple linear regression model incorporating all chromatin features and transcription rate to predict change in gene expression. All R values are Pearson correlations.
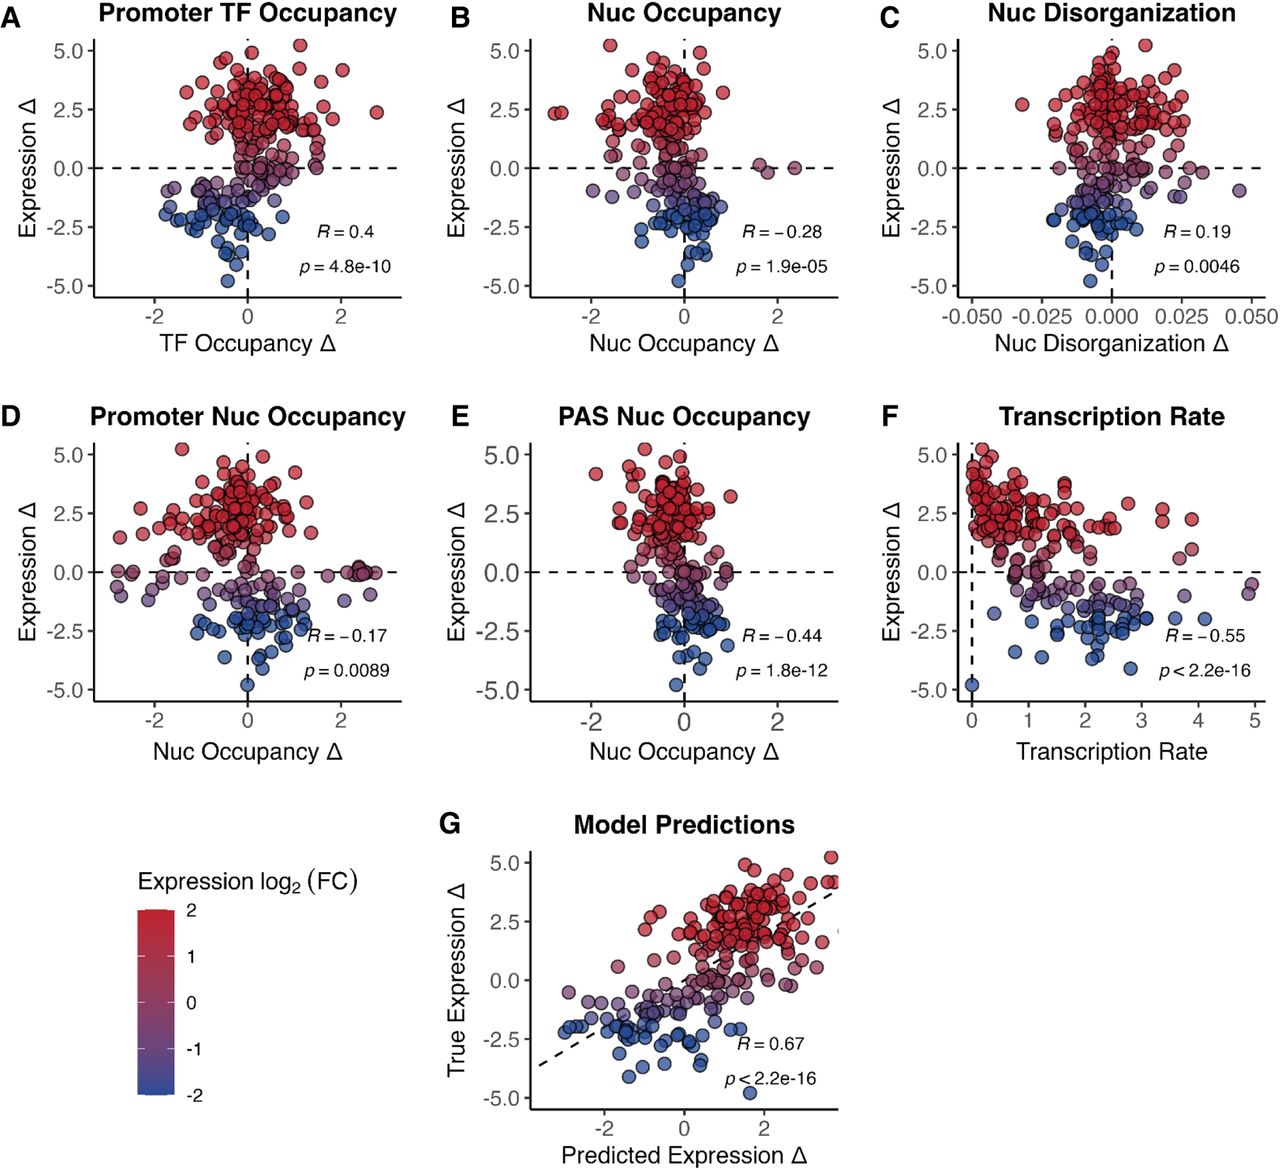
Although most chromatin features were correlated with gene expression, we further explored connections among features to determine any additional relationships (Supplemental Fig. S11). Nucleosome occupancy within the start of the gene body (+1/+2/+3 positions) was correlated with nucleosome occupancy changes near the PAS (R = 0.46), which suggests that chromatin changes at each end of the gene body are linked but perhaps not always consistently. Additionally, we found that nucleosome occupancy and nucleosome disorganization changes were negatively correlated despite measuring different aspects (R = –0.47), which is consistent with nucleosome positional disorganization being related to occupancy (Segal et al. 2006; Struhl and Segal 2013) or with each being a response to a process like transcription.
In addition to examining the features of chromatin occupancy, we considered the potential impact of the basal transcription rate of a gene on its expression level. To address this, we utilized NET-seq data (Churchman and Weissman 2011) to juxtapose transcription rates based on Pol II density with gene expression and found a negative correlation (R = –0.49, P < 2.2 × 10⁻¹⁶) (Fig. 5F). Furthermore, transcription rates were negatively associated with promoter TF occupancy and were positively associated with nucleosome occupancy (Supplemental Fig. S11).
We then sought to ascertain whether gene expression could be predicted by leveraging the combination of the individual features. To achieve this, we employed a linear modeling approach, training the model using ordinary least squares regression. The final model included the five chromatin features: TF occupancy at promoters, nucleosome occupancy at promoters, nucleosome occupancy at the start of the gene body (+1/+2/+3), nucleosome occupancy at the PAS, and nucleosome disorganization, along with transcription rate via NET-seq. To evaluate the model's performance, we plotted the true expression fold change versus the predicted expression fold change and found that it performed well across all significant mutant–gene interactions (R = 0.67, P < 2.2 × 10⁻¹⁶) (Fig. 5G). The utilization of a regression model permits us to predict transcriptional activity with a simple set of interpretable chromatin features, even though it cannot clarify the causal relationship between chromatin and transcription (i.e., whether chromatin changes drive transcriptional changes or vice versa). Even so, these observations underscore the concept that transcriptional activity is associated with chromatin state, suggesting that the recruitment of TFs and reorganization of nucleosomes are required to facilitate the progression of transcriptional machinery.
Differential TF binding activity can be identified by analyzing TF knockouts that target the same promoter
Although TFs play an important role in chromatin accessibility, differentiating between TFs that drive this accessibility versus TFs that do not remains a challenge (Brennan et al. 2023). This problem becomes more complicated when multiple factors bind to the same promoter sequence. To better understand the mechanisms involving TF binding, we extended our analysis of TF occupancy to promoters containing multiple TF binding sites in our perturbation MNase-seq data set. Promoters with differential binding data were identified by (1) including sites where multiple TFs from our mutant data set had annotated binding sites within a 250 bp window upstream of the TSS and (2) filtering for sites where at least one of these mutant TFs had a significant decrease in occupancy (log2(FC) < –1).
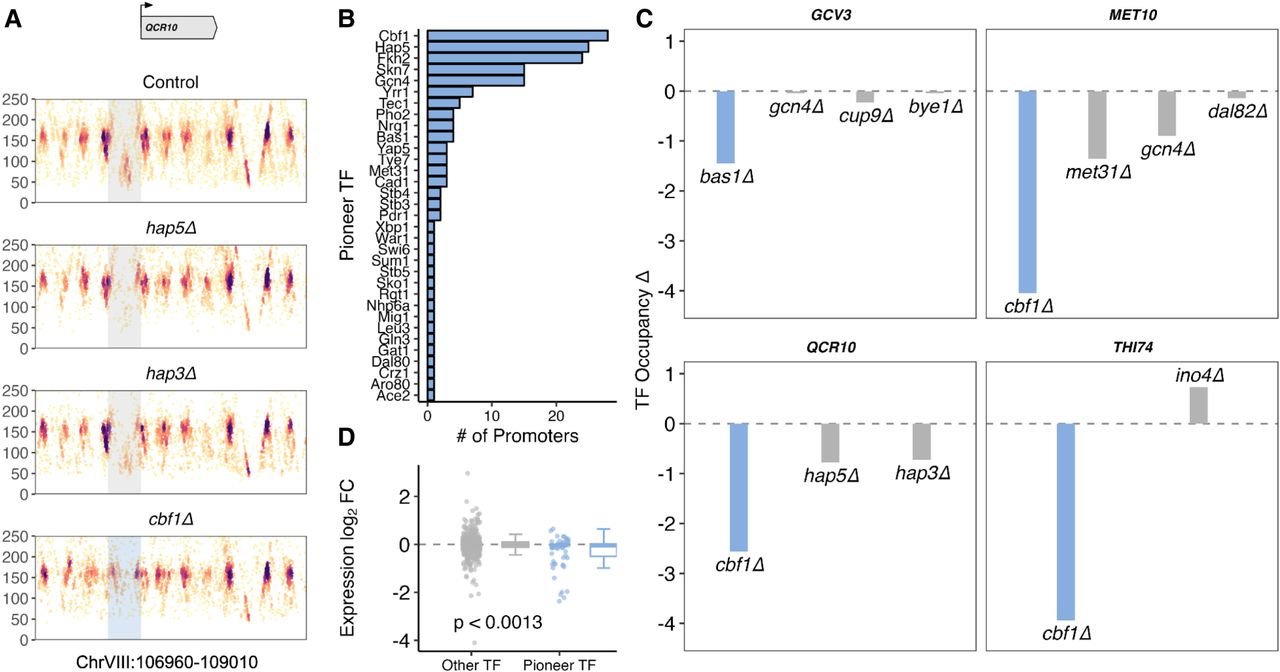
The TF Cbf1 has been shown in previous studies to have a high affinity for nucleosome-bound sequences and to act as a pioneer factor to facilitate nucleosome displacement (Kent et al. 2011; Donovan et al. 2019; Zaret 2020; Brennan et al. 2023). We investigated whether the pioneering activity of Cbf1 could be seen in our MNase-seq chromatin data. In the promoter of QCR10, Cbf1 is primarily bound with other factors like the Hap complex. Upon deletion of HAP5 or HAP3, TF fragments still appeared in the promoter (Fig. 6A). However, the deletion of CBF1 resulted in a promoter with no apparent TF occupancy, and a boundary nucleosome flanking the promoter has shifted inward in this absence of TF binding (Fig. 6A). We analyzed TFs with differential binding in promoters to look for a similar pattern and found several (including Cbf1, Hap5, Fkh2, Skn7, and Gcn4) whose deletion exhibited strong reductions in overall TF occupancy compared with the deletion of other TFs with binding sites in the same locus (Fig. 6B,C). The deletion of these TFs not only reduced TF occupancy in the promoter but also tended to result in decreased expression of the downstream gene (Fig. 6D). Overall, this approach provides a new opportunity to validate and discover promoter-specific binding mechanisms of many TFs. Because pioneer TFs possess the ability to access and remodel closed chromatin regions, our analysis can potentially elucidate the identity of such important factors by probing TF and nucleosome occupancy changes at gene promoters (Supplemental Fig. S12).
Analyzing changes in TF occupancy elucidates differential binding activity at promoters. (A) MNase fragment plot at the QCR10 locus. Top panel shows the control, when Cbf1, Hap3, and Hap5 are all available to bind in the promoter. Subsequent panels show what happens when one of those TFs is deleted. The HAP3 mutant retains much TF binding; the HAP5 mutant has less TF binding; and the CBF1 mutant has no TF binding (and an upstream nucleosome has shifted into the promoter), suggesting that Cbf1 exhibits pioneering activity at this locus. (B) Bar plot of TFs and the number of promoters at which they exhibit pioneering activity. (C) Bar plots representing, at four different gene promoters, the change in TF occupancy as a result of various TF deletion mutants. Individual bars represent the effect of deleting a single TF and are colored blue to indicate the TF labeled as pioneering. (D) Comparison of expression change in log2(FC) of genes between deleted TFs labeled or not labeled as pioneering.
Chromatin changes reconstruct TRNs and enhance their interactions
GRNs provide insight into cellular processes by detailing regulatory interactions between genes. A TRN is a type of GRN that focuses on representing the TFs that regulate the transcription of target genes (Hughes and de Boer 2013). Because many TRNs are constructed solely from gene expression data, it is often unknown even whether their depicted regulatory interactions are direct or indirect, let alone the exact mechanisms enacting these interactions (Lee et al. 2002; Hu et al. 2007; Jackson et al. 2020). As mentioned in the previous section, the addition of TF binding evidence from ChIP-seq or ATAC-seq has been shown to be invaluable in distinguishing such differences, but the evidence is, in the case of ChIP-seq, limited to individual factors or, in the case of ATAC-seq, only correlated with overall chromatin accessibility (Pranzatelli et al. 2018; Lowe et al. 2019; Miraldi et al. 2019; Li et al. 2022).
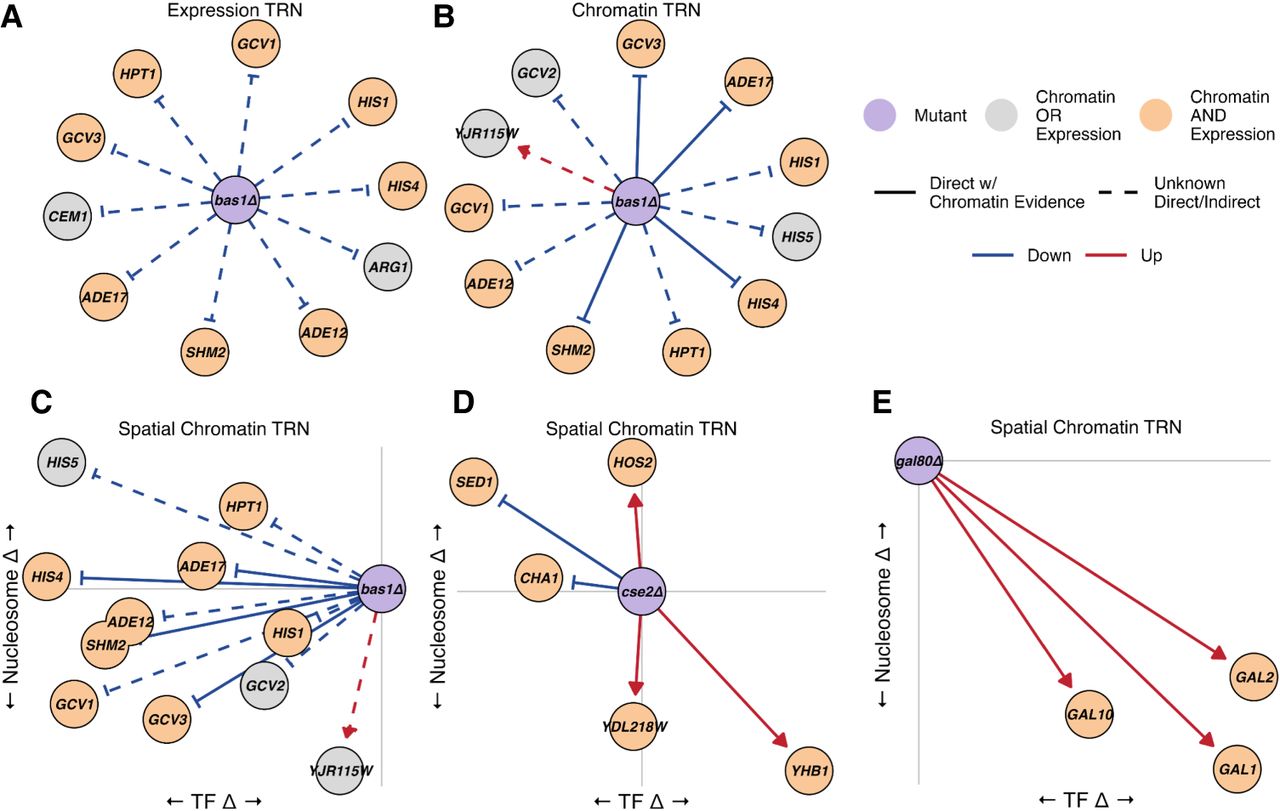
We leveraged the ability of MNase-seq to provide more mechanistic information about gene regulation in the form of chromatin changes in promoters and gene bodies to construct TRNs from chromatin data alone. For each mutant in our data set, we added an edge for any significant mutant–gene pair. Edges were colored by predicted upregulation (red) or downregulation (blue), according to our regression model built from chromatin features. We further classified each edge as a direct interaction if TF occupancy decreased sufficiently (log2(FC) < –0.5) and if an annotated TF binding site existed within the promoter of the target gene; otherwise, it was labeled as indirect. Compared with a TRN for bas1Δ constructed from gene expression data (Fig. 7A), the chromatin TRN recapitulates most, if not all, of the significant interactions (overlapping nodes are indicated in orange) (Fig. 7B). In fact, the chromatin TRN of bas1Δ also revealed two targets (GCV2 and HIS5) belonging to the glycine and histidine pathways that were not present in the gene expression TRN owing to low differential expression. Because chromatin features can also highlight the mechanistic context of transcriptional regulation, we extended our chromatin TRN by employing a spatial layout to represent changes in nucleosome (y-axis) and TF (x-axis) occupancy (Fig. 7C). This allows us to observe whether chromatin occupancy is increasing or decreasing, an aspect of gene regulation that cannot be ascertained from gene expression alone. As a result, we are able to characterize the up- or downregulation of target genes on the basis of their corresponding chromatin occupancy changes, as observed in cse2Δ and gal80Δ (Fig. 7D,E).
Chromatin dynamics from genetic perturbations recapitulate transcriptional regulatory networks (TRNs). (A) TRN based on gene expression as a result of deleting BAS1 (|log2(FC)| > 0.85). Colored edges represent upregulation (red) or downregulation (blue). Edges representing direct or indirect effects are denoted solid or dashed, respectively. The central node representing the mutant is colored purple; target genes are orange if they are significantly changed in both their chromatin and expression or are gray if they are only significantly changed in one of the two. (B) TRN reconstructed based on chromatin information alone. Colored edges represent predicted up/downregulation from chromatin features. (C) Chromatin TRN of bas1Δ with a spatial layout based on the mechanistic context of TF and nucleosome changes. A node's position left or right of the mutant node represents loss or gain in TF occupancy, and its position below or above the mutant node represents loss or gain in nucleosome occupancy, respectively. (D) Spatial chromatin TRN of cse2Δ. (E) Spatial chromatin TRN of gal80Δ.
It is also possible to explore interactions that involve more than one mutant. For example, SWI4 and SWI6 are key TFs enacting G1/S-specific transcription, and together they form a complex to bind to and regulate genes involved in DNA synthesis and repair (Sidorova and Breeden 1993). The individual deletions of SWI4 (swi4Δ) and SWI6 (swi6Δ) resulted in the upregulation of the heat shock protein HSP150, but the deletion of SWI6 additionally resulted in the upregulation of SWI4 (Supplemental Fig. S13). This suggests that HSP150 is regulated in the swi6Δ mutant not only directly but also indirectly via the upregulation of SWI4; this example highlights the potential for leveraging chromatin features to decipher complex regulatory relationships in TRNs (Supplemental Fig. S14). Among all chromatin TRNs, we noticed a high degree of overlap with the corresponding expression TRNs (|log2(FC)| > 0.85). The sir1Δ, pdr8Δ, lys14Δ, and dal80Δ networks had 100% of their targets recapitulated, whereas several others, including bas1Δ, gal80Δ, and arg80Δ/arg81Δ, had more than half of their targets overlap between their chromatin and expression networks (Supplemental Fig. S15).
We have demonstrated that changes in chromatin structure predict transcriptional responses; the key advance of our work is the ability to pinpoint the specific changes to chromatin structure that contribute to gene expression and to distinguish direct from indirect regulation via observations of TF occupancy. Unlike previous studies that relied on motif enrichment (Hu et al. 2007; Kemmeren et al. 2014), our approach offers new insights into the TF and nucleosome occupancies that are linked to transcriptional responses, significantly enhancing our understanding and modeling of GRNs.
Discussion
Transcriptional regulation is, in part, controlled by chromatin. However, despite previous studies characterizing transcriptomic (Hu et al. 2007; Kemmeren et al. 2014), metabolomic (Shakoury-Elizeh et al. 2010; Mülleder et al. 2016; Zelezniak et al. 2018), and proteomic (Messner et al. 2023) responses to genetic perturbations, the exact chromatin-mediated mechanisms enacting these responses have not been characterized at scale. Here, we developed an approach that combines a systematic genetic perturbation of transcriptional regulators with epigenomic profiling through MNase-seq, revealing new mechanistic insights into the genome-wide changes in nucleosome and TF occupancy across the nearly 1 million potential interactions between every mutant and every gene.
Because our data set provided such large-scale genome-wide profiles of nucleosomes and TFs generated from a single assay, we needed to develop a fast and efficient measure to quantify chromatin changes between many mutants and genes. We utilized the JS divergence to calculate overall changes in chromatin structure based on the two-dimensional distribution of MNase-seq reads. Because the JS divergence only requires sequenced reads as input, it can also be used to quantify genome-wide changes in other types of multidimensional data sets. For instance, in ATAC-seq, the JS divergence can be calculated between two distributions of reads in nucleosome-free regions to determine differences in overall chromatin accessibility or, in ChIP-seq or ChIP-exo-seq, to quickly identify changes in TF binding based on the distributions of peaks.
Although we established a link between chromatin features and gene expression, and identified distinct chromatin signatures between up- and downregulated genes, changes in chromatin and expression were not perfectly correlated: Some genes did not have an apparent chromatin change despite a significant gene expression change, whereas other genes had a significant chromatin change despite low or no expression change. Although we performed appropriate statistical tests and normalizations to account for technical variation between the data sets, this observation raises a question as to whether it is necessary for chromatin reorganization to take place in order for transcription to occur, a question that has been asked in the past (Edmondson and Roth 1996; John et al. 2011; Hübner et al. 2013; van Steensel and Furlong 2019; Kiani et al. 2022). On the other hand, our occasional observation of significant chromatin changes without accompanying changes in gene expression suggests that chromatin reorganization may play a role in alternative mechanisms of regulation. One such possibility is the priming of genes for more efficient future transcriptional response, which has been observed in cell fate specification (Ordway et al. 2024) and various stress responses (Bäurle 2018; Arzate-Mejia and Mansuy 2023). Another explanation could be the possibility of transcriptional interference between two genes in close proximity, which was observed in our analyses (Supplemental Fig. S10) and noted in several prior studies (Shearwin et al. 2005; Hainer et al. 2011; Yu et al. 2019). Despite these occasional differences, most genes displayed concordance between their chromatin and gene expression changes, allowing us to develop predictive chromatin signatures that align with our established knowledge of transcriptional mechanisms and support the robustness of our findings.
Our work opens other avenues for future studies. Many yeast TFs act in condition-specific ways, and the deletion of such TFs under log-phase growth in rich medium in some cases has no significant transcriptional effects. Therefore, one future direction would be to profile chromatin in the context of environmental perturbations or a variety of stress conditions (Chua et al. 2006; Weiner et al. 2012). Additionally, although our approach can be used to profile all potential DNA-binding proteins simultaneously, a limitation of MNase-seq compared with methods like ChIP-seq is its inability to ascertain the exact identity of TFs in promoters with multiple TFs cobound or within complexes. To overcome this, we utilized previously published binding data sets (MacIsaac et al. 2006; Rossi et al. 2021) and motif occurrences from FIMO (Grant et al. 2011) to infer the motif-specific occupancy of TFs, but analyzing paralogous or competitive factors binding to the same motif remains an active research area (Zhang et al. 2021; Martin et al. 2023; Snyder et al. 2025). Still, among all mutant–gene interactions identified with at least one annotated binding site across FIMO, MacIsaac et al. (2006), or Rossi et al. (2021), we found a majority of these annotations exhibit significant TF occupancy changes (|log2(FC)| > 0.5) (Supplemental Fig. S16) upon deletion of the TF. Although the total number of potential direct interactions was limited by the single growth condition of our mutants, the information obtained from profiling TF occupancy in the presence of genetic perturbations can serve as ground-truth validation of TF binding and thus resolve direct interactions from indirect ones.
In contrast to targeted approaches such as ChIP-seq or ATAC-seq, our factor-agnostic MNase-based chromatin profiling method requires high sequencing depth across the genome to accurately resolve the positioning of nucleosomes and other DNA-binding factors. For this reason, and with the aim of using our sequencing budget to interrogate the broadest possible range of transcriptional regulators, we initially profiled most of our mutants using only a single experiment, which is a limitation of our study. However, many of the key regulators that emerged (e.g., gal80Δ, arg80Δ/arg81Δ, bas1Δ, cbf1Δ) have been well characterized in prior literature. Additionally, we carried out two additional replicate experiments (for a total of three experiments) for 19 of those key regulators to ensure the reproducibility of our reported results. We also implemented genotype-level quality control to remove erroneous strains (the error rate was consistent with the known error rate of the yeast deletion collection) (Giaever and Nislow 2014).
Our study illuminates the intricate interplay between nucleosome changes and TF behavior in the face of genetic perturbation, thereby enhancing our understanding of the fundamental mechanisms governing gene expression regulation. These findings offer valuable insight into how changes at the genomic level manifest in the organization of chromatin structure and the orchestration of transcriptional activity. Moreover, integrating our results with existing large-scale data sets encompassing transcriptomic, metabolomic, proteomic, and epigenomic information in the future would provide a comprehensive framework for deciphering the multifaceted regulatory networks that govern cellular processes. This holistic approach not only deepens our comprehension of cellular function but also paves the way for more refined strategies in GRN inference, thereby advancing our ability to unravel the complexity of biological systems.
Methods
Selecting and confirming mutant yeast strains
The mutant yeast strains used in this study are from the Yeast Deletion Collection (Wach et al. 1994; Giaever and Nislow 2014). For our initial survey, we selected 234 mutant S. cerevisiae strains in which a nonessential gene that matched the Gene Ontology (GO) terms “chromatin remodeling” or “transcription regulation” had been deleted. Eight of these strains failed to grow, leaving 226 strains to analyze via high-throughput sequencing. Sequencing revealed discrepancies at the deleted gene of interest in 25 of the strains, resulting in the 201 confirmed deletion mutants used in our study. After our initial analysis of these 201 mutants, we selected 19 that were of particular interest and performed 38 additional MNase-seq experiments (19 mutants, two replicates each) to validate our key results (Supplemental Table S3).
Culturing yeast cells
Yeast was grown in YEPD medium at 30°C to an optical density (OD600) of 0.6–0.8. The cultures were cross-linked with 1% formaldehyde at room temperature (RT) for 30 min and quenched with 0.125 m glycine for 5 min at RT. Cells were washed with water, pelleted, flash-frozen, and stored at –80°C.
Digesting chromatin in preparation for MNase-seq
MNase digestion was performed as previously described (Henikoff et al. 2011; Belsky et al. 2015).
Aligning MNase-seq data
FASTQ reads were aligned to the S. cerevisiae genome (sacCer3) using Bowtie v1.1.1 (Langmead 2010) using the paired-end option with the following flags: -m1 -n 2 -l 20 ‐‐best ‐‐strata -S -y ‐‐phred 33 ‐‐nProc 32. Aligned files were processed and converted into BAM format using SAMtools v1.2 (Li et al. 2009).
Processing aligned MNase-seq data and generating a baseline control
Mutant MNase-seq samples were subsampled to have the same read depth and then merged to generate a baseline control for comparing against individual mutants. After confirming concordance across the three replicates in the subset of 19 mutants, aligned BAM files were merged by summarizing all fragments and subsampled to the same read depth. To mitigate the effects of PCR amplification bias, highly duplicate reads (count > 8 for the mutant and count > 256 for the control) were filtered out. Aneuploidies were found in a small subset of mutants but were corrected by downsampling the reads in the duplicated chromosomes. When quantifying chromatin differences between a mutant and the control, reads were subsampled in the mutant to have the same distribution of fragment lengths as the control.
Visualizing MNase-seq data
To visualize our MNase-seq data at various genomic loci, read fragment midpoints were plotted and colored by density. Gene coordinates were plotted using data obtained from the Saccharomyces Genome Database (SGD) (Cherry et al. 2012). Plotting was done using the R packages ggplot2 (Wickham 2016) and patchwork (https://github.com/thomasp85/patchwork).
Selecting a gene set
To select a set of yeast genes we could analyze robustly and consistently, we filtered the list of ORFs from the SGD based on the following two criteria: (1) genes must have MNase-seq read coverage of at least 70% within the ORF and (2) genes must have a length of at least 500 bp. This resulted in a set of 4940 genes for downstream analysis.
Calculating overall chromatin change
To summarize the overall chromatin change at a particular gene locus, the JS divergence (Menéndez et al. 1997) was calculated between every mutant and the baseline control in windows 250 bp upstream of the TSS to 500 bp downstream from the TSS at that locus. Raw MNase-seq fragment positions and lengths were smoothed into matrices and normalized into 2D probability distributions, and the JS divergence was calculated using the jensen_shannon() function in the Philentropy package in R (Drost 2018). Briefly, the JS divergence is defined as follows:
Determining cutoffs for significant chromatin changes
To determine a cutoff for significant chromatin interactions in our data when comparing with gene expression, we applied a threshold based on a Laplacian probability density function of the form
Calling nucleosome positions
Nucleosome dyad positions were established by calling peaks in the nucleosome occupancy signal within the MNase-seq baseline control data. Nucleosome-sized fragments (140–200 bp) were selected. The nucleosome occupancy signal was smoothed with a running mean of 50 bp, and peaks were called with a minimum distance of 40 bp between two peaks.
Calculating nucleosome occupancy
We considered the windows 250 bp upstream of and 500 bp downstream from every TSS to represent the nucleosome occupancy at the promoter and at the first three nucleosomes within a gene body, respectively. Nucleosome-sized fragments (140–200 bp) were selected from each MNase-seq sample. Fragment counts were summed within ±40 bp segments around nucleosome peaks (see previous section) within the entire window. We computed the nucleosome occupancy change between every mutant and the control by taking the log2(FC) in nucleosome occupancy (mutant/control).
Calculating nucleosome disorganization
We defined the level of nucleosome disorganization to be the Shannon entropy of the nucleosome-sized fragments in a 750 bp window surrounding every gene's TSS (250 bp upstream and 500 bp downstream). Nucleosome entropies for each gene in every mutant were calculated using the “entropy” package in R (Hausser and Strimmer 2009). The total change in nucleosome disorganization between the mutant and control is defined as the log2(FC) in entropy (mutant/control).
Calculating TF occupancy in promoters and identifying TF binding sites
We considered the window 250 bp upstream of each TSS to represent that gene's promoter. TF-sized fragments (40–100 bp) were selected from each MNase-seq sample. Fragment counts were summed in each promoter window, and the TF occupancy change between every mutant and the control was calculated as the log2(FC) in nucleosome occupancy (mutant/control). Motif-specific TF occupancies were calculated based on a 50 bp window centered on every motif midpoint identified by FIMO with default parameters (Grant et al. 2011) and motifs obtained from the JASPAR database (Castro-Mondragon et al. 2022).
We created a list of potential sites of TF binding by taking the union of three sources of information: the published binding sites of MacIsaac et al. (2006), the published binding sites of Rossi et al. (2021), and sites identified using FIMO with default parameters (Grant et al. 2011) and motifs obtained from the JASPAR database (Castro-Mondragon et al. 2022).
Obtaining reported transcription rates and mutant gene expression data
Basal transcription rates were obtained from NET-seq data as reported by Churchman and Weissman (2011). We obtained the mutant gene expression data set collected by Kemmeren et al. (2014) and calculated normalized log2(FC) values for each mutant reported in their paper. In total, 191 mutants from their data set overlapped with mutants in our data set. Additionally, we verified gene expression data in the GAL80 mutant ourselves using RNA-seq (Supplemental Fig. S6C,D).
Computing functional enrichment
We computed GO enrichment using the enrichGO() function from the clusterProfiler package in R (Yu et al. 2012; Wu et al. 2021). GO terms were selected from the biological pathways database, and P-values were corrected using the Benjamini–Hochberg method. Highly similar GO terms were condensed by their semantic similarity using the simplify() function from clusterProfiler.
Predicting expression using regression models
We fit a linear regression model using ordinary least squares regression on chromatin features from our MNase-seq data to predict gene expression changes as a result of genetic perturbations. The model is as follows:
Software tools and packages
Data analysis was performed in R version 4.1.1 using RStudio (R Core Team 2024). All R packages used can be found in the code scripts (see “Data access” section). Schematics in Figures 1 and 2 were created with bioRender (https://www.biorender.com).
Data access
All raw and processed sequencing data generated in this study have been submitted to the NCBI Gene Expression Omnibus (GEO; https://www.ncbi.nlm.nih.gov/geo/) under accession number GSE263367. Code to reproduce all analyses and figures is available on GitHub (https://github.com/HarteminkLab/Moyung_2025_YeastDeletion) and as Supplemental Code.
Competing interest statement
The authors declare no competing interests.
Acknowledgments
We thank current and former members of the MacAlpine laboratory and Hartemink group for critical comments and suggestions throughout the entirety of the project. K.M., H.K.M., and D.M.M. were supported by the National Institutes of Health (NIH) grant R35-GM127062, and Y.L. and A.J.H. were supported by NIH grants R01-GM118551 and R35-GM141795. Our analysis made use of a high-performance computing facility partially supported by grants 2016-IDG-1013 (“HARDAC+: reproducible HPC for next-generation genomics”) and 2020-IIG-2109 (“HARDAC-M: enabling memory-intensive computation for genomics”) from the North Carolina Biotechnology Center.
Author contributions: Y.L., D.M.M., and A.J.H. designed the study. Y.L. and H.K.M. performed the experiments. K.M. performed the data analysis and wrote the manuscript. D.M.M. and A.J.H. advised on data analysis and edited the manuscript.
Notes
[1] Supplementary material [Supplemental material is available for this article.]
[2] Article published online before print. Article, supplemental material, and publication date are at https://www.genome.org/cgi/doi/10.1101/gr.279637.124.
References
- ↵Arndt KT, Styles C, Fink GR. 1987. Multiple global regulators control HIS4 transcription in yeast. Science 237: 874–880. 10.1126/science.3303332
- ↵Arzate-Mejia RG, Mansuy IM. 2023. Remembering through the genome: the role of chromatin states in brain functions and diseases. Transl Psychiatry 13: 122. 10.1038/s41398-023-02415-4
- ↵Bäurle I. 2018. Can't remember to forget you: chromatin-based priming of somatic stress responses. Semin Cell Dev Biol 83: 133–139. 10.1016/j.semcdb.2017.09.032
- ↵Belsky JA, MacAlpine HK, Lubelsky Y, Hartemink AJ, MacAlpine DM. 2015. Genome-wide chromatin footprinting reveals changes in replication origin architecture induced by pre-RC assembly. Genes Dev 29: 212–224. 10.1101/gad.247924.114
- ↵Birrell GW, Brown JA, Wu HI, Giaever G, Chu AM, Davis RW, Brown JM. 2002. Transcriptional response of Saccharomyces cerevisiae to DNA-damaging agents does not identify the genes that protect against these agents. Proc Natl Acad Sci 99: 8778–8783. 10.1073/pnas.132275199
- ↵Borell CW, Urrestarazu LA, Bhattacharjee JK. 1984. Two unlinked lysine genes (LYS9 and LYS14) are required for the synthesis of saccharopine reductase in Saccharomyces cerevisiae. J Bacteriol 159: 429–432. 10.1128/jb.159.1.429-432.1984
- ↵Brennan KJ, Weilert M, Krueger S, Pampari A, Liu H-Y, Yang AWH, Morrison JA, Hughes TR, Rushlow CA, Kundaje A, 2023. Chromatin accessibility in the Drosophila embryo is determined by transcription factor pioneering and enhancer activation. Dev Cell 58: 1898–1916.e9. 10.1016/j.devcel.2023.07.007
- ↵Carroll AS, O'Shea EK. 2002. Pho85 and signaling environmental conditions. Trends Biochem Sci 27: 87–93. 10.1016/S0968-0004(01)02040-0
- ↵Castro-Mondragon JA, Riudavets-Puig R, Rauluseviciute I, Lemma RB, Turchi L, Blanc-Mathieu R, Lucas J, Boddie P, Khan A, Manosalva Pérez N, 2022. JASPAR 2022: the ninth release of the open-access database of transcription factor binding profiles. Nucleic Acids Res 50: D165–D173. 10.1093/nar/gkab1113
- ↵Chang C-Y, Huang W-P. 2007. Atg19 mediates a dual interaction cargo sorting mechanism in selective autophagy. Mol Biol Cell 18: 919–929. 10.1091/mbc.e06-08-0683
- ↵Cherry JM, Hong EL, Amundsen C, Balakrishnan R, Binkley G, Chan ET, Christie KR, Costanzo MC, Dwight SS, Engel SR, 2012. Saccharomyces genome database: the genomics resource of budding yeast. Nucleic Acids Res 40: D700–D705. 10.1093/nar/gkr1029
- ↵Chua G, Morris QD, Sopko R, Robinson MD, Ryan O, Chan ET, Frey BJ, Andrews BJ, Boone C, Hughes TR. 2006. Identifying transcription factor functions and targets by phenotypic activation. Proc Natl Acad Sci 103: 12045–12050. 10.1073/pnas.0605140103
- ↵Churchman LS, Weissman JS. 2011. Nascent transcript sequencing visualizes transcription at nucleotide resolution. Nature 469: 368–373. 10.1038/nature09652
- ↵Deshpande AP, Patel SS. 2012. Mechanism of transcription initiation by the yeast mitochondrial RNA polymerase. Biochim Biophys Acta 1819: 930–938. 10.1016/j.bbagrm.2012.02.003
- ↵Donovan BT, Chen H, Jipa C, Bai L, Poirier MG. 2019. Dissociation rate compensation mechanism for budding yeast pioneer transcription factors. eLife 8: e43008. 10.7554/eLife.43008
- ↵Drost H-G. 2018. Philentropy: information theory and distance quantification with R. J Open Source Softw 3: 765. 10.21105/joss.00765
- ↵Edmondson DG, Roth SY. 1996. Chromatin and transcription. FASEB J 10: 1173–1182. 10.1096/fasebj.10.10.8751719
- ↵Feller A, Dubois E, Ramos F, Piérard A. 1994. Repression of the genes for lysine biosynthesis in Saccharomyces cerevisiae is caused by limitation of Lys14-dependent transcriptional activation. Mol Cell Biol 14: 6411–6418. 10.1128/MCB.14.10.6411
- ↵Fuglede B, Topsoe F. 2004. Jensen-Shannon divergence and Hilbert space embedding. In Proceedings of the 2004 International Symposium on Information Theory (ISIT 2004), Chicago, p. 31. IEEE, Piscataway, NJ.
- ↵Giaever G, Nislow C. 2014. The yeast deletion collection: a decade of functional genomics. Genetics 197: 451–465. 10.1534/genetics.114.161620
- ↵Giaever G, Chu AM, Ni L, Connelly C, Riles L, Véronneau S, Dow S, Lucau-Danila A, Anderson K, André B, 2002. Functional profiling of the Saccharomyces cerevisiae genome. Nature 418: 387–391. 10.1038/nature00935
- ↵Grant CE, Bailey TL, Noble WS. 2011. FIMO: scanning for occurrences of a given motif. Bioinformatics 27: 1017–1018. 10.1093/bioinformatics/btr064
- ↵Hainer SJ, Pruneski JA, Mitchell RD, Monteverde RM, Martens JA. 2011. Intergenic transcription causes repression by directing nucleosome assembly. Genes Dev 25: 29–40. 10.1101/gad.1975011
- ↵Hausser J, Strimmer K. 2009. Entropy inference and the James-Stein estimator, with application to nonlinear gene association networks. J Mach Learn Res 10: 1469–1484.
- ↵Henikoff JG, Belsky JA, Krassovsky K, MacAlpine DM, Henikoff S. 2011. Epigenome characterization at single base-pair resolution. Proc Natl Acad Sci 108: 18318–18323. 10.1073/pnas.1110731108
- ↵Høvring I, Bostad A, Ording E, Myrset AH, Gabrielsen OS. 1994. DNA-binding domain and recognition sequence of the yeast BAS1 protein, a divergent member of the Myb family of transcription factors. J Biol Chem 269: 17663–17669. 10.1016/S0021-9258(17)32492-4
- ↵Hu Z, Killion PJ, Iyer VR. 2007. Genetic reconstruction of a functional transcriptional regulatory network. Nat Genet 39: 683–687. 10.1038/ng2012
- ↵Huang D, Friesen H, Andrews B. 2007. Pho85, a multifunctional cyclin-dependent protein kinase in budding yeast. Mol Microbiol 66: 303–314. 10.1111/j.1365-2958.2007.05914.x
- ↵Hübner MR, Eckersley-Maslin MA, Spector DL. 2013. Chromatin organization and transcriptional regulation. Curr Opin Genet Dev 23: 89–95. 10.1016/j.gde.2012.11.006
- ↵Hughes TR, de Boer CG. 2013. Mapping yeast transcriptional networks. Genetics 195: 9–36. 10.1534/genetics.113.153262
- ↵Jackson CA, Castro DM, Saldi G-A, Bonneau R, Gresham D. 2020. Gene regulatory network reconstruction using single-cell RNA sequencing of barcoded genotypes in diverse environments. eLife 9: e51254. 10.7554/eLife.51254
- ↵Jiang C, Pugh BF. 2009. Nucleosome positioning and gene regulation: advances through genomics. Nat Rev Genet 10: 161–172. 10.1038/nrg2522
- ↵John S, Sabo PJ, Thurman RE, Sung M-H, Biddie SC, Johnson TA, Hager GL, Stamatoyannopoulos JA. 2011. Chromatin accessibility pre-determines glucocorticoid receptor binding patterns. Nat Genet 43: 264–268. 10.1038/ng.759
- ↵Johnson DS, Mortazavi A, Myers RM, Wold B. 2007. Genome-wide mapping of in vivo protein-DNA interactions. Science 316: 1497–1502. 10.1126/science.1141319
- ↵Kaplan N, Moore IK, Fondufe-Mittendorf Y, Gossett AJ, Tillo D, Field Y, LeProust EM, Hughes TR, Lieb JD, Widom J, 2009. The DNA-encoded nucleosome organization of a eukaryotic genome. Nature 458: 362–366. 10.1038/nature07667
- ↵Kemmeren P, Sameith K, van de Pasch LAL, Benschop JJ, Lenstra TL, Margaritis T, O'Duibhir E, Apweiler E, van Wageningen S, Ko CW, 2014. Large-scale genetic perturbations reveal regulatory networks and an abundance of gene-specific repressors. Cell 157: 740–752. 10.1016/j.cell.2014.02.054
- ↵Kent NA, Adams S, Moorhouse A, Paszkiewicz K. 2011. Chromatin particle spectrum analysis: a method for comparative chromatin structure analysis using paired-end mode next-generation DNA sequencing. Nucleic Acids Res 39: e26. 10.1093/nar/gkq1183
- ↵Kiani K, Sanford EM, Goyal Y, Raj A. 2022. Changes in chromatin accessibility are not concordant with transcriptional changes for single-factor perturbations. Mol Syst Biol 18: e10979. 10.15252/msb.202210979
- ↵Kim J, Klionsky DJ. 2000. Autophagy, cytoplasm-to-vacuole targeting pathway, and pexophagy in yeast and mammalian cells. Annu Rev Biochem 69: 303–342. 10.1146/annurev.biochem.69.1.303
- ↵Klionsky DJ, Cregg JM, Dunn WA, Emr SD, Sakai Y, Sandoval IV, Sibirny A, Subramani S, Thumm M, Veenhuis M, 2003. A unified nomenclature for yeast autophagy-related genes. Dev Cell 5: 539–545. 10.1016/S1534-5807(03)00296-X
- ↵Krogan NJ, Cagney G, Yu H, Zhong G, Guo X, Ignatchenko A, Li J, Pu S, Datta N, Tikuisis AP, 2006. Global landscape of protein complexes in the yeast Saccharomyces cerevisiae. Nature 440: 637–643. 10.1038/nature04670
- ↵Lai WKM, Pugh BF. 2017. Understanding nucleosome dynamics and their links to gene expression and DNA replication. Nat Rev Mol Cell Biol 18: 548–562. 10.1038/nrm.2017.47
- ↵Langmead B. 2010. Aligning short sequencing reads with Bowtie. Curr Protoc Bioinformatics Chapter 11: Unit 11.7. 10.1002/0471250953.bi1107s32
- ↵Lee TI, Rinaldi NJ, Robert F, Odom DT, Bar-Joseph Z, Gerber GK, Hannett NM, Harbison CT, Thompson CM, Simon I, 2002. Transcriptional regulatory networks in Saccharomyces cerevisiae. Science 298: 799–804. 10.1126/science.1075090
- ↵Lenstra TL, Benschop JJ, Kim T, Schulze JM, Brabers NACH, Margaritis T, van de Pasch LAL, van Heesch SAAC, Brok MO, Groot Koerkamp MJA, 2011. The specificity and topology of chromatin interaction pathways in yeast. Mol Cell 42: 536–549. 10.1016/j.molcel.2011.03.026
- ↵Li B, Carey M, Workman JL. 2007. The role of chromatin during transcription. Cell 128: 707–719. 10.1016/j.cell.2007.01.015
- ↵Li H, Handsaker B, Wysoker A, Fennell T, Ruan J, Homer N, Marth G, Abecasis G, Durbin R, 1000 Genome Project Data Processing Subgroup. 2009. The Sequence Alignment/Map format and SAMtools. Bioinformatics 25: 2078–2079. 10.1093/bioinformatics/btp352
- ↵Li H, Sun Y, Hong H, Huang X, Tao H, Huang Q, Wang L, Xu K, Gan J, Chen H, 2022. Inferring transcription factor regulatory networks from single-cell ATAC-seq data based on graph neural networks. Nat Mach Intell 4: 389–400. 10.1038/s42256-022-00469-5
- ↵Lin J. 1991. Divergence measures based on the Shannon entropy. IEEE Trans Inf Theory 37: 145–151. 10.1109/18.61115
- ↵Lohr D, Hopper JE. 1985. The relationship of regulatory proteins and DNase I hypersensitive sites in the yeast GAL1-10 genes. Nucleic Acids Res 13: 8409–8423. 10.1093/nar/13.23.8409
- ↵Lohr D, Venkov P, Zlatanova J. 1995. Transcriptional regulation in the yeast GAL gene family: a complex genetic network. FASEB J 9: 777–787. 10.1096/fasebj.9.9.7601342
- ↵Lowe EK, Cuomo C, Voronov D, Arnone MI. 2019. Using ATAC-seq and RNA-seq to increase resolution in GRN connectivity. Methods Cell Biol 151: 115–126. 10.1016/bs.mcb.2018.11.001
- ↵MacIsaac KD, Wang T, Gordon DB, Gifford DK, Stormo GD, Fraenkel E. 2006. An improved map of conserved regulatory sites for Saccharomyces cerevisiae. BMC Bioinformatics 7: 113. 10.1186/1471-2105-7-113
- ↵Marr LT, Ocampo J, Clark DJ, Hayes JJ. 2021. Global histone protein surface accessibility in yeast indicates a uniformly loosely packed genome with canonical nucleosomes. Epigenetics Chromatin 14: 5. 10.1186/s13072-020-00381-5
- ↵Martin V, Zhuang F, Zhang Y, Pinheiro K, Gordân R. 2023. High-throughput data and modeling reveal insights into the mechanisms of cooperative DNA-binding by transcription factor proteins. Nucleic Acids Res 51: 11600–11612. 10.1093/nar/gkad872
- ↵McIsaac RS, Petti AA, Bussemaker HJ, Botstein D. 2012. Perturbation-based analysis and modeling of combinatorial regulation in the yeast sulfur assimilation pathway. Mol Biol Cell 23: 2993–3007. 10.1091/mbc.e12-03-0232
- ↵Menéndez ML, Pardo JA, Pardo L, Pardo MC. 1997. The Jensen-Shannon divergence. J Franklin Inst 334: 307–318. 10.1016/S0016-0032(96)00063-4
- ↵Messenguy F, Dubois E. 1983. Participation of transcriptional and post-transcriptional regulatory mechanisms in the control of arginine metabolism in yeast. Mol Gen Genet 189: 148–156. 10.1007/BF00326068
- ↵Messner CB, Demichev V, Muenzner J, Aulakh SK, Barthel N, Röhl A, Herrera-Domínguez L, Egger A-S, Kamrad S, Hou J, 2023. The proteomic landscape of genome-wide genetic perturbations. Cell 186: 2018–2034.e21. 10.1016/j.cell.2023.03.026
- ↵Minnoye L, Marinov GK, Krausgruber T, Pan L, Marand AP, Secchia S, Greenleaf WJ, Furlong EEM, Zhao K, Schmitz RJ, 2021. Chromatin accessibility profiling methods. Nat Rev Methods Primers 1: 10. 10.1038/s43586-020-00008-9
- ↵Miraldi ER, Pokrovskii M, Watters A, Castro DM, De Veaux N, Hall JA, Lee J-Y, Ciofani M, Madar A, Carriero N, 2019. Leveraging chromatin accessibility for transcriptional regulatory network inference in T helper 17 cells. Genome Res 29: 449–463. 10.1101/gr.238253.118
- ↵Mülleder M, Calvani E, Alam MT, Wang RK, Eckerstorfer F, Zelezniak A, Ralser M. 2016. Functional metabolomics describes the yeast biosynthetic regulome. Cell 167: 553–565.e12. 10.1016/j.cell.2016.09.007
- ↵Ordway AJ, Helt RN, Johnston RJJr. 2024. Transcriptional priming and chromatin regulation during stochastic cell fate specification. Philos Trans R Soc Lond B Biol Sci 379: 20230046. 10.1098/rstb.2023.0046
- ↵Petti AA, McIsaac RS, Ho-Shing O, Bussemaker HJ, Botstein D. 2012. Combinatorial control of diverse metabolic and physiological functions by transcriptional regulators of the yeast sulfur assimilation pathway. Mol Biol Cell 23: 3008–3024. 10.1091/mbc.e12-03-0233
- ↵Platt A, Reece RJ. 1998. The yeast galactose genetic switch is mediated by the formation of a Gal4p-Gal80p-Gal3p complex. EMBO J 17: 4086–4091. 10.1093/emboj/17.14.4086
- ↵Pranzatelli TJF, Michael DG, Chiorini JA. 2018. ATAC2GRN: optimized ATAC-seq and DNase1-seq pipelines for rapid and accurate genome regulatory network inference. BMC Genomics 19: 563. 10.1186/s12864-018-4943-z
- ↵Ramos F, Dubois E, Piérard A. 1988. Control of enzyme synthesis in the lysine biosynthetic pathway of Saccharomyces cerevisiae: evidence for a regulatory role of gene LYS14. Eur J Biochem 171: 171–176. 10.1111/j.1432-1033.1988.tb13773.x
- ↵Rando OJ, Winston F. 2012. Chromatin and transcription in yeast. Genetics 190: 351–387. 10.1534/genetics.111.132266
- ↵R Core Team. 2024. R: a language and environment for statistical computing. R Foundation for Statistical Computing, Vienna. https://www.R-project.org/.
- ↵Rossi MJ, Kuntala PK, Lai WKM, Yamada N, Badjatia N, Mittal C, Kuzu G, Bocklund K, Farrell NP, Blanda TR, 2021. A high-resolution protein architecture of the budding yeast genome. Nature 592: 309–314. 10.1038/s41586-021-03314-8
- ↵Schmid A, Fascher KD, Hörz W. 1992. Nucleosome disruption at the yeast PHO5 promoter upon PHO5 induction occurs in the absence of DNA replication. Cell 71: 853–864. 10.1016/0092-8674(92)90560-Y
- ↵Segal E, Widom J. 2009. What controls nucleosome positions? Trends Genet 25: 335–343. 10.1016/j.tig.2009.06.002
- ↵Segal E, Fondufe-Mittendorf Y, Chen L, Thåström A, Field Y, Moore IK, Wang J-PZ, Widom J. 2006. A genomic code for nucleosome positioning. Nature 442: 772–778. 10.1038/nature04979
- ↵Shakoury-Elizeh M, Protchenko O, Berger A, Cox J, Gable K, Dunn TM, Prinz WA, Bard M, Philpott CC. 2010. Metabolic response to iron deficiency in Saccharomyces cerevisiae. J Biol Chem 285: 14823–14833. 10.1074/jbc.M109.091710
- ↵Shearwin KE, Callen BP, Egan JB. 2005. Transcriptional interference: a crash course. Trends Genet 21: 339–345. 10.1016/j.tig.2005.04.009
- ↵Shivaswamy S, Bhinge A, Zhao Y, Jones S, Hirst M, Iyer VR. 2008. Dynamic remodeling of individual nucleosomes across a eukaryotic genome in response to transcriptional perturbation. PLoS Biol 6: e65. 10.1371/journal.pbio.0060065
- ↵Sidorova J, Breeden L. 1993. Analysis of the SWI4/SWI6 protein complex, which directs G1/S-specific transcription in Saccharomyces cerevisiae. Mol Cell Biol 13: 1069–1077. 10.1128/mcb.13.2.1069-1077.1993
- ↵Snyder LF, O’Brien EM, Zhao J, Liang J, Bruce BJ, Zhang Y, Zhu W, Cassier TH, Schnicker NJ, Zhou X, et al. 2025. Divergence in a eukaryotic transcription factor's co-TF dependence involves multiple intrinsically disordered regions. Nat Commun 16: 5340. 10.1038/s41467-025-59244-w
- ↵Struhl K. 1987. Promoters, activator proteins, and the mechanism of transcriptional initiation in yeast. Cell 49: 295–297. 10.1016/0092-8674(87)90277-7
- ↵Struhl K, Segal E. 2013. Determinants of nucleosome positioning. Nat Struct Mol Biol 20: 267–273. 10.1038/nsmb.2506
- ↵Toenhake CG, Fraschka SA-K, Vijayabaskar MS, Westhead DR, van Heeringen SJ, Bártfai R. 2018. Chromatin accessibility-based characterization of the gene regulatory network underlying plasmodium falciparum blood-stage development. Cell Host Microbe 23: 557–569.e9. 10.1016/j.chom.2018.03.007
- ↵Toh-e A, Tanaka K, Uesono Y, Wickner RB. 1988. PHO85, a negative regulator of the PHO system, is a homolog of the protein kinase gene, CDC28, of Saccharomyces cerevisiae. Mol Gen Genet 214: 162–164. 10.1007/BF00340196
- ↵Torchia TE, Hamilton RW, Cano CL, Hopper JE. 1984. Disruption of regulatory gene GAL80 in Saccharomyces cerevisiae: effects on carbon-controlled regulation of the galactose/melibiose pathway genes. Mol Cell Biol 4: 1521–1527. 10.1128/mcb.4.8.1521-1527.1984
- ↵Tran TQ, MacAlpine HK, Tripuraneni V, Mitra S, MacAlpine DM, Hartemink AJ. 2021. Linking the dynamics of chromatin occupancy and transcription with predictive models. Genome Res 31: 1035–1046. 10.1101/gr.267237.120
- ↵Urnov FD. 2003. Chromatin remodeling as a guide to transcriptional regulatory networks in mammals. J Cell Biochem 88: 684–694. 10.1002/jcb.10397
- ↵van Bakel H, Tsui K, Gebbia M, Mnaimneh S, Hughes TR, Nislow C. 2013. A compendium of nucleosome and transcript profiles reveals determinants of chromatin architecture and transcription. PLoS Genet 9: e1003479. 10.1371/journal.pgen.1003479
- ↵van Steensel B, Furlong EEM. 2019. The role of transcription in shaping the spatial organization of the genome. Nat Rev Mol Cell Biol 20: 327–337. 10.1038/s41580-019-0114-6
- ↵Wach A, Brachat A, Pöhlmann R, Philippsen P. 1994. New heterologous modules for classical or PCR-based gene disruptions in Saccharomyces cerevisiae. Yeast 10: 1793–1808. 10.1002/yea.320101310
- ↵Wal M, Pugh BF. 2012. Chapter ten - genome-wide mapping of nucleosome positions in yeast using high-resolution MNase ChIP-seq. In Methods in enzymology (ed. Wu C, Allis CD), Vol. 513, pp. 233–250. Academic Press, San Diego.
- ↵Weiner A, Chen HV, Liu CL, Rahat A, Klien A, Soares L, Gudipati M, Pfeffner J, Regev A, Buratowski S, 2012. Systematic dissection of roles for chromatin regulators in a yeast stress response. PLoS Biol 10: e1001369. 10.1371/journal.pbio.1001369
- ↵Wickham H. 2016. ggplot2: elegant graphics for data analysis. Springer, Cham, Switzerland. 10.1007/978-3-319-24277-4
- ↵Wu T, Hu E, Xu S, Chen M, Guo P, Dai Z, Feng T, Zhou L, Tang W, Zhan L, 2021. clusterProfiler 4.0: a universal enrichment tool for interpreting omics data. Innovation (Camb) 2: 100141. 10.1016/j.xinn.2021.100141
- ↵Yu G, Wang L-G, Han Y, He Q-Y. 2012. clusterProfiler: an R package for comparing biological themes among gene clusters. OMICS 16: 284–287. 10.1089/omi.2011.0118
- ↵Yu X, Martin PGP, Michaels SD. 2019. BORDER proteins protect expression of neighboring genes by promoting 3′ Pol II pausing in plants. Nat Commun 10: 4359. 10.1038/s41467-019-12328-w
- ↵Zaret KS. 2020. Pioneer transcription factors initiating gene network changes. Annu Rev Genet 54: 367–385. 10.1146/annurev-genet-030220-015007
- ↵Zelezniak A, Vowinckel J, Capuano F, Messner CB, Demichev V, Polowsky N, Mülleder M, Kamrad S, Klaus B, Keller MA, 2018. Machine learning predicts the yeast metabolome from the quantitative proteome of kinase knockouts. Cell Syst 7: 269–283.e6. 10.1016/j.cels.2018.08.001
- ↵Zhang Y, Ho TD, Buchler NE, Gordân R. 2021. Competition for DNA binding between paralogous transcription factors determines their genomic occupancy and regulatory functions. Genome Res 31: 1216–1229. 10.1101/gr.275145.120
- ↵Zhong J, Luo K, Winter PS, Crawford GE, Iversen ES, Hartemink AJ. 2016. Mapping nucleosome positions using DNase-seq. Genome Res 26: 351–364. 10.1101/gr.195602.115