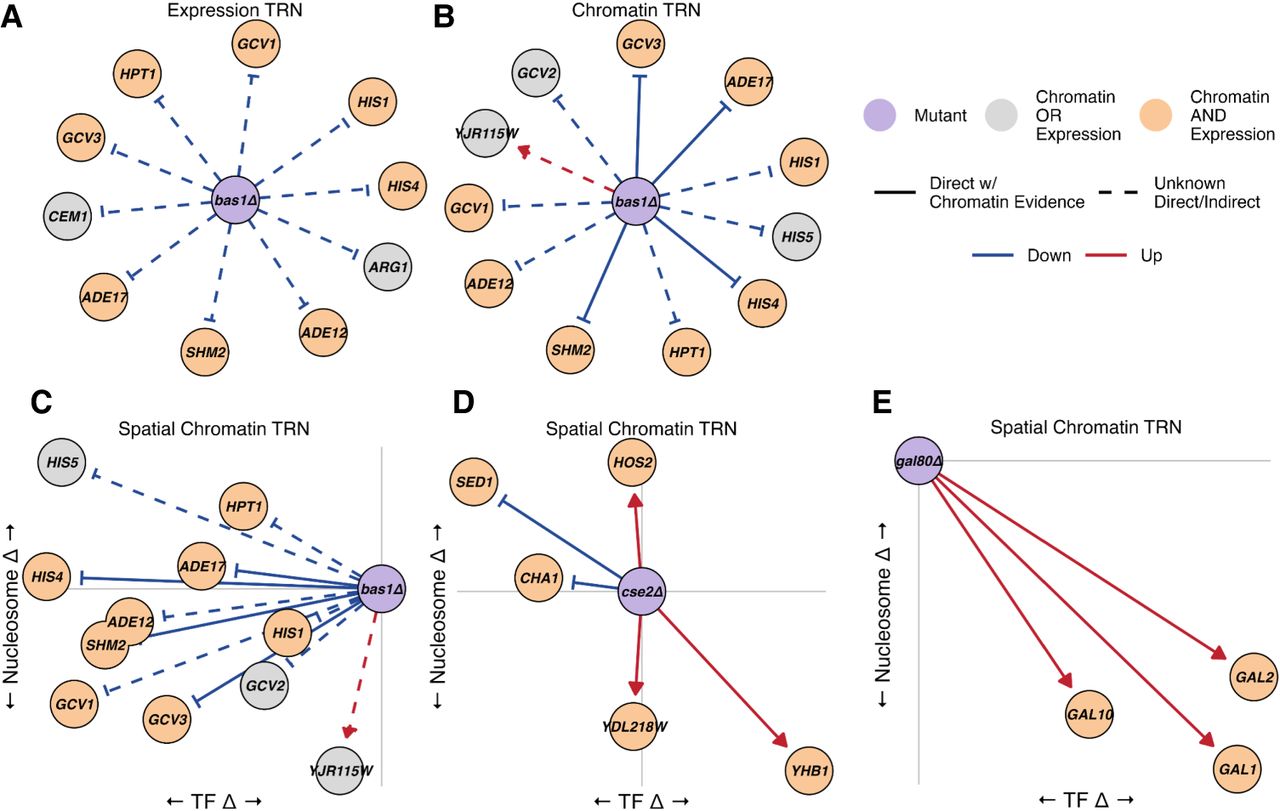
Chromatin dynamics from genetic perturbations recapitulate transcriptional regulatory networks (TRNs). (A) TRN based on gene expression as a result of deleting BAS1 (|log2(FC)| > 0.85). Colored edges represent upregulation (red) or downregulation (blue). Edges representing direct or indirect effects are denoted solid or dashed, respectively. The central node representing the mutant is colored purple; target genes are orange if they are significantly changed in both their chromatin and expression or are gray if they are only significantly changed in one of the two. (B) TRN reconstructed based on chromatin information alone. Colored edges represent predicted up/downregulation from chromatin features. (C) Chromatin TRN of bas1Δ with a spatial layout based on the mechanistic context of TF and nucleosome changes. A node's position left or right of the mutant node represents loss or gain in TF occupancy, and its position below or above the mutant node represents loss or gain in nucleosome occupancy, respectively. (D) Spatial chromatin TRN of cse2Δ. (E) Spatial chromatin TRN of gal80Δ.