
A High-Resolution Microsatellite Map of the Mouse Genome
- Michael Rhodes1,
- Richard Straw1,
- Supem Fernando1,
- Andrew Evans1,
- Tregaye Lacey1,
- Andrew Dearlove1,
- John Greystrong1,
- Joanne Walker1,
- Paula Watson1,
- Paul Weston1,
- Maria Kelly1,
- Dilip Taylor1,
- Keith Gibson1,
- Chris Mundy1,
- Franck Bourgade2,
- Christophe Poirier2,
- Dominique Simon2,
- Ana Lucia Bueno Brunialti2,
- Xavier Montagutelli2,
- Jean-Louis Gu′enet2,
- Andy Haynes3, and
- Steve D.M. Brown3,4,5
Abstract
The European Collaborative Interspecific Backcross (EUCIB) resource was constructed for the purposes of high-resolution genetic mapping of the mouse genome (Breen et al. 1994). The large Mus spretus/C57BL/6 backcross of 982 progeny has a genetic resolution of 0.3 cM at the 95% confidence level (∼500 kb in the mouse genome). We have used the EUCIB mapping resource to develop a genome-wide high-resolution genetic map incorporating 3368 microsatellites. The microsatellites are distributed among 2302 genetically separated bins with 1.46 markers per bin on average. Average bin separation is 0.61 cM. This high-resolution genetic map will aid the construction of a robust physical map of the mouse genome.
The mouse is a pivotal model organism for the genome program and with its battery of mutagenic, transgenic, and developmental biology approaches is set to play a key role as mammalian genetics moves from genomics to studies of gene function (Copeland et al. 1993; Dietrich et al. 1995; Brown and Peters 1996). The development of genetic and physical maps in the mouse is an important step toward providing the genome resources for future gene function studies (Dietrich et al. 1995). The construction of a high density map of mouse simple-sequence polymorphisms at intermediate resolution is complete (Dietrich et al. 1996). The future development of genome-wide physical maps (Hudson et al. 1996) will assist gene mapping as well as providing the clone resources for gene identification. In addition, the map will provide the substrates for preparing sequence-ready maps for comparative sequencing, which will itself speed the process of gene identification. Physical maps will also underpin the development of comprehensive, high-resolution gene maps (Schuler et al. 1996) that can be used for the characterization of mouse mutations and provide a new cache of gene sequences that can be related to loci on the human genome by the conserved linkage groups identified between the two species (Copeland et al. 1993; Andersson et al. 1996). Nevertheless, there are no complete physical maps yet available for any mouse chromosome. The development of a high-resolution genetic map can enhance the production of a robust physical map on any mouse chromosome.
The ability to undertake large genetic crosses between defined mouse strains means the construction of high-resolution genetic maps can be readily achieved. Most notably, large interspecific or intersubspecific backcrosses between laboratory strains of mice and wild species such asMus spretus or Mus castaneus (Avner et al. 1988) has transformed mouse genetic mapping (for review, see Copeland et al. 1993). Large numbers of backcross progeny can be readily derived from such crosses providing the requisite numbers of meioses to achieve high genetic resolution. Additionally, the use of crosses between relatively diverged species contributes to the large numbers of markers that are variant between the parental strains. Approximately 90% of microsatellites show size variation between laboratory strains and the wild species, M. spretus and M. castaneus (Dietrich et al. 1992). Small intersubspecific crosses have been used for the construction of genome-wide gene or microsatellite maps at intermediate resolution (Dietrich et al. 1996; see above). Large interspecific backcrosses of a 1000 progeny or more carrying a specific mutation of interest have been used widely for high-resolution genetic mapping of the mutant locus as a route to positional cloning of the gene (Brown 1994, 1996). However, to date there has been no systematic attempt to use the high resolution afforded by large interspecific backcrosses to construct genome-wide high-resolution maps.
Recently, we reported the construction of a high-resolution mouse mapping resource consisting of an interspecific backcross of nearly 1000 progeny (Breen et al. 1994). A backcross of this size has a genetic resolution of 0.3 cM at the 95% confidence level that equates to ∼600 kb in the mouse genome. We have now used this backcross to construct a high-resolution and high-density microsatellite map of the mouse genome. This high-resolution genetic map will be the anchor for the construction of a high integrity physical map of the mouse genome.
RESULTS
Identification of Panels of Recombinants from EUCIB for High-Resolution Mapping
We have described the construction of a large interspecific backcross between C57BL/6 and Mus spretus—the European Collaborative Interspecific Backcross (EUCIB)—comprising 982 backcross progeny. Backcross progeny were initially typed for 78 primary anchor loci spanning the entire genome with 3–6 anchors per chromosome (Breen et al. 1994). Subsequently, a number of additional anchor markers were added. Where it became apparent from further mapping studies that the proximal and distal anchors available on a particular chromosome did not represent either the most centromeric or telomeric markers, additional anchors were added for the mapping of markers close to the centromere and telomere. The anchor map identifies the great majority of backcross progeny mice recombinant in any interanchor interval (excluding only those rare individuals that have double interanchor recombinants) and provides panels of mice for high-resolution mapping in each interanchor chromosome region. In total, 93 primary anchors were assigned (see Table 1). Subsequently, a large number of secondary anchors (principally microsatellite markers) were added to the map reducing the size of recombinant panels still further and allowing for rapid high-resolution mapping of markers in any chromosome region. Final interanchor intervals comprised panels of ∼36 recombinant mice on average and thus corresponded to a genetic interval of ∼4 cm.
Summary of Markers and Map Statistics by Chromosome
Mapping Microsatellites at High-Resolution on the EUCIB Backcross
To develop the high resolution genetic map, a large number of microsatellites markers from the Whitehead/MIT map (Dietrich et al. 1996) were analyzed through the EUCIB backcross. The bulk of microsatellite mapping used a novel, high-throughput and semiautomated fluorescent dUTP genotyping approach (Rhodes et al. 1997)—2278 of the total of 3368 were added to the map by this approach. The remainder were mapped either by use of standard agarose gel electrophoresis or alternatively with an enhanced chemiluminescence approach (Vignal et al. 1993). Following the determination of the parental allele sizes (C57BL/6 and M. spretus), the appropriate recombinant panel of mice was genotyped. Given the limited resolution afforded by previous maps, it was not always apparent which interanchor interval a microsatellite would lie within and, therefore, which recombinant panel should be typed. Under these circumstances, appropriate adjacent panels were typed.
Although we tested all the Whitehead/MIT primers available during the period of map construction, inevitably a proportion failed to amplify product or proved problematic for reliable scoring and mapping. For the 4450 microsatellite markers tested by the semiautomated fluorescent dUTP genotyping approach, 51.2% amplified and were mapped successfully. Of the 48.8% that failed to be added to the map, 14.7% failed to give any product whatsoever (on either C57BL/6 or M. spretus DNA) and 31.1% produced some product but was not scoreable (e.g., multiple bands or variable product sizes). A small percentage, 3.0%, gave reliable, but identical, products between C57BL/6 andM. spretus DNA and were therefore not mappable.
Given the high throughput requirements of the project, we did not return to failed primer sets to optimize PCR conditions, and as a consequence, a proportion of microsatellites were not added to the map on each chromosome. Ultimately, of the Whitehead/MIT microsatellites available to us during map construction, 56% were added to the EUCIB map. For individual chromosomes, the proportion of Whitehead/MIT microsatellites placed on the EUCIB map varied from 45% to 70% of Whitehead/MIT microsatellite markers (see Table 1).
The MBx Database—Construction of the EUCIB High-Resolution Microsatellite Map
The MBx database that supports the EUCIB program has been described previously (Breen et al. 1994). Genotypes were entered into the MBx database and genetic maps were constructed. Determining locus order rather than genetic distance was the primary consideration for the construction of genetic maps because this provides the most important enhancement to future physical maps that will be underpinned by the high-resolution genetic map. The order of microsatellite markers along each chromosome was determined by a haplotype analysis that minimizes the recombinants in any chromosomal region. The genetic distances displayed in the EUCIB Genetic Map and MultiMaps are calculated so that the marker order derived by haplotype analysis is maintained (see Methods); these displays (see Fig.1) are available on the World Wide Web site:(URL:http://www.hgmp.mrc.ac.uk/MBx/MBxHomepage.html), which also includes genotype data for individual markers on the maps. Direct access to the MBx database to view haplotypes is also available (see Methods). The MBx database provides scrollable tables of haplotypes for each chromosome, identifying and highlighting all recombination events. It is possible to select and display all mice containing recombination events in a particular interval to assess the raw data and to evaluate how robust locus order is.
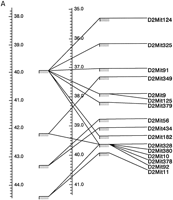
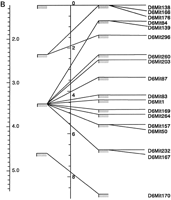
Multimap comparisons of regions of the Whitehead/MIT microsatellite map and the EUCIB map from chromosome 2 (A) and 6 (B) demonstrating increases in bin number and resolution by use of the EUCIB resource. Genetic map positions of Whitehead/MIT bins are shown at left with the genetic map position of the EUCIB bins atright.
The EUCIB High-Resolution Genetic Map
In total, 3368 microsatellites and anchors have been mapped and ordered at high resolution on the EUCIB backcross (see Table 1). The total length of the high resolution EUCIB genetic map is 1398 cM as calculated from proximal–distal anchor distances on each chromosome (Table 1). On each chromosome, a few microsatellites map beyond the most proximal or most distal anchors. However, for these markers it is not feasible to determine accurate anchor–marker distances (see Methods) and for this reason, these markers have not been included in the calculation of total genetic length. Thus, 1398 cM represents the minimum length of the genetic map. The total calculated length of the EUCIB map is very similar to that reported from the genome-wide Frederick C57BL/6 × M. spretus backcross map (Copeland and Jenkins 1991) whose genetic length (as reported in Dietrich et al. 1996) is 1385 cM.
The high resolution of the EUCIB map is reflected by the fact that the microsatellites were distributed among 2302 bins giving 1.46 markers per bin on average—a bin being defined as a minimally resolved genetic interval separated from adjacent bins by proximal and distal recombination breakpoints for all markers in that bin. Table2 illustrates the distribution of markers per bin. Seventy-one percent of the bins contain only 1 marker, again reflecting the high resolution of the mapping process. Most notably, the average separation between bins is 0.61 cM. The average intermarker interval is 0.42 cM or ∼800 kb.
Marker Distribution Across Bins
Figure 1 shows a multimap comparison of the EUCIB and Whitehead/MIT maps and illustrates the typical increase in resolution afforded by the EUCIB high-resolution mapping resource. It is important to note when comparing the EUCIB and Whitehead/MIT maps that for the Whitehead/MIT map (Dietrich et al. 1994) constructed from a limited number of F2 intercross progeny, statistical support for order of a given marker could vary, either because of incomplete genotyping or because the marker is dominant rather than codominant. Thus multimap comparisons of Whitehead/MIT and EUCIB maps illustrate, not unsurprisingly, that markers lying in adjacent bins on the Whitehead/MIT map are sometimes found to interdigitate when their order is determined at high resolution on the EUCIB map (see Fig. 1). For this reason, we have chosen a relatively high cutoff point to assess the frequency of markers that deviate in position between the EUCIB and Whitehead/MIT maps. Proceeding systematically proximal to distal on each chromosome, we coaligned each EUCIB primary or secondary anchor marker with the corresponding locus on the Whitehead/MIT map, and then assessed each microsatellite lying in the following inter-anchor segment on the EUCIB map for significant deviations with the Whitehead/MIT map. (Only markers lying between the most proximal and distal anchors on each chromosome were subject to this analysis to avoid biases from the few poorly mapped markers lying outside these anchor loci.) Choosing a cutoff point of 10 cM, only 76 markers (2.3%) on the EUCIB map mapped 10 cM or more from their expected location on the basis of the Whitehead/MIT map. At 15 and 20 cM, this figure dropped to 1.1% and 0.8%, respectively. Overall, there is excellent agreement between Whitehead/MIT and EUCIB maps.
Distribution of Markers and Recombination Events
Only two large bins—one of 11 and one of 12 markers (see Table2)—remain on the final EUCIB map. We examined these bins to see if they corresponded to any of the large bins on the Whitehead/MIT map that may be accounted for by regions of crossover suppression that are common between the two crosses used for mapping (the Whitehead/MIT map was constructed by use of a (C57BL/6J-ob/ob × Mus castaneus) F2 intercross (see Dietrich et al. 1996). The bin of 11 markers is found on chromosome 16 at position 6.34 cM and includes the microsatellites D16Mit8, 32, 33, 79, 121, 122, 131, 142, 161, 180, and 181. The bin of 12 markers is found on chromosome 2 at position 32.23 cM and includes the microsatellites D2Mit8, 72, 89, 155, 157, 240, 241, 298, 323, 373, 433, and 471.However, neither of these bins corresponded to large, unseparated bins of markers on the Whitehead/MIT map (Dietrich et al. 1996).
We have also examined the EUCIB maps to determine the largest genetic gaps. Only five gaps >5 cM were identified between the most proximal and distal anchors. On chromosome 1, a gap of 8.59 cM separatesD1Mit65 and D1Mit118. On chromosome 5, a gap of 7.38 cM was found to separate D5Mit160 and D5Nds6, whereas on chromosome 9 two gaps between D9Mit217 and D9Mit58(6.60 cM) and D9Mit294 and D9Mit42 (5.44 cM) were identified. On chromosome 18, a gap of 9.68 cM was identified betweenD18Mit33 and D18Mit8. None of these gaps corresponded to any of the larger genetic intervals on the Whitehead/MIT map (Dietrich et al. 1996; see Discussion).
In total, 17,029 distinct recombination events were observed in theMBx database among the 982 progeny and distributed across all 20 chromosomes (see Table 3). On average, each mouse carries 17.3 recombination events. Forty-four percent of chromosomes did not show an observable recombination event. Forty percent of chromosomes (7863) showed a single recombinant, 7.2% of chromosomes demonstrated double recombinants, and 5.6% triple recombinants. We have used a goodness-of-fit test to analyze the distribution of recombinant classes on each chromosome for fit to Poisson. None of the 20 chromosomes fit a Poisson distribution, differing significantly in all cases (see Table 3). As observed for the original EUCIB anchor map (Breen et al. 1994), and in agreement with other reports (Ceci et al. 1989; Saunders and Seldin 1990; Nadeau et al. 1991; Reeves et al. 1991, 1997), there is a general over-representation of single recombinants, and double recombinants are under-represented on all chromosomes—probably because of crossover suppression. In general, triple recombinant classes and classes carrying larger numbers of recombinants are over-represented—probably largely because of genotyping errors (see below). In total, 10,991 chromosomes (56%) carried one or more crossovers. In general, there was a broad relationship between a chromosome’s genetic length and the total number of recombinant events observed for that chromosome. Overall, however, the relationship between numbers of recombinants per chromosome and genetic length across all 20 chromosomes was not significant (see legend to Table 3). A binomial test to identify those chromosomes that contribute significantly fewer or greater recombinants than expected indicates that chromosomes 1, 7, 8, and 18 contribute significantly more recombinants than expected, whereas chromosomes 3, 11, 15, 16, and 17 contribute significantly fewer (see legend to Table 3).
Number and Distribution of Recombinants by Chromosome
Error Correction
Multiple recombinants observed on an individual chromosome (see above) can be characteristic of genotyping errors. For this reason, we have sought to identify those multiple recombinants that may be most indicative of genotyping errrors to reach some assessment of the overall level of genotyping error in the EUCIB dataset. Error correction on each chromosome has been proceeded by the identification of haplotypes 1(.)2(.)1 and 2(.)1(.)2 for adjacent markers within the database where 1 represents a homozygote, 2 a heterozygote and (.) represents a variable number of intervening markers for which genotype information might not be available in any haplotype (see legend to Table 4). These apparently double recombinant haplotypes for very closely linked markers would be expected to occur rarely, if at all, and contribute to a proportion of double and triple recombinant chromosomes and to chromosomes carrying larger numbers of recombinants (see above). Subsequently, having identified these double recombinant haplotypes, primary data entry is checked, or in some cases scorings are repeated. Eventually, when error correction is complete, reordering of markers is carried out by MBx. Nevertheless, following error correction and reordering, some aberrant haplotypes remain (see Table 4 for the total number of spurious double recombinant haplotypes per chromosome). In total, 1158 double recombinants of the form 1(.)2(.)1 or 2(.)1(.)2 remain. Across the whole dataset, 41% of these double recombinants are of the form 121 or 212 with no intervening unscored markers. Sixty-six percent of double recombinants are of the form 121, 212 and 1(.)2(.)1 or 2(.)1(.)2 in which only a single intervening marker (.) is unscored. The high frequency of these apparently closely spaced double recombinants is very suggestive of genotyping errors rather than true recombination events.
Number and Chromosome Distribution of Aberrant Double and Triple Recombinants
In general, if we assume that all aberrant haplotype events represent genotyping errors, then the average genotyping error rate across the whole genome is ∼0.01. The rate varies from chromosome to chromosome, therefore, on some chromosomes, for example, chromosome 16, it is as low as 0.002. However, we have undertaken additional analyses to empirically estimate the residual error rate for genotypes within the EUCIB dataset. Additionally, we have attempted to estimate the overall error rate for marker order across the genome.
Genotyping Error Rate
Following the final rounds of data production, error checking, and ordering, we chose two chromosomes—1 and 5—and identified all remaining 1(.)2(.)1 and 2(.)1(.)2 haplotypes for adjacent markers from within the dataset. Some 1(.)2(.)1 and 2(.)1(.)2 haplotypes will occur as part of more complex triple recombinant haplotypes [e.g., 22(.)1(.)2 (.)11] among adjacent markers. These triple recombinant haplotypes can arise because of errors in typing, or more likely, errors in ordering in which the inversion of the central two markers would remove the triple recombinant haplotype and substitute a single recombinant haplotype in its place (see below). Nevertheless, for chromosomes 1 and 5, the aberrant genotypes were rescored in all cases. This involved repeating the appropriate PCR reactions under identical reaction conditions. Following retyping, these chromosomes were reordered. Table 5 gives the reduction in the number of 1(.)2(.)1 and 2(.)1(.)2 haplotypes observed on each chromosome following second rounds of error checking and ordering and, therefore, a more accurate figure of the genotyping error rate. Taking both chromosomes together, of the original aberrant haplotype genotypings, 48% (134) were found to be incorrect, giving an error rate in genotyping for these two chromosomes of 0.008 that is, in general, in agreement with the genome-wide figure quoted above. Extrapolating to the whole genome, if ∼50% of the observed aberrant double recombinants represent genotyping errors, then the overall error rate is ∼0.005 or 1 in 200 genotypes in the database. What is notable is that a significant number of 1(.)2(.)1 and 2(.)1(.)2 haplotypes remain on each chromosome despite this second round of error checking.
Assessing Genotype Error Rates in EUCIB
By and large, these aberrant haplotypes do not result from misorders because the level of triple recombinants is very low (see below). We have also considered the possibility that some or all of these aberrant double recombinants arise because of residual heterozygosity within theM. spretus mice used in establishing the backcross. That part of the EUCIB backcross performed in London used M. spretusanimals from a colony that had not been systematically inbred, whereasM. spretus animals used in Paris were from the SEG/Pas colony that is moderately inbred after 20 generations of unrelaxed brother-sister matings (Breen et al. 1994). Apparent double recombinant chromosomes of the form SSBSS (where S and B are the M. spretus and BL/6 alleles, respectively) could arise if there is residual heterozygosity in the M. spretus parents with a B rather than an S allele present at the supposed double recombinant locus in some members of the parent M. spretus population. In the backcross to BL/6, an SSBSS haplotype inherited from the F1 would be scored as a 2(.)1(.)2 haplotype in MBx—which we have designated a B1 haplotype. Conversely, in the backcross to M. spretus, an SSBSS haplotype would be scored as 1(.)2(.)1 inMBx, designated a S2 haplotype. Both B1 and S2 classes might be expected to be in excess if residual heterozygosity was a significant factor. However, residual heterozygosity from the M. spretus parent population could not account for haplotypes of the form BBSBB. In the backcross to BL/6, an BBSBB haplotype inherited from the F1 would be scored as a 1(.)2(.)1 haplotype in MBx—which we have designated a B2 haplotype. Conversely, in the backcross toM. spretus, an BBSBB haplotype would be scored as 2(.)1(.)2 inMBx—designated a S1 haplotype. Overall, we find that there are in total 606 double recombinant haplotypes in the B1 + S2 class, whereas there are 552 haplotypes in the B2 + S1 class. Residual heterozygosity does not, therefore, appear to be a major factor in the appearance of aberrant double recombinants.
Marker Order Error Rate
Following retyping and reordering, we also identified on every chromosome all triple recombinant haplotypes that remained—11(.)2(.)1(.)22 and 22(.)1(.)2(.)11—and that potentially represent local misorders. The numbers of triple recombinant haplotypes remaining on each chromosome are also given in Table 4. Some chromosomes had no detectable triple recombinants and in total, across the genome, we found 160 haplotypes representing the likely total number of locally misordered markers.
DISCUSSION
We have constructed the first high-resolution genetic map for a mammalian species. The EUCIB high-resolution microsatellite map has allowed us to order markers to 2302 bins providing a bin separation at ∼0.6 cM and a robust framework on which to complete the physical map of the mouse genome. Seventy-one percent of bins contain only one marker and only two large bins of 11 and 12 markers remain among the 3368 microsatellites mapped. Five gaps in the genetic map >5 cM remain on chromosomes 1, 5, 9, and 18. These do not correspond to regions of poor coverage on the EUCIB map because many of the Whitehead/MIT microsatellites from these regions were added to the map. In addition, the gaps in the EUCIB maps do not correspond to any of the larger genetic intervals remaining on the Whitehead/MIT genetic map (Dietrich et al. 1996). Overall, it would appear that these gaps potentially correspond to recombination hotspots on the EUCIB map.
Error checking confirmed the robustness of the genetic maps constructed. Most importantly, the total number of locally misordered markers identified by aberrant triple recombinants (see Results) was small—only 160 in the total dataset. To empirically estimate the genome-wide genotyping error rate remaining in the EUCIB dataset, we reanalyzed for chromosomes 1 and 5 all double recombinant 1(.)2(.)1 and 2(.)1(.)2 haplotypes for adjacent markers from within the dataset (see Results and Table 5). Approximately 50% of the original aberrant haplotypes were found to be incorrect by repeating the aberrant genotypings. Extrapolation to the whole genome gives an error rate for genotyping of ∼0.005. Given the low numbers of aberrant triple recombinants and the good agreement between the EUCIB and Whitehead/MIT maps, it would appear that a genotyping error rate of ∼0.005 or lower will enable the reliable construction of high-resolution ordered maps from mouse backcrosses.
We were unable to eliminate a significant number of the aberrant double recombinant haplotypes for adjacent markers. As indicated above, the low numbers of aberrant triple recombinants and the general agreement of the EUCIB and Whitehead/MIT maps, gives us confidence that they do not all arise from local misordering. In addition, residual heterozygosity in the M. spretus parent population does not seem to be a major factor in the appearance of aberrant double recombinants (see Results). However, retesting of aberrant genotypes was carried out without altering the basic PCR reaction conditions used. Under these circumstances, it remains to be determined by more extensive examination of the supposed remaining double recombinants whether they have failed to be eliminated because of technical reasons, or truly represent aberrant nonmendelian events.
The EUCIB resource will be used in two ways. Firstly, the provision of definitive order for many microsatellite markers at high resolution across the genome will assist in the verification of physical maps as well as aid in orientating contigs and contig closure. Secondly, EUCIB can be used to provide further resolution and robustness to the construction of genetic and physical maps in any chromosome region. It is important to recognize that the total number of recombinants in the EUCIB resource—17, 029—far exceeds the minimum of 2302 recombinants required to separate and order the 2302 bins that form the EUCIB high-resolution map. Thus, the resolution of the EUCIB resource is not exhausted and clearly further recombinants can be exploited in any and every chromosome region to increase the resolution of genetic maps and to further enhance the construction of physical maps.
For a number of species (pig, cow, rat, and zebrafish) a number of genetic approaches with a variety of marker types are currently underway to develop comprehensive genome-wide microsatellite maps at intermediate resolution (Barendse et al. 1994; Postlethwait et al. 1994; Archibald et al. 1995; Jacob et al. 1995; Knapik et al. 1996). Local high-resolution genetic maps of STSs that have been constructed, either in the mouse or in other species, have proved enormously helpful in the construction of regional but robust physical maps. As for the mouse, there will be considerable value in ultimately developing genome-wide high-resolution maps in these other species.
METHODS
The EUCIB Backcross and MBx Database
The European Collaborative Interspecific Backcross (EUCIB) resource comprizes 982 DNAs derived from a C57BL/6–M. spretusbackcross and has already been described in detail (Breen et al. 1994). The MBx database, URLhttp://www.hgmp.mrc.ac.uk/MBx/MBxHomepage.html, which holds all mouse, marker, and genotyping data and computes and displays high resolution maps has also been described (Breen et al. 1994). MBx can abstract and list all mice carrying single, double, and triple recombinant chromosomes (and chromosomes carrying larger numbers of apparent recombination events) across any chromosome region. In addition, MBx is able to provide a summary of haplotypes and their frequencies for any chromosome region. For access to the primary database contact: support{at}hgmp.mrc.ac.uk.
Details of map functions for the construction of genetic maps (see text) can be found at the MBx web site. Briefly, anchors and microsatellites are ordered on any chromosome using an algorithm that minimizes recombinants. This order is strictly maintained in constructing the genetic maps. The centromeric primary anchor on each chromosome is assigned a genetic map position according to consensus map data. Interanchor genetic distances for the primary anchors are then calculated for each chromosome and the remaining primary anchors assigned to the genetic map. Secondary anchors and microsatellites are subsequently incorporated into the genetic map maintaining genetic order as derived from the haplotype analysis. For each primary anchor interval, the total cumulative number of recombinants separating anchor and microsatellite markers in that interval is derived. The genetic distance separating a marker from any other marker or anchor in each primary anchor interval can then be calculated from the primary anchor genetic distance on the basis of the following ratio:
No. of recombinants separating marker from adjacent marker or anchor/Total cumulative no. of recombinants separating anchors and markers in the interval
Microsatellites mapping beyond the most proximal or distal primary anchors according to the haplotype analysis are added to the genetic map separately. However, it is likely that only a fraction of the relevant recombinants separating these markers and the primary anchor have been tested and genetic distances determined are, therefore, inaccurate.
Genotyping
Recombinant panels in any chromosome region were genotyped by use of a high-throughput, semiautomated fluorescent dUTP genotyping approach that has been described recently (Rhodes et al. 1997).
Acknowledgments
This work was supported by the Medical Research Council, UK and partly by the European Commission (grant no. GENE-CT-93-0046). We thank the EUCIB steering committee for their advice and support and comments on earlier drafts of this paper. We also thank David Papworth for statistical advice.
The publication costs of this article were defrayed in part by payment of page charges. This article must therefore be hereby marked “advertisement” in accordance with 18 USC section 1734 solely to indicate this fact.
Footnotes
-
↵5 Corresponding author.
-
E-MAIL s.brown{at}har.mrc.ac.uk; FAX 01235 824542.
-
- Received August 4, 1997.
- Accepted February 9, 1998.
- Cold Spring Harbor Laboratory Press


