
A Radiation Hybrid Map of Human Chromosome 5 with Integration of Cytogenetic, Genetic, and Transcript Maps
- John D. McPherson1,2,6,
- Barbara Apostol1,
- Caryn B. Wagner-McPherson2,
- Simin Hakim1,
- Richard G. Del Mastro3,
- Naeema Aziz1,
- Elizabeth Baer1,
- Genalyn Gonzales1,
- Mary Carol Krane1,
- Rachelle Markovich1,
- Peter Masny1,
- Miguel Ortega1,
- John Vu1,
- Marco Vujicic1,
- Deanna M. Church1,
- Allan Segal1,
- Deborah L. Grady4,
- Robert K. Moyzis4,
- M. Anne Spence1,
- Michael Lovett5, and
- John J. Wasmuth1
- 1Department of Biological Chemistry, University of California at Irvine, Irvine, California 92717; 2Department of Genetics/Genome Sequencing Center, Washington University School of Medicine, St. Louis, Missouri 63108; 3Genome Therapeutics Corporation, Waltham, Massachusetts 02154; 4Center for Human Genome Studies, Los Alamos National Laboratory, Los Alamos, New Mexico 87545; 5Departments of Otorhinolaryngology, Molecular Biology, and Oncology, McDermott Center, University of Texas Southwestern Medical Center, Dallas, Texas 75235
Abstract
One of the major goals of the human genome project is to establish a physical map of each human chromosome with a density of sequence-tagged site (STS) markers exceeding one every 100 kb. We report here the generation of a human chromosome 5-specific radiation hybrid (RH) map that includes 556 markers. Of these markers, 132 loci are ordered with a maximum likelihood ratio of >1000:1 compared with the next most likely order. An additional 113 loci were ordered relative to these backbone markers with a maximum likelihood ratio of >10:1 but <1000:1. Together, these 245 loci form an ordered framework map for the chromosome. Using this framework, >300 more markers were localized based on two-point analysis with the ordered set. On average, there are 50 markers in common with the RH map presented here and other chromosome 5 maps included in the current whole genome cytogenetic, genetic, and physical maps. The accuracy of all the maps is evident in that there are no more than two discrepancies between any one of them and these data. All of the maps encompassing chromosome 5 complement each other providing excellent STS coverage with >2200 loci combined. The chromosome 5-specific RH map contains 20% of these independent loci. In addition, our RH map contains STSs derived from clones suitable for fluorescent in situ hybridization, allowing alignment to the cytogenetic map. Together, these maps will assist in the assembly of sequence-ready contigs and will aid in the identification of disease loci on chromosome 5 by positional cloning and positional candidate approaches.
[The STS sequences described in this paper have been submitted to dbSTS under accession nos. G15666–G15715 andG16049–G16063. A complete map of human chromosome 5 is available as an on-line supplement at http://www.cshl.org/gr.]
Radiation hybrid (RH) mapping, first proposed by Goss and Harris (Goss and Harris 1975; Goss 1976), begins with lethal irradiation of a cell line containing a genomic region of interest resulting in random chromosomal breakage. Fragments are reassembled during DNA repair, and the resulting segmented chromosomes are recovered by fusion of the irradiated cell line to a recipient cell line. Although a specific gene in the starting cell line may be used to facilitate hybrid selection, the majority of the radiation-reduced fragments are transferred nonselectively. Statistical analysis of the frequency of coretention of markers in the resulting hybrids is used to determine marker order and interlocus distance (Goss and Harris 1977;Cox et al. 1990; Boehnke et al. 1991). Although RH mapping is conceptually similar to meiotic mapping, the latter cannot easily be used to construct high-resolution maps and is dependent on the use of polymorphic markers. Any marker, typically a specific PCR product, that can be scored for its presence or absence in the RHs can be incorporated into an RH map. This ability to use any sequence-tagged site (STS) facilitates the integration of cytogenetic, genetic, STS, and transcript maps using the RH technique.
Chromosome 5 has been estimated to encompass 194 Mb (Morton 1991) or ∼6% of the human genome. Several regional RH maps focusing on specific disease loci or gene-dense segments of this chromosome have been reported previously (Warrington et al. 1991, 1992; Ryan et al. 1992; Thompson et al. 1993; Warrington and Wasmuth 1996). Recently, whole-genome RH maps have become available [Hudson et al. (1995) with supplementary data from the Whitehead Institute/MIT Center for Genome Research, data release 11 (October 1996); Schuler et al. 1996; The Stanford Human Genome Center (SHGC, http://shgc.stanford.edu)], which naturally include markers on chromosome 5. These whole-genome RH maps do not individually have sufficient marker density for efficient sequence-ready contig assembly. Integration of these maps is essential to meet the goals of the human genome project (Collins and Gallas 1993).
Here, we report the construction of an RH map of human chromosome 5 with 556 markers. These markers are supported by a subset of 134 backbone markers spanning the chromosome that are ordered with a maximum likelihood ratio of >1000:1 compared with the next most likely order. Two loci are represented by pairs of markers with identical retention patterns. These backbone markers span the chromosome with the only gap at the centromere. Markers adjacent to each side of the centromere were linked with an associated lod score of >3; however, definitive ordering across the centromere was not possible. An additional 114 markers were ordered relative to the backbone markers with a maximum likelihood ratio of >10:1 but <1000:1. This includes one pair of markers with identical retention patterns. Using two-point analysis, 308 more markers were mapped relative to this framework set. This map includes polymorphic markers, STSs from the end sequence derived from cosmid clones used for fluorescence in situ hybridization (FISH), expressed sequence tags (ESTs), as well as monomorphic STSs. Sufficient markers were intentionally included to allow alignment of this map with other genetic and physical maps spanning chromosome 5. The combined maps have >2200 independent markers with the work presented here contributing 20% of the unique mapped loci. This chromosome-specific effort complements the whole genome genetic and physical maps and increases the mapped marker density for this chromosome to <100-kb average inter-STS spacing.
RESULTS
Chromosome 5 RH Panel
The presence of human DNA fragments in the RHs was determined by inter-Alu PCR. Cell lines were considered to contain human material if any PCR products were observed. No products were obtained using DNA from the parental hamster cell line alone or in control samples containing no DNA (data not shown). Based on these criteria, 200 RHs were selected for large-scale growth. At the time of cell pellet harvest, the cell lines were again tested for human content and 20 cells lines no longer contained detectable human DNA. DNA from the remaining 180 radiation hybrids was appropriately diluted for STS content analysis.
Characterization of the RHs
Each one of the 200 RHs selected for large-scale culturing was analyzed by FISH to determine the number, size, and nature of the human fragments they contain. Table 1 summarizes these findings. Probable human telomeric and centromeric fragments were identified by their localization to these chromosomal structures within the human/hamster segmented chromosomes. RHs that appeared to harbor only a single human fragment (24%, designated sfRH) were of particular interest for their potential to generate regional cloned material by inter-Alu PCR for closing gaps in the physical map. Of the 47 sfRHs, 25 contained interstitially incorporated fragments, 12 appeared to harbor centromeric fragments, and 10 appeared to harbor telomeric fragments. FITC-labeled inter-Alu PCR products obtained from the sfRH were used to probe human metaphase chromosomes. Figure 1a shows the localization of one of these fragments to 5q32–q33; Figure 1b summarizes the localization of fragments from all the sfRH examined.
Human Content of the RHs as Determined by FISH Analysis

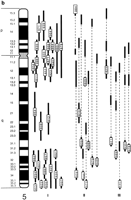
(a) Hybridization of fluorescein-labeled IRE-vectorette PCR products derived from RH XZH962 to normal human metaphase chromosomes (46 XY). The probe hybridizes to a single region (5q32–q33) of chromosome 5 (arrows). Some background hybridization to other chromosomes is evident; however, the human content of the parental hybrid is solely chromosome 5. (b) Chromosomal origin of human DNA in RHs with only one detectable human fragment. The boxed numbers represent the RH identification number; the solid vertical lines indicate the extent of hybridization to the chromosome as depicted in the ideogram. Broken lines connect multiple regions of hybridization observed for a single hybrid. Groups I, II, and III represent hybrids that generated one, two, and three observed regions of hybridization, respectively.
PCR Analysis
Each hybrid was analyzed in duplicate for the retention of a total of 714 markers. Usable data were obtained for 556 of these markers. There was an average 3.5% discrepancy between duplicate analyses. Most discrepancies were resolved by analyzing selected hybrids for a third time. If the results for any individual hybrids remained unclear, this information was included at the time of analysis using the RH mapping programs. The programs regard these hybrids as untyped within the data set for the marker in question. Only three pairs of markers had identical patterns of retention, namely D5S1462 andL28308, D5S1632E and L31452, and D5S1611Eand D5S1663E.
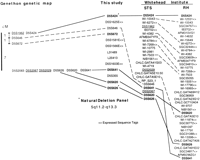
Approximately the first 200 markers were also mapped using the chromosome 5 natural deletion panel shown in Figure 2 (McPherson et al. 1994; Overhauser et al. 1987). This binning information was used to identify groups of potentially linked markers and to align the RH map with the G-banding pattern of chromosome 5.
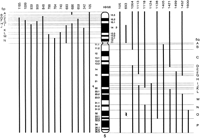
Chromosome 5 natural deletion panel. Solid vertical bars represent the portion of chromosome 5 present in each hybrid as indicated by the ideogram. The hybrid number appears directly above the vertical bar and in all cases is prefixed by HHW. For clarity, each bin defined by this panel is labeled on each side. The small fragment contained in HHW693 in bin 5qO was detected by PCR using STSs from this region. The exact endpoints of this fragment are unknown.
Table 2 shows the distribution of the markers with respect to amplimer type and long and short chromosome arm assignment. The position of the centromere was determined by considering the order of the framework markers and the deletion panel binning data.
Distribution of Markers by Type
Retention Frequencies
Figure 3a shows the retention frequencies of the framework markers relative to their position on the chromosome. Retention frequencies were generally randomly distributed with the exception of markers close to the centromere, which had slightly higher retention frequencies. The distribution of retention frequencies of all markers retained in the 180 RHs is shown in Figure 3b. Retention frequencies varied from 7% to 40%. Markers with a retention frequency of <10% were not used to construct the framework maps.
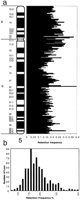
(a) Retention frequencies of all framework markers are indicated at their relative positions along the chromosome as determined from the natural deletion panel binning data. (b) Distribution of retention frequencies of all markers used in this study.
Map Construction
Marker order was determined by analyzing groups of linked markers using the RHMAXLIK program (Boehnke et al. 1991). Markers within these groups, for which the most favorable order was better than any other order by a maximum likelihood ratio of >1000:1, were used to assemble a backbone map with adjacent marker groups. Seven blocks of these ordered markers were constructed, six on the long arm and one on the short arm. The average number of markers in each block was 19 and each of these blocks of markers gives a single order at >1000:1 odds using RHMAXLIK with SAVMAX = 8 and PRTMAX = 3. The effect of increasing the number of potential orders retained as each new marker is added during analysis was examined by increasing the SAVMAX value to 10, 12, and 15 when analyzing the block of markers on the short arm. The order of the 23 markers in this block was retained with the exception of one marker pair. The inversion of this pair could be resolved by deletion panel binning. The orientation of the seven blocks of ordered markers was supported by two-point analysis with markers in adjacent bins and by consistency with the deletion panel data. Distance between adjacent markers was determined by two-point analysis. This distance is reported in cR6500 units, where the subscript 6500 indicates the radiation dose in rads used to generate the hybrids. The cR6500 unit is abbreviated cR (centiRay) throughout this text. Markers adjacent to the centromere (D5S2711 and D5S2692) were linked with lod score = 3.1. The inclusion of a marker within the α satellite repeats [amplimer (4 + 9)/Alu2; Prades et al. 1996] failed to strengthen the evidence for this linkage (data not shown). This highly ordered set of markers included 134 markers representing 132 loci distinguished by unique retention patterns in the RH.
With the 134 marker 1000:1 RH map established, additional localized markers were ordered relative to this set. An additional 114 markers representing 113 loci could be ordered with respect to these backbone markers at >10:1 odds and were used to construct the chromosome 5 framework map.
To expedite the addition of new markers, they were mapped to linkage intervals using the RH2PT program. Unlike the RHMAXLIK program, RH2PT can handle a large number of markers with a short analysis time; we routinely analyzed 200 markers simultaneously. Two-point distances and lod scores relative to the 1000:1 backbone markers were calculated for newly typed markers. Table 3 shows an example result for these analyses. Only markers linked with a lod >3 are shown. New markers were assigned to the interval, including the marker with the highest associated lod score and spanning markers with associated lod scores within 6 of this maximal value. An additional 308 markers were localized in this manner.
Two-point Mapping of MarkerL38388
Figure 4 shows the short arm chromosome 5 RH map (a complete map is available as an on-line supplement at http://www.cshl.org/gr) summarizing the results obtained by the above analyses. The total distance spanned by the framework loci is 7092 cR; therefore, there are, on average, 29 kb/cR using an estimated size of 194 Mb for this chromosome (Morton 1991). The average distance between adjacent 1000:1 backbone markers is 1.5 Mb and between the combined framework RH map markers is 800 kb. Including all markers, the average distance between loci is 350 kb.
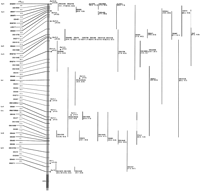
The short arm of human chromosome 5 RH map. A complete map is available as an on-line supplement at http://www.cshl.org/gr. Markers ordered with a maximum likelihood ratio of >1000:1, compared with the next best order, are in boldface type and the farthest to the left of the shaded vertical bar representing the chromosome. These are designated backbone markers in the text. Markers ordered with a maximum likelihood ratio of <1000:1, but >10:1, are in plain text and indented. These markers, combined with the backbone markers, form the framework map as designated in the text. Distances between framework markers in centiRays are indicated. Proportional positions of each marker are indicated on the vertical shaded bar. Natural deletion bin assignments for representative backbone markers are indicated on the extreme left-hand side and refer to the regions indicated in Fig.2. Asterisks indicate STSs derived from the end sequence of cosmids mapped previously by FISH. Their previously assigned cytogenetic localizations are indicated in brackets adjacent to the asterisks. EST markers have an uppercase E suffix, and genes are designated using Genome Database nomenclature. Markers to the right of the shaded vertical bar were localized by two-point analysis. Each marker name is in line with the proportional position of the framework marker to which it was maximally linked with the associated lod score and distance directly below in brackets (lod, cR). The vertical line immediately to the left of each marker represents the interval to which it has been mapped relative to the proportional positions of the framework markers. Markers with the same interval are grouped. Broken lines join regions meeting the criteria for inclusion in the interval (see text).
DISCUSSION
The RHs used to construct this chromosome 5 RH map were characterized extensively. The 180 hybrids were first shown to contain some human material by inter-Alu PCR. Because there is no selective pressure for these hybrids to retain the human chromosomal fragments, this prior analysis for human content maximizes the information obtained when analyzing for the retention of the STS to be mapped. Selection of the hybrids by this means could cause the overrepresentation of Alu-enriched regions of chromosome 5 in the panel: however, most of these hybrids contain multiple fragments. The amplification of even a single human-specific inter-AluPCR product was sufficient to include that hybrid in this study. Twenty hybrids (10%) failed to retain detectable human content after large-scale culturing. This rate is similar to previously reported results suggesting that this was attributable to the human fragments segregating into a small subset of the cell population during clonal expansion (D.R. Cox, pers. comm.). When analyzed by FISH, using labeled total human DNA, 13 of these hybrids did contain detectable human fragments but the fragments were very small and distributed among the cell population. As summarized in Table 1, the hybrids used for this study most frequently contained three to five fragments with an average size of 7.25 Mb; therefore, each hybrid contains ∼22–36 Mb, or 11%–19%, of human chromosome 5. This agrees well with the observed average retention frequency of STS in the RH of 19.1% with most loci being retained in 12%–24% of the hybrids. The retention frequencies of human telomeric and centromeric fragments detected by FISH did not differ greatly from the average retention of other human fragments. RHs that appeared to contain only a single human fragment were further analyzed by hybridizing FITC-labeled interspersed repetitive element (IRE) PCR products derived from them to normal human metaphase chromosomes. Surprisingly, the hybridization patterns obtained with the products derived from many of the sfRHs indicated the presence of multiple human chromosome 5 fragments (Fig. 1b). Some of these discrepancies may be attributable to the presence of the previously described chromosome 5-specific block repeats in the PCR products. The regions to which these apparent fragments hybridized were similar to the localization of the block repeats (Thompson et al. 1993). It is also possible that the fragments observed in some of the sfRHs were collinear fragments derived during chromosomal repair immediately following the irradiation of the parental cell line. The presence of multiple fragments in some sfRHs was supported by the retention of appropriate loci from the regions identified by FISH analysis (data not shown).
The sfRHs will be useful for deriving additional cloned material for defined regions. As can be seen in Figure 1b (I), there are 31 sfRHs that were confirmed to harbor a single region of human chromosome 5. The combined fragments in these hybrids encompass ∼90% of the chromosome, with only two gaps at 5q13.3–q14 and 5q31.1–q31.2. The 5q31.1–q31.2 interval is contained in several of the hybrids that appear to contain two or three fragments and can be used to derive highly enriched sources of cloned material for this interval.
Markers close to the centromere were retained in a greater number of the radiation hybrids than that for an average STS (Fig. 3a); however, analysis of these markers using the centromeric retention model within RHMAXLIK resulted in only occasional inversions of single marker pairs within the groups next to the centromere, which could be resolved using the natural deletion panel binning data. The centromeric retention model allows for a higher retention probability at one endpoint of the map (Boehnke et al. 1991). Markers with a retention frequency of <10% were not included in the map, as these data do not have sufficient depth for accurate marker placement (Cox et al. 1990).
Initial marker binning results obtained using the chromosome 5 natural deletion panel were largely consistent with the two-point data calculated from the observed marker retention in the RHs. That is, markers that were linked with a lod score of >6 were localized to the same chromosomal region, although some discrepancies were observed. These discrepancies are most likely attributable to the failure of these STSs to amplify from a single hybrid within the deletion panel resulting in a misinterpretation of the bin location. As the number of markers that can be analyzed at any one time using the RHMAXLIK program is limited, the two-point data were used to guide the selection of markers to examine together. To provide the most accurate map possible, loci that could be unequivocally ordered within these initial sets were combined to generate a backbone map. This map consists of 132 loci that form seven groups of markers with invariant orders at a maximum likelihood ratio of >1000:1 when analyzed using the RHMAXLIK program. These groups of markers were oriented with respect to each other and to the chromosome using the natural deletion panel binning data for each STS, as well as by two-point analysis of the outermost loci of all the groups. These highly ordered markers are shown in boldface type in Figure 4. Although the most proximal markers on each arm of the chromosome initially demonstrated linkage across the centromere (lod = 3.1), the lod score was not improved by the inclusion in the RH data set of a marker known to be within the α satellite repeats (Prades et al. 1996). Thus, the centromere remains the only gap in the 1000:1 odds backbone map.
Of the remaining markers, those that could be regionally ordered relative to the backbone markers with a maximum likelihood ratio of >10:1, but <1000:1, were incorporated to form a chromosome 5 framework map consisting of 245 loci. These markers are indicated in Figure 4 with regular text and indented relative to the backbone markers. The average interval in this map is 29.1 cR, ranging from 1.9 to 115.3 cR.
Hardware limitations restricted the number of markers that could be analyzed simultaneously using RHMAXLIK. To expedite map construction, RH2PT was used to generate two-point data between groups of new markers and the framework map. The two-point data for as many as 50 new markers could be generated in just a few minutes. The output file from RH2PT was then parsed for the two-point data for each new locus, and all two-point relationships with an associated lod score of >3 were examined. Table 3 shows an example of these data. As in this case, the lod scores were generally seen to peak at a single locus and then decline proximal and distal to this maximal point. This strongly supports the validity of the order of the markers. If the new marker was assigned to a region with a paucity of ordered loci, an attempt was made to incorporate it into the framework map. The remaining 308 loci were assigned to a linkage interval, as described above, and these intervals are indicated in Figure 4 by vertical lines. The significant interval for the group of 10 markers at the bottom of this map only includes marker D5S408, which is one of the most distal markers on the chromosome 5 genetic and physical maps. This may indicate that there is considerable distance between this marker and the end of the long arm.
RH maps readily yield marker order and relative intermarker distances. It is also important for physical mapping strategies to be able to express distances in terms of kilobase pairs. Calibration of the chromosome 5 RH map using the total chromosome size of 194 Mb and the total length of the framework map of 7092 cR yielded 29 kb/cR. This is consistent with the 17–50 kb/cR range obtained with a previous radiation hybrid panel generated using the same dosage of radiation as in this study (Altherr et al. 1992; Thompson et al. 1993; Warrington and Bengtsson 1994; Warrington and Wasmuth 1996).
A variety of markers were used to construct the chromosome 5 RH map presented here. One of the goals of this project was to provide integration of cytogenetic, genetic, and physical maps. STSs were generated from the end sequence of cosmid clones that were localized previously using FISH and direct R-banding (Takahashi et al. 1993). These 61 STSs are indicated in Figure 4 with an asterisk, and the previously published cytogenetic assignments of the cosmids from which they were derived are indicated. The previous assignments are all consistent with the RH map and deletion panel binning data, with the exception of D5S2690, which has been placed on the RH map at the penultimate distal long arm position but is derived from a cosmid with a reported cytogenetic localization of 5q31.3. A total of 75 polymorphic markers are included in the framework map, and an additional 51 are assigned by two-point analysis. Most of these markers are included in the recent release of the Genethon human genetic linkage map (Dib et al. 1996). With RH mapping, we were able to resolve 19 polymorphic loci that could not be ordered because suitable recombinants in the Centre d’Etudes du Polymorphisme Humaine (CEPH) data set were lacking. In many instances, additional markers were localized between these previously unresolved markers. In addition, this map includes 155 EST and 89 genes, of which 58 and 13, respectively, are included in the framework map. The resolution of polymorphic markers and the positioning of these expressed sequences will aid in future positional cloning efforts.
To be maximally useful, single chromosome maps must provide ready integration into the existing large-scale genome-wide physical maps. Inclusion of as many marker types as possible also enhances utility by providing ordered resources for a variety of research projects, including positional cloning efforts and the assembly of sequence-ready contigs. Table 4 summarizes important features of several current cytogenetic, genetic, RH, and STS content chromosome 5 maps. The genetic, STS, and RH maps have a combined total of 2845 markers representing >2200 individual loci. The map presented in this study contributes ∼20% of these unique markers. There are now four RH maps that encompass human chromsome 5 [this study; Hudson et al. (1995), with supplementary data from the Whitehead Institute/MIT Center for Genome Research, data release 11 (October 1996); SHGC (http://shgc.stanford.edu/); and the Sanger Centre (http://www.sanger.ac.uk/HGP/rhmap)]. Alignment of these maps and examination of common highly ordered loci, where possible, showed very few discrepancies, as listed in Table 4. The cytogenetic FISH map has markers in common only with the map generated in this study.
Comparison of Current Human Chromosome 5 Maps
Figure 5 shows the alignment of a small segment of the Whitehead Institute (WI) RH and STS maps and of the Genethon genetic map, with the map presented here. Overall, the four maps compared agree well with each other, but this region depicts one of the few discrepancies. The order of D5S641, D5S620, andD5S626 is the same in the RH map presented here and the WI STS map but is quite different on the WI RH map. Many of the polymorphic markers from the Genethon genetic map (Dib et al. 1996) that lacked suitable recombinants have been resolved. There is also good complementation of regions of low locus density between the maps; for example, there are no additional loci in the interval betweenD5S646 and D5S641 on the STS content map, but there are eight loci in this same interval on the RH map from this study. In an analogous manner, the interval from D5S424 toD5S641 is greatly enriched by both the WI STS content and RH maps. The complementary nature of these maps will greatly assist construction of sequence-ready contigs for this chromosome.
Alignment of a segment of four maps encompassing human chromosome 5. The source of each map is indicated along the top. Solid lines join markers in common between all maps. Broken lines join markers shared by some but not all maps.
METHODS
Isolation of RHs
The human/hamster somatic cell line used to generate this RH panel was HHW105 [National Institute of General Medical Sciences (NIGMS) GM10114A], which contains an intact chromosome 5 as its only human content (Dana and Wasmuth 1982). HHW105 has been characterized extensively and has been shown to retain human chromosome 5 in 96% of all cells examined after repeated passage. No human/rodent translocation chromosomes or human chromosome fragments have been observed. The integrity of this cell line was confirmed by G-banded analysis and FISH using labeled total human DNA at the time that the production of the RHs was initiated. HHW105 cultures, which were 80% confluent, were irradiated to a dosage of 6500 rads. The fragmented genome was recovered by fusion to the cell line UCW113, a hypoxanthine phosphoribosyl transferase (HPRT)-deficient derivative of V79 Chinese hamster lung fibroblasts. The irradiation and fusion methodologies have been described previously (Cirullo et al. 1983). After selection in hypoxanthine/aminopterin/thymidine (HAT) media, 400 RH clones were isolated and transferred to 24-well cluster plates. Once confluent, the cells from the 24-well cluster plates were trypisinized. A small volume of cell suspension was passed to maintain each cell line. The remainder of the cells were pelleted and resuspended in 50 μl of lysis buffer (10 mm Tris-HCl at pH 8.3, 50 mm KCl, 0.1% Tween 20, 1 mg/ml of proteinase K) and incubated at 50°C for 1 hr. The samples were then heated at 80°C for 20 min and diluted 1:50 with TE buffer (10 mm Tris, 1 mm EDTA) for use as PCR templates. These samples were then analyzed for the presence of human DNA using inter-Alu PCR. RHs with human content were selected for large-scale culturing in expanded surface roller bottles. At the time of harvest, an aliquot of cells was again tested for human content. DNA was isolated from each cell line still harboring detectable human chromosomal fragments.
Characterization of RHs
An aliquot of cells harvested from each of the large-scale cultures was transferred to a chamber slide culture and grown to 40%–70% confluence. Slide cultures were prepared in situ for FISH and cytogenetic analysis of metaphase and interphase chromosomes.
Using FITC-labeled total human DNA, the number and size of the human fragments was determined by analysis with a Zeiss Axioskop equipped with epifluorescence and the appropriate filters. Images were captured, archived, and quantified using a triple-chip-charge-coupled device (CCD) camera imaging system and associated software (Oncor, Inc.). Averaged RH fragment lengths were compared to the average length of human chromosome 5 in 20 metaphases of the HHW105 cell line. Estimates of fragment lengths were based on a predicted 194 Mb total chromosome length (Morton 1991).
IRE PCR and IRE-vectorette PCR products were obtained from DNA from each of the RHs by established methods (Munroe et al. 1994). The PCR products were labeled with fluorescein-12–dUTP by random priming (Prime-It Fluor, Stratagene, La Jolla, CA). Probes were competitively hybridized to human metaphase chromosomes (46, XY) (Lichter et al. 1990). Slides were washed at high stringency and counterstained with DAPI and propidium iodide. The RH-generated probe hybridization patterns were localized on metaphase spreads.
Generation of Cosmid End Sequences
Cosmid DNA (500 ng) was sequenced using 9 pmoles of FITC-labeled primer and SequiTherm (Epicenter Technologies) cycle sequencing reagents. The SuperCos-1 vector-specific primers used were SCos1/-27BH1 (5′-CCCTTTCGTCTTCAAGAATTCG-3′) and SCos1/+31BH1 5′-AGCGGTCAAACATGAGAATTCG-3′). The cycling parameters used for both primers were 95°C for 2 min (95°C for 30 sec, 70°C for 30 sec) × 60 cycles. The reaction products were analyzed using an A.L.F. DNA Sequencer (Pharmacia, LKB).
PCR
All hybrid DNA was tested in duplicate for the presence or absence of each marker using PCR. The reaction volume was 25 μl and contained 10 mm Tris-HCl (pH 8.3), 50 mm KCl, 200 μm dNTP, 0.4 μm each oligonucleotide primer, 100 ng of DNA, and 0.5–2.5 mm MgCl2. Exact MgCl2 concentrations and cycling parameters for markers developed for this study have been deposited into the Genome Data Base and the dbSTS [National Center for Biotechnology Information (NCBI)]. The raw data and conditions used for these and previously available markers can also be obtained at http://chrom5.hsis.uci.eduandhttp://genome.wustl.edu/gsc/chrom_5/Chrom5_home.html. PCR products were amplified individually and analyzed by size separation using either 2%–2.5% SeaKem LE agarose or Metaphor agarose (FMC, Rockland, ME) with ethidium bromide detection. Images were captured using a CCD camera (Stratagene, La Jolla CA).
Analysis of RH Data
Using the RH2PT program (Boehnke et al. 1991), two-point distances were calculated for all marker pairs and linkage groups identified by determining which loci are linked with a lod of score >3. The RH data for markers within a single deletion panel bin or adjacent bins were also analyzed using the MDMAP program (Falk 1991). This program calculates the correlation coefficient for the retention or loss of all pairs of loci. Assuming that a high positive correlation implies closely linked loci, a distance score, equal to one minus the correlation coefficient, is calculated and a marker order is generated that minimizes the sum of adjacent loci. Using these initial orders and the two-point data as guidelines, the RH data were analyzed next using the RHMAXLIK program (Boehnke et al. 1991). This program analyzes the data from many loci simultaneously and estimates breakage and retention probabilities for any order as those that maximize the likelihood of the RH mapping data obtained. The orders with the largest maximum likelihoods are best supported by these data. An equal retention probability model was used. The computational complexity of these analyses results in a practical limitation of determining the order of ∼25 markers simultaneously. Stepwise locus ordering was used, which builds orders one locus at a time but keeps only under consideration those partial orders that have maximum likelihoods close to that of the best locus order made up of the same loci. The maximum log10-likelihood difference to keep a partial order under consideration used was 8 (SAVMAX = 8).
Once a sufficient framework map was established, the integration of new markers in regions of high marker density became increasingly difficult as the resolution limits of these RHs were being exceeded. To rapidly assign the position of a new marker relative to the framework map, the RH2PT program was used. This program has an advantage in that it can simultaneously analyze data from several hundred markers in only a few minutes. Data from new markers were analyzed in conjunction with the data from the rigorously ordered framework map markers. New markers were then assigned to an interval that included the framework marker with the greatest associated two-point lod score and extended to all markers with a lod score difference of <6 with respect to this maximal value.
Acknowledgments
This map was not yet completed at the time of the untimely death of John Wasmuth at the end of 1995. We know that he was proud of the work presented here. We are all grateful to have known him and are richer for the experience.
Footnotes
-
↵6 Corresponding author.
-
E-MAIL jmcphers{at}watson.wustl.edu; FAX (314) 286-1810.
-
- Received April 9, 1997.
- Accepted July 28, 1997.
- Cold Spring Harbor Laboratory Press


