
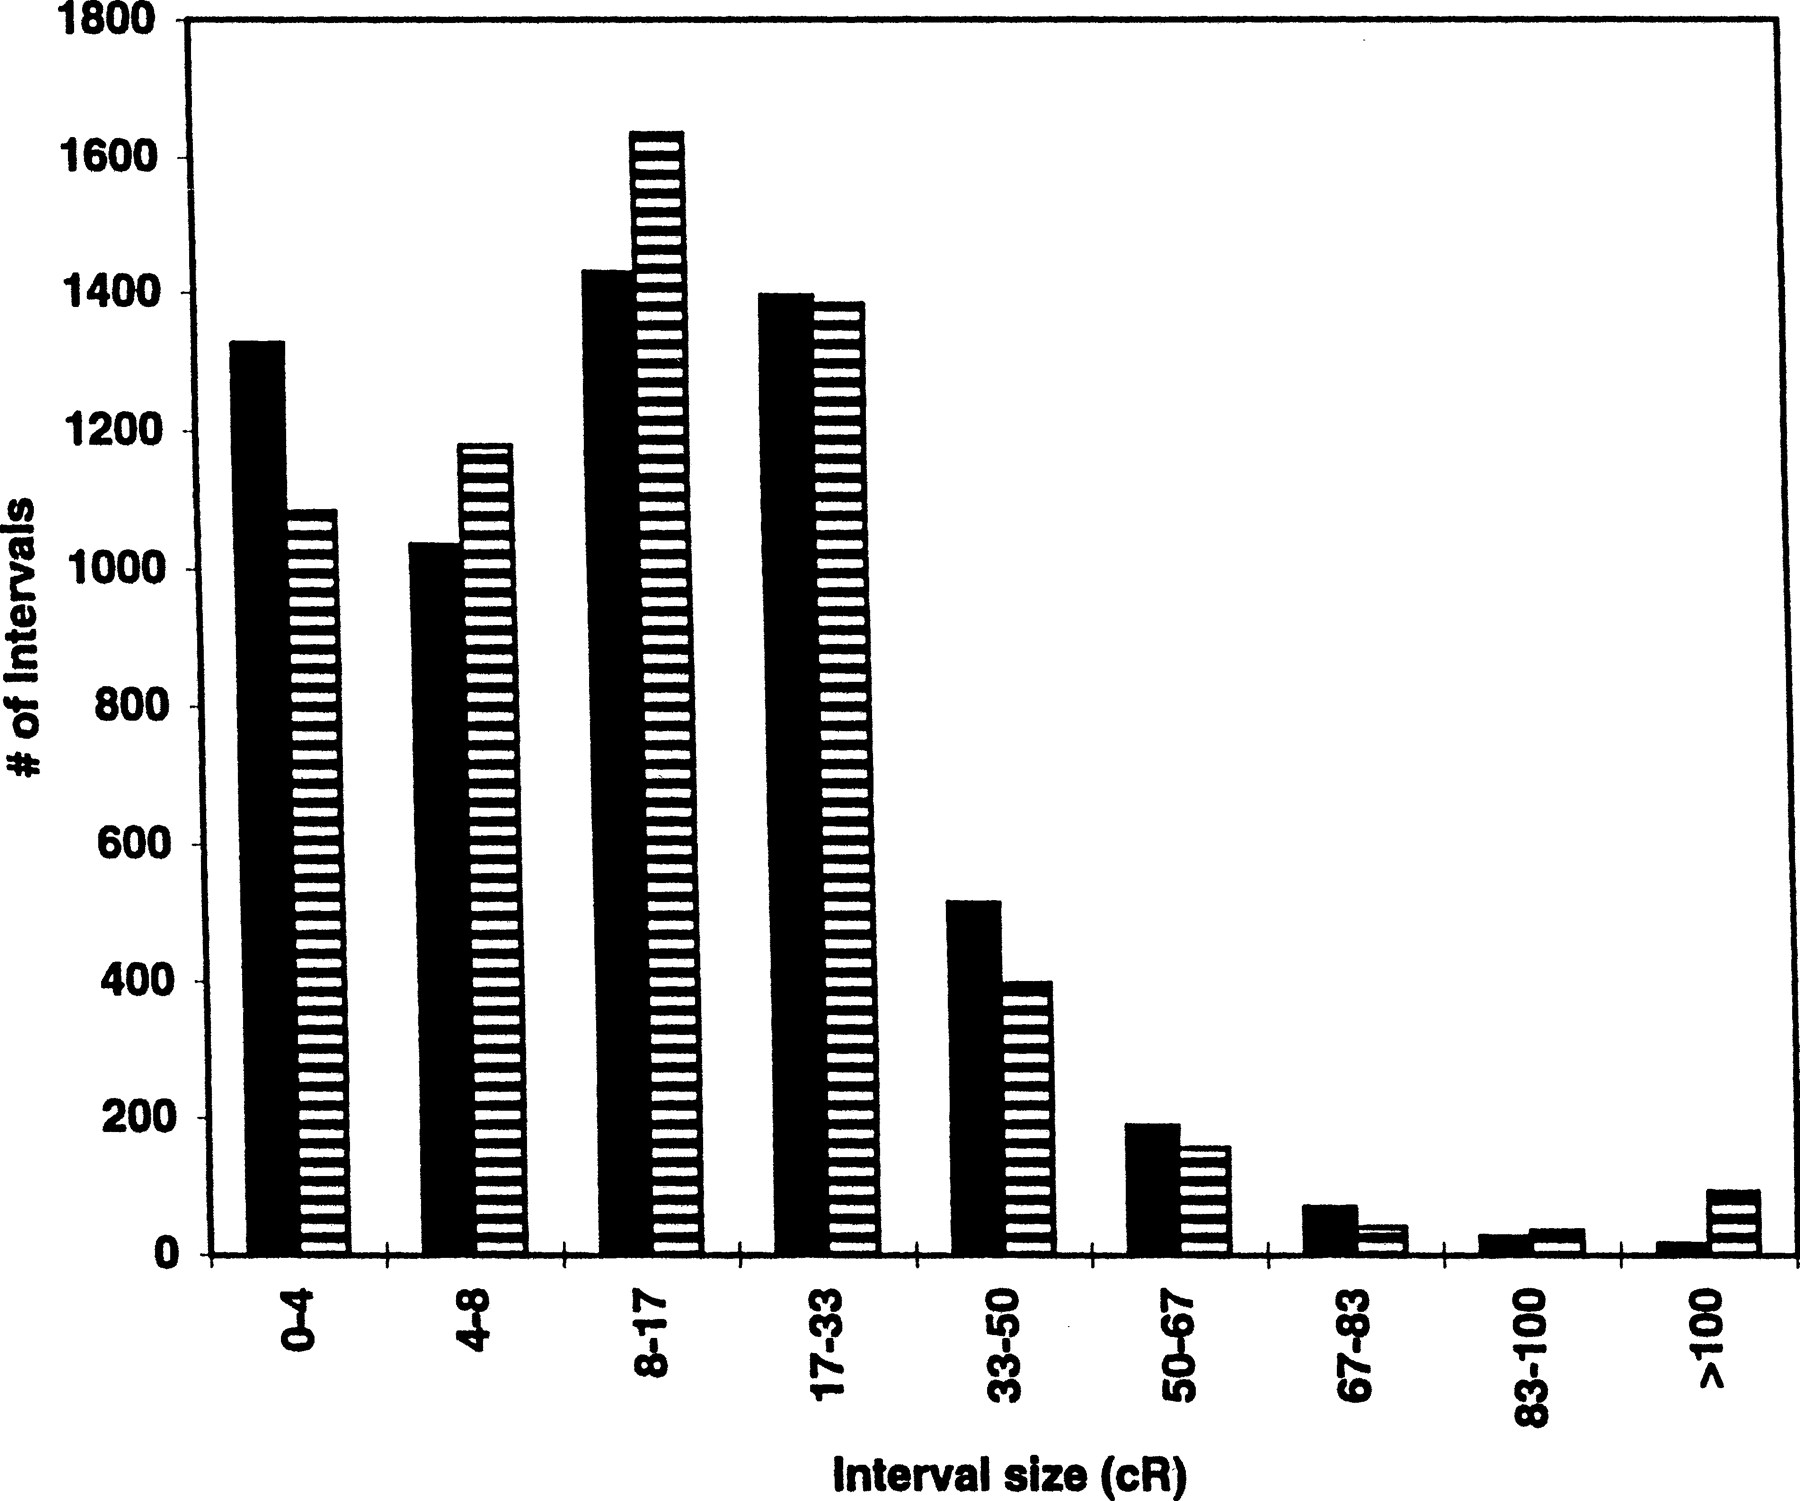
Figure 3.
Assessment of the randomness of marker distribution and irradiation breakage. The observed distribution of the distances between neighboring markers on the RH map is shown as striped bars. This is compared with the expected distribution of interval sizes, as shown in black bars, calculated assuming a random distribution of both markers and RH breakpoints as described previously (Cox et al. 1994).


