

Abstract
Three-dimensional genome organization plays a critical role in gene regulation, and disruptions can lead to developmental disorders by altering the contact between genes and their distal regulatory elements. Structural variants (SVs) can disturb local genome organization, such as the merging of topologically associating domains upon boundary deletion. Testing large numbers of SVs experimentally for their effects on chromatin structure and gene expression is time and cost prohibitive. To address this, we propose a computational approach to predict SV impacts on genome folding, which can help prioritize causal hypotheses for functional testing. We develop a weighted scoring method that measures chromatin contact changes specifically affecting regions of interest, such as regulatory elements or promoters, and implement it in the SuPreMo-Akita software. With this tool, we rank hundreds of de novo SVs (dnSVs) from autism spectrum disorder (ASD) individuals and their unaffected siblings based on predicted disruptions to nearby neuronal regulatory interactions. This reveals that putative cis-regulatory element interactions (CREints) are more disrupted by dnSVs from ASD probands versus unaffected siblings. We prioritize candidate variants that disrupt ASD CREints and validate our top-ranked locus using isogenic excitatory neurons with and without the dnSV, confirming accurate predictions of disrupted chromatin contacts. This study suggests that disrupted genome folding is a potential genetic mechanism in a subset of ASD cases and provides a general strategy for prioritizing variants predicted to disrupt regulatory interactions across tissues.
The human genome is folded into organized and hierarchical three-dimensional (3D) structures that span DNA loops, which bring two loci together; topologically associating domains (TADs), which insulate contact from surrounding regions; and compartments, which delineate regions of the genome based on activity. This complex multilayered system plays a critical role in regulating gene expression, in part by controlling the interactions between promoters and distal regulatory elements. Advancements in chromosome conformation capture technologies, such as Hi-C (van Berkum et al. 2010) and Micro-C (Krietenstein et al. 2020), have enabled the understanding of the interplay between the 3D genome and cellular function. Disruption of chromatin structures can lead to pathogenic rewiring of regulatory interactions of disease-associated genes (Krumm and Duan 2019). For example, the fusion of two TADs can cause enhancer hijacking, whereby a gene in one TAD becomes regulated by a new enhancer and is differentially expressed. Furthermore, chromatin organization of neuronal cells plays a critical role in brain development and the onset of neurological disorders (Zagirova et al. 2024), and recent work has shown that de novo promoter variants within TADs containing ASD genes are significantly associated with autism risk (Nakamura et al. 2024).
Structural variants (SVs)—a class of mutations encompassing large deletions, insertions, duplications, inversions, chromosomal rearrangements, or combinations of these—have the potential to disrupt 3D genome structures and cause disease (Sikic 2023; Weischenfeldt and Ibrahim 2023). Germline SVs have been shown to cause gene misregulation and contribute to cancer and developmental diseases such as limb malformations (Symmons et al. 2016), X-Chromosome inactivation (van Bemmel et al. 2019), limb morphogenesis (Kragesteen et al. 2018), congenital malformations (Kraft et al. 2019), branchiooculofacial syndrome (Laugsch et al. 2019), Fragile X syndrome (Sun et al. 2018), and Cooks syndrome (Kurth et al. 2009). This evidence highlights the phenotypic consequences of disrupted genome structure in development and suggests the importance of further investigating SVs that alter genome folding as a potential causal mechanism in genetic disorders with poorly understood causes.
Because disrupted genome structure that leads to misexpression of critical genes has been characterized in many developmental disorders, we hypothesize that this mechanism is present in autism spectrum disorder (ASD). ASD is a class of neurodevelopmental conditions with complex causes that span environmental risk factors and genetics (Chaste and Leboyer 2012), with approximately equal contribution (Huguet et al. 2016). Although the heritability is estimated to be 40%–80% (Rylaarsdam and Guemez-Gamboa 2019), the genetic mechanisms are largely not understood, with 80% of cases remaining without a genetic cause (Geschwind 2011). Most studies that investigate the genetic causes of ASD focus on identifying common risk variants, mostly single-nucleotide polymorphisms (SNPs) (Grove et al. 2019) or small insertions or deletions (indels). However, small sample sizes do not have enough statistical power to identify rare or low-risk variants, which can only be characterized if they fall on candidate risk genes (Iossifov et al. 2014; More et al. 2023) but otherwise have largely unknown effects. Evaluating the effect of rare variants is important because de novo mutations have been strongly implicated in ASD (Iossifov et al. 2014; An et al. 2018; Short et al. 2018; Satterstrom et al. 2020) and are estimated to contribute to ∼10% of ASD cases (Huguet et al. 2016). Furthermore, de novo variants are more likely to be causal in simplex families, in which only one offspring has been diagnosed with ASD. Some studies evaluated de novo variants using machine learning (ML) models to predict their effects on gene expression and found proband variants to be more damaging than those of siblings (Zhou et al. 2019; Kelley 2020). As this work did not include SVs, there is a need for further evaluation of de novo structural variants (dnSVs) in ASD.
To evaluate ASD variants with unknown contribution to the disorder, we sought to predict if they disrupt chromatin organization nearby neuronal developmental genes. Functionally characterizing variants requires individually evaluating their effect on gene expression and the accompanying mechanism, which is experimentally infeasible at scale owing to time and cost limitations. To overcome this, ML models can be used with in silico mutagenesis (ISM) to predict variant deleteriousness at scale and prioritize candidate variants for experimental evaluation. One such model is Akita, a convolutional neural network (CNN) that predicts high-resolution contact frequency maps for multiple cell types from genomic sequence alone with very high accuracy (genome-wide test set average mean squared error [MSE] = 0.14, Spearman's R = 0.56) (Fudenberg et al. 2020). By making and comparing predictions for sequences with and without a mutation, ISM with Akita enables researchers to score its effect on 3D genome structure. For example, Akita accurately predicted how sequence variants that arose during hominid evolution altered genome folding in human versus chimpanzee neural progenitor cells (NPCs) (Keough et al. 2023). We previously developed SuPreMo-Akita (Gjoni and Pollard 2024), a computational pipeline that streamlines ISM with Akita, allowing us to test massive numbers of rare and complex variants for their effects on genome structure and prioritizing variants and generating testable hypotheses about their effects on disease-relevant genes.
However, SuPreMo-Akita does not specifically identify changes in genome folding that affect gene regulatory interactions. To address this limitation, we combined a weighted scoring SuPreMo-Akita framework, leveraging excitatory neuron (ExN) PLAC-seq data (Song et al. 2020) to evaluate the effects of dnSVs present in ASD individuals (Belyeu et al. 2021) versus unaffected sibling controls, with CRISPR-engineered induced pluripotent stem cell (iPSC)–derived ExNs to validate model predictions in one locus. The results provide a proof of concept for prioritizing variants of unknown significance for their effects on chromatin interactions and generating testable hypotheses.
Results
Large ASD dnSVs disrupt genome structure
In this study, we used dnSVs from simplex families in the Simons Foundation Autism Research Initiative (SFARI) Simons Simplex Collection (SSC) cohort (Fischbach and Lord 2010; Belyeu et al. 2021). Variants from ASD probands (n = 521) and their unaffected siblings (n = 348) were previously called from short-read whole-genome sequencing (Belyeu et al. 2021). We scored these variants for their predicted effects on 3D genomic contacts in the surrounding region using previously published SuPreMo-Akita (Methods) (Fig. 1A; Supplemental Table S1; Gjoni and Pollard 2024). As a part of this pipeline, contact frequency maps that correspond to the reference and alternate allele and the surrounding region are compared using Spearman's correlation (hereafter referred to as correlation). The resulting score (1 − correlation) is a measure of how disruptive each variant is to genomic contacts in the surrounding ∼1 Mb region. If the variant has no effect, the correlation is close to one, and the score is approximately zero. Disruption scores were generated for a subset of dnSVs that are compatible with SuPreMo-Akita based on their length, type, and region (Methods; Supplemental Fig. S1A). Across the 598 scored variants, the mean disruption score was higher for proband dnSVs than for sibling dnSVs (Fig. 1B; Supplemental Fig. S1B). Although statistically significant, the effect size is small (Cohen's d = 0.18), and the difference is driven by a subset of highly disruptive variants rather than a global shift. The disruption score distributions for both groups are left skewed, with most variants resulting in low disruption to genome folding, consistent with other studies generating ISM disruption scores with Akita (Gunsalus et al. 2023; Gjoni et al. 2025). But the highest-scoring variants (1 − correlation > 0.2) include more proband than sibling dnSVs (14% vs. 7% of dnSVs from each group), suggesting that the difference in means is driven by high-scoring variants. Overall, high-scoring variants are found in 15% of probands and only 8% of siblings.
ASD dnSVs are predicted to be more disruptive to 3D genome folding than controls. (A) SuPreMo-Akita workflow for scoring variant disruption to genome folding. Variant information is inputted into SuPreMo-Akita, which in turn generates reference and alternate sequence pairs and inputs those into Akita. It then processes the resulting maps and compares them to generate disruption scores. (B) Distribution of disruption scores for dnSVs from probands (pink) and siblings (blue). Mann–Whitney U test P-value is 0.039 and Cohen's d is 0.18. (C) Disruption scores plotted against dnSV length. P-value of linear model predicting scores from length (red line) is shown. Dashed black lines are length cutoffs for the four categories in C and D. (D) Disruption scores across variant length quantiles, Q1–Q4, for proband and sibling dnSVs. Length quantile cutoffs are 147 bp, 3976 bp, and 32,549 bp. Numbers of dnSVs per quantile are as follows: 78 and 72 in Q1, 77 and 73 in Q2, 97 and 51 in Q3, and 97 and 53 in Q4 for probands and siblings, respectively. (E) Disruption scores across variant types, including both proband and sibling dnSVs: (DUP) duplications, (DEL) deletions, (CPX) complex variants, and (INV) inversions. Tukey HSD FDR-corrected P-value between DUP and DEL is 8.3 × 10⁻⁴. (F) SV length across SV types. Tukey HSD FDR-corrected P-value between DUP and DEL is 2.5 × 10⁻⁷. (G) Disruption scores across length quantiles for probands (left) and sibling (right) dnSVs separated by whether the variant coordinates overlap at least one CTCF binding site (purple) or not (gray) using ChIP-seq data from ExNs. Mann–Whitney U test FDR-corrected P-value for Q4 is 0.006 and 0.630 for proband and sibling dnSVs, respectively.
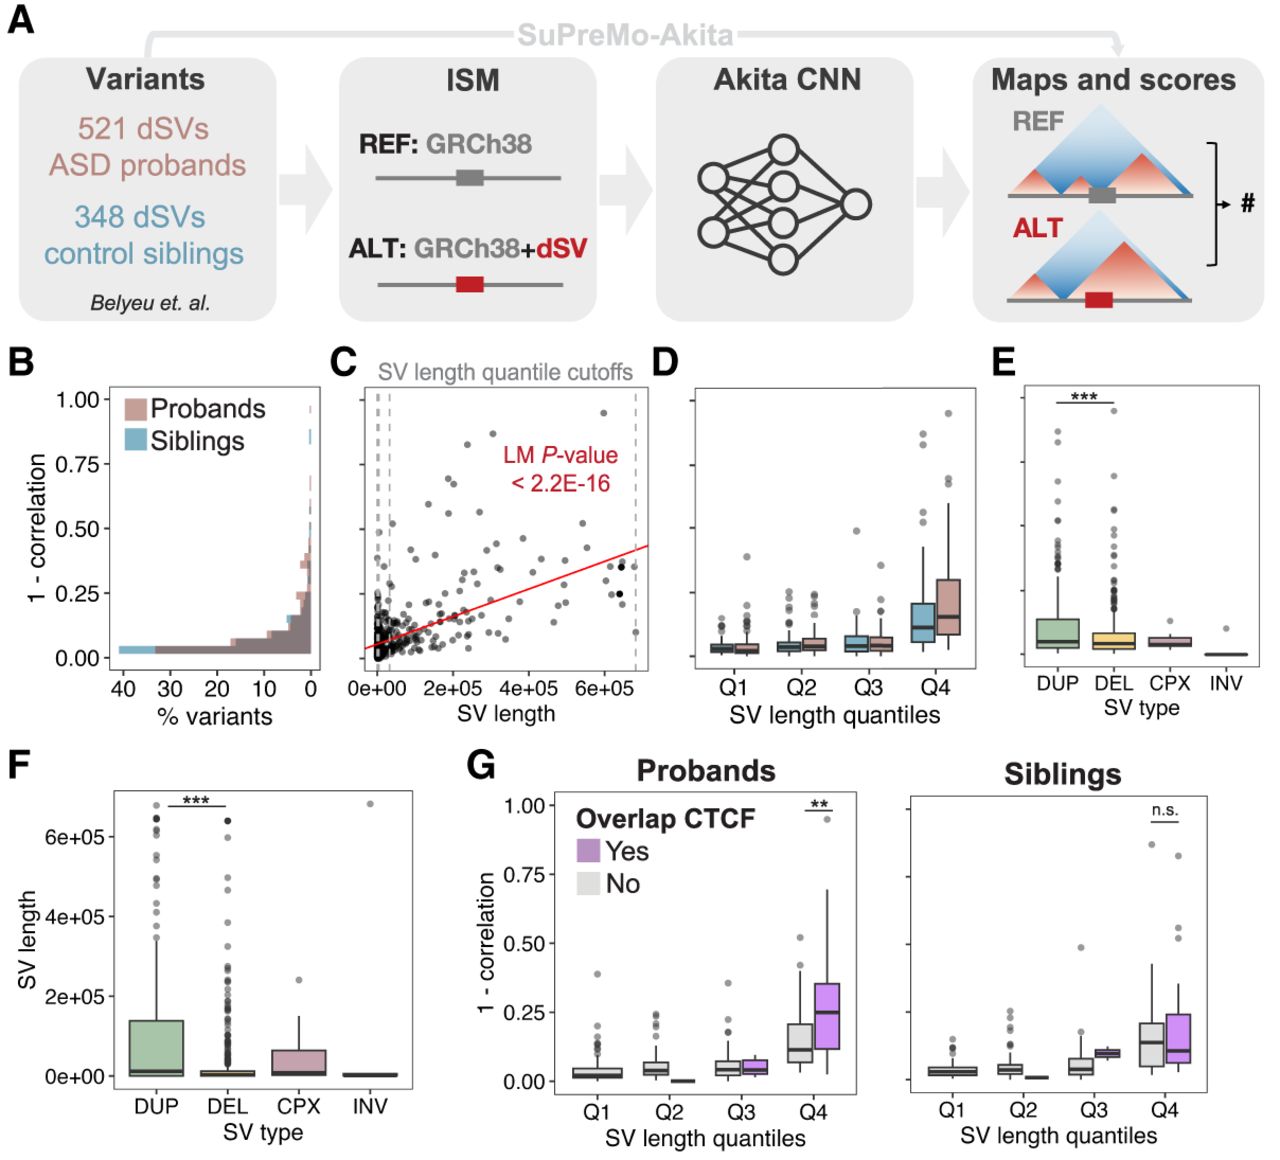
To understand factors that contribute to high-scoring proband dnSVs, we looked at how scores relate to the variant length, its type, and functional features that it overlaps. We find that dnSV length is positively correlated with disruption scores, with longer variants causing bigger changes to genomic contacts (Fig. 1C). We therefore grouped variants by their length quantiles to ensure the differences between proband and sibling dnSVs are not solely caused by length differences. When controlling for dnSV length, we find that the difference between proband and sibling dnSVs is driven by larger variants from the fourth length quantile (Fig. 1D). This further supports the idea that large variants are driving these differences, whereas smaller variants are similarly damaging in probands versus siblings. Next, we evaluated how disruption scores compare across variant types and found significant differences, namely, that duplications are the most disruptive and inversions the least (Fig. 1E). This trend could be partially explained by dnSV length because duplications are also the largest variants in this data set, whereas inversions are the smallest (Fig. 1F). Nonetheless, these trends do not contribute to the difference in scores between proband and sibling dnSVs because the two groups have similar distributions of variant types (Supplemental Fig. S1C,D).
We then evaluated whether genome structure disruption scores are related to variant overlap with CTCF binding sites, epigenetic marks, or disruption scores from other sequence-based models or to the polygenic risk scores of the individuals carrying them. We categorized dnSVs by length quantiles and found that large high-scoring dnSVs have a stronger CTCF and H3K27ac ChIP-seq signal than low-scoring large dnSVs, whereas there is no difference in signal for other epigenomic marks such as ATAC-seq and H3K27me3 and H3K4me1 ChIP-seq (Supplemental Fig. S1E). Given that CTCF contributes to genome structure through cohesin-mediated loop extrusion, we expected variants that disrupt CTCF binding to result in larger changes to genome folding. Although we see this pattern across both proband and sibling dnSVs, the association is stronger in probands (Supplemental Fig. S1F). Interestingly, long dnSVs are significantly more disruptive when overlapping CTCF in probands but not in siblings (Fig. 1G). This suggests that proband dnSVs disrupt CTCF binding sites that are more important for genome folding and result in more consequential changes when disrupted compared with sibling dnSVs. Next, we compared Akita disruption scores to those from another sequence-based model, DeepSEA, which predicts various chromatin profiles excluding genome structure. Although there were a few variants that were ranked highly from both methods, for example, a variant ranked through DeepSEA's H3K27me3 score in H1-hESCs, overall Akita disruption scores were poorly correlated with DeepSEA scores (less than 0.15 across all tracks), underscoring that Akita captures complementary information (Supplemental Fig. S1G).
Lastly, we checked if an individual's ASD polygenic risk score (Weiner et al. 2017) is associated with their dnSV disruption score or dnSV length to find that this is not the case in probands or siblings (Supplemental Fig. S1H,I). Taken together, these results show that proband dnSVs are slightly but significantly more damaging to chromatin organization compared with the unaffected sibling dnSVs, at least partially owing to disruption of CTCF binding sites, suggesting that disrupted genome folding might play a role in the genetic etiology of ASD.
ASD dnSVs disrupt neighboring neuronal regulatory element contacts
To focus our scoring approach on variants in which the altered chromatin contacts affect regulatory elements and their target genes, we defined putative cis-regulatory element interactions (CREints) as chromatin interactions that are within the ∼1 Mb prediction window and correspond to the promoter of an expressed gene (Methods) (Supplemental Fig. S2A). To apply this approach to ASD, we used H3K4me3 PLAC-seq and RNA-seq data from primary ExNs (Song et al. 2020), the cell type most implicated in the disorder (Willsey et al. 2022). We observed that proband but not sibling noncoding dnSVs are enriched near CREints (Supplemental Fig. S2B). This suggests that although these variants do not directly impact any coding sequences, they have potential to alter regulatory interactions of genes expressed in ExNs.
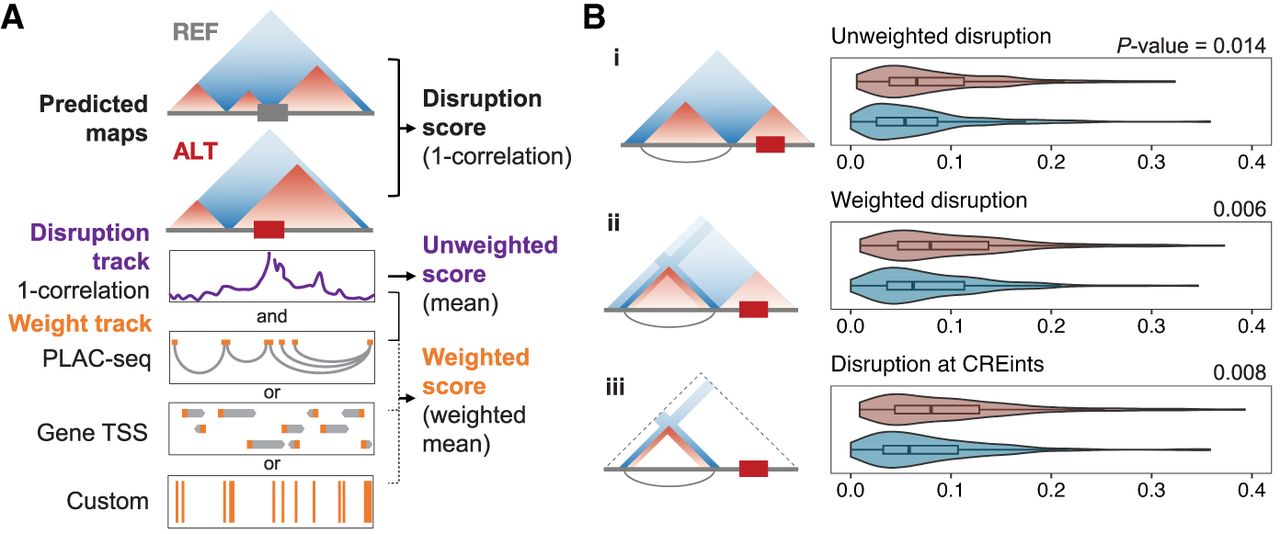
Motivated by this observation, we sought to specifically evaluate the effect of dnSVs on gene regulation by generating scores that only reflect disrupted interactions at CREint anchors (putative promoter and regulatory element). We developed a weighted scoring method that is flexible to various annotation types and can be tuned to emphasize regions of interest (ROIs) while still considering changes within the locus (Methods) (Fig. 2A). Instead of comparing the maps as a whole, we calculated disruption scores by averaging the disruption at each bin in the prediction window (Fig. 2A, disruption track in purple). This allows for calculating the weighted average by multiplying the disruption track by an ROI weight track before taking the mean (Fig. 2A, weight track in orange). The weight track upscales disruptions at bins corresponding to ROIs by a user-specified amount. Weighted disruption scores are lower than unweighted scores when there is less disruption at ROI bins versus the rest of the map (Supplemental Fig. S2C, i), greater than unweighted scores when there is more disruption at ROI bins (Supplemental Fig. S2C, ii), and similar to unweighted scores when ROI and non-ROI bins have similar disruption values (Supplemental Fig. S2C, iii).
Neuronal regulatory element interactions are indirectly disrupted by variants in ASD. (A) Schematic of SuPreMo-Akita implementation of weighted scoring. Unweighted score is the mean of the disruption track (purple). For the weighted score, each value in the disruption track is multiplied by the corresponding value of a weight track (orange; several options shown) before taking the average for the window. The weight track may be generated from PLAC-seq paired regions, custom input regions, or transcription start sites (TSSs). If PLAC-seq data are inputted, it will be processed to filter and condense loops (Methods) (Supplemental Fig. S2A). (B) Disruption scores for a subset of dnSVs that are close enough to CREints to both be in the same Akita prediction window. Scores, from top to bottom, correspond to scores without weighting (i), scores in which CREint anchors are upweighted 10-fold (ii), and scores only comparing contacts involving CREint anchors (iii). These distributions show that differences between probands and siblings are greater with weighted scores that utilize CREints.
To easily and scalably apply weighted scoring to the ASD dnSV data set and to make it accessible for others working with models beyond Akita, we incorporated the method into the SuPreMo pipeline. In sum, we added inputs for ROIs and the scaling factor, the Akita-prediction cell type, and the extent to shift the prediction window for each variant to include ROIs. To input ROIs and scaling factors, arguments “‐‐roi” and “‐‐scale” can be used to provide regions to upweight and the amount by which to upweight, respectively. These ROIs can be PLAC-seq paired regions, custom regions, or TSSs, for example (Methods) (Fig. 2A). To include neighboring ROIs in the prediction window, the “‐‐shifts” parameter can be used to specify the up- or downstream shifting amount for each variant. This shifting feature also makes SuPreMo compatible with models, like ExPecto (Zhou et al. 2018), that require centering a TSS instead of the variant. The adapted SuPreMo pipeline with all these modifications was released as version 2 (V2) on GitHub (Methods).
With this tool in hand, we turned back to evaluating dnSVs likely to change chromatin contacts that affect neuronal CREints in ASD probands and unaffected siblings. We focused on the 319 dnSVs that are near at least one CREint. Our original scores did not show significant differences between probands and siblings for this subset of dnSVs (Mann–Whitney U test P-value 0.36). We then paired each dnSV with all the nearby CREints and used custom shifting to make predictions centering each dnSV and CREint pair (Methods). We calculated unweighted and weighted disruption scores for each pair and kept the highest score for each dnSV. We used all of the CREints in the window for weighting, but we found that using only the paired CREint for each window did not change the trends we observed. Although we see a significant difference between proband and sibling dnSV unweighted scores (P-value = 0.014) (Fig. 2B, i), weighted scores enhance this difference both when upweighting CREints by 10-fold (P-value = 0.006) (Fig. 2B, ii) and when only scoring bins at CREint anchors (P-value = 0.008) (Fig. 2B, iii). Additionally, there are more proband dnSVs with higher weighted versus unweighted scores (50% of dnSVs) compared with siblings (36%) (Supplemental Fig. S2D,E). These data suggest that proband dnSVs are more disruptive at CREints and are therefore more likely to have a functional impact in ExNs. For the majority of variants, if scores at CREints were higher than unweighted scores, CREint scores were the highest, further supporting that changes are concentrated at CREint anchors (Supplemental Fig. S2E). In summary, we found that proband dnSVs are more disruptive to neuronal promoters and their distal regulatory elements compared with sibling dnSVs and that predicted changes in chromatin contacts in disrupted loci are concentrated on the regulatory interactions. These results further support our hypothesis that proband dnSVs contribute to ASD partially through 3D genome folding disruption.
Prioritizing candidate dnSVs likely to affect ASD genes
Our SuPreMo-Akita weighted disruption scores produced a testable hypothesis for each dnSV about what regulatory interactions it may alter in neurons. Genome editing and iPSCs provide experimental tools for investigating these hypotheses. Because generating stable, isogenic cell lines is currently relatively low throughput, we sought to prioritize a small number of dnSVs with compelling evidence in support of functional characterization. To do so, we compiled information about the variant, the prediction, and the proband, organizing these data into seven required and five optional criteria. These criteria prioritize disruptive dnSVs near, but not overlapping, ASD genes; have robust Akita predictions; and occur in probands without a high risk variant elsewhere in their genome (Methods) (Supplemental Fig. S3A). Most dnSVs meet four to five of the required criteria, and typically proband dnSVs meet more criteria compared with sibling dnSVs (Supplemental Fig. S3B). Nine dnSVs passed all seven required criteria and were evaluated both on the five optional criteria and on qualitative characteristics, such as visually inspecting how strong the changes are, where they fall with respect to ASD genes, and how PLAC-seq loops support the prediction (Methods).
With this selection process, we identified three proband dnSVs that have the potential to contribute to ASD by misregulating associated genes through 3D genome folding disruption (Supplemental Fig. S3C). First, a 160 bp deletion in Chromosome 17 (Supplemental Fig. S3C, i) lowers contact frequency at and near RAI1 (arrows), a high-confidence and syndromic SFARI gene (Banerjee-Basu and Packer 2010). RAI1 is a transcriptional regulator of the circadian clock involved in embryonic development and neural differentiation (Huang et al. 2016). In another proband, a 2 Mb duplication encompasses RAI1 further supporting its association with ASD. This deletion overlaps a MYO15A exon, but the gene is lowly expressed in ExN and is not relevant in ASD. Second, a 1.6 kb deletion in Chromosome 9 (Supplemental Fig. S3C, ii) results in slightly decreased contacts of STXBP1 (arrows), a high-confidence SFARI candidate involved in 49 ASD cases that plays a role in neurotransmitter release (Banerjee-Basu and Packer 2010). Of note, this variant was found in a proband that also has a missense mutation in an exon of SNX14, a syndromic SFARI gene, which might contribute to their genetic cause of ASD. This is an intronic deletion in NIBAN2 and overlaps two ExN H3K27ac peaks. Lastly, a 23 kb deletion in Chromosome 10 (Supplemental Fig. S3C, iii) lies in a locus rich with neurodevelopmental genes, including the following: PPP3CB, which is downregulated in two in vivo ASD models (Liu et al. 2023; Xia et al. 2024); CAMK2G, which is linked to neurodevelopmental disorders and associated with ASD; and P4HA1, which was found to be associated with ASD in a de novo risk score analysis (An et al. 2018). The deletion overlaps eight exons of USP54, which is not involved in ASD or neurodevelopment and has a very low probability of loss of function (pLI = 0), suggesting this heterozygous deletion may not affect USP54 protein function. Although the deletion does not overlap any ExN regulatory marks, it removes a CTCF binding site, suggesting that the mechanism behind the changed contact maps includes the loss of an insulating boundary. Indeed, disruption scores from tiled 1 bp deletions across the dnSV recapitulate the CTCF motif (Supplemental Fig. S5A), also highlighting Akita's ability to capture the grammar of genomic determinants of 3D genome folding. Together, these features made this Chromosome 10 variant the strongest candidate of the five and prompted us to experimentally test the predictions.
In vitro variant model validates predictions and suggests transcriptomic impact
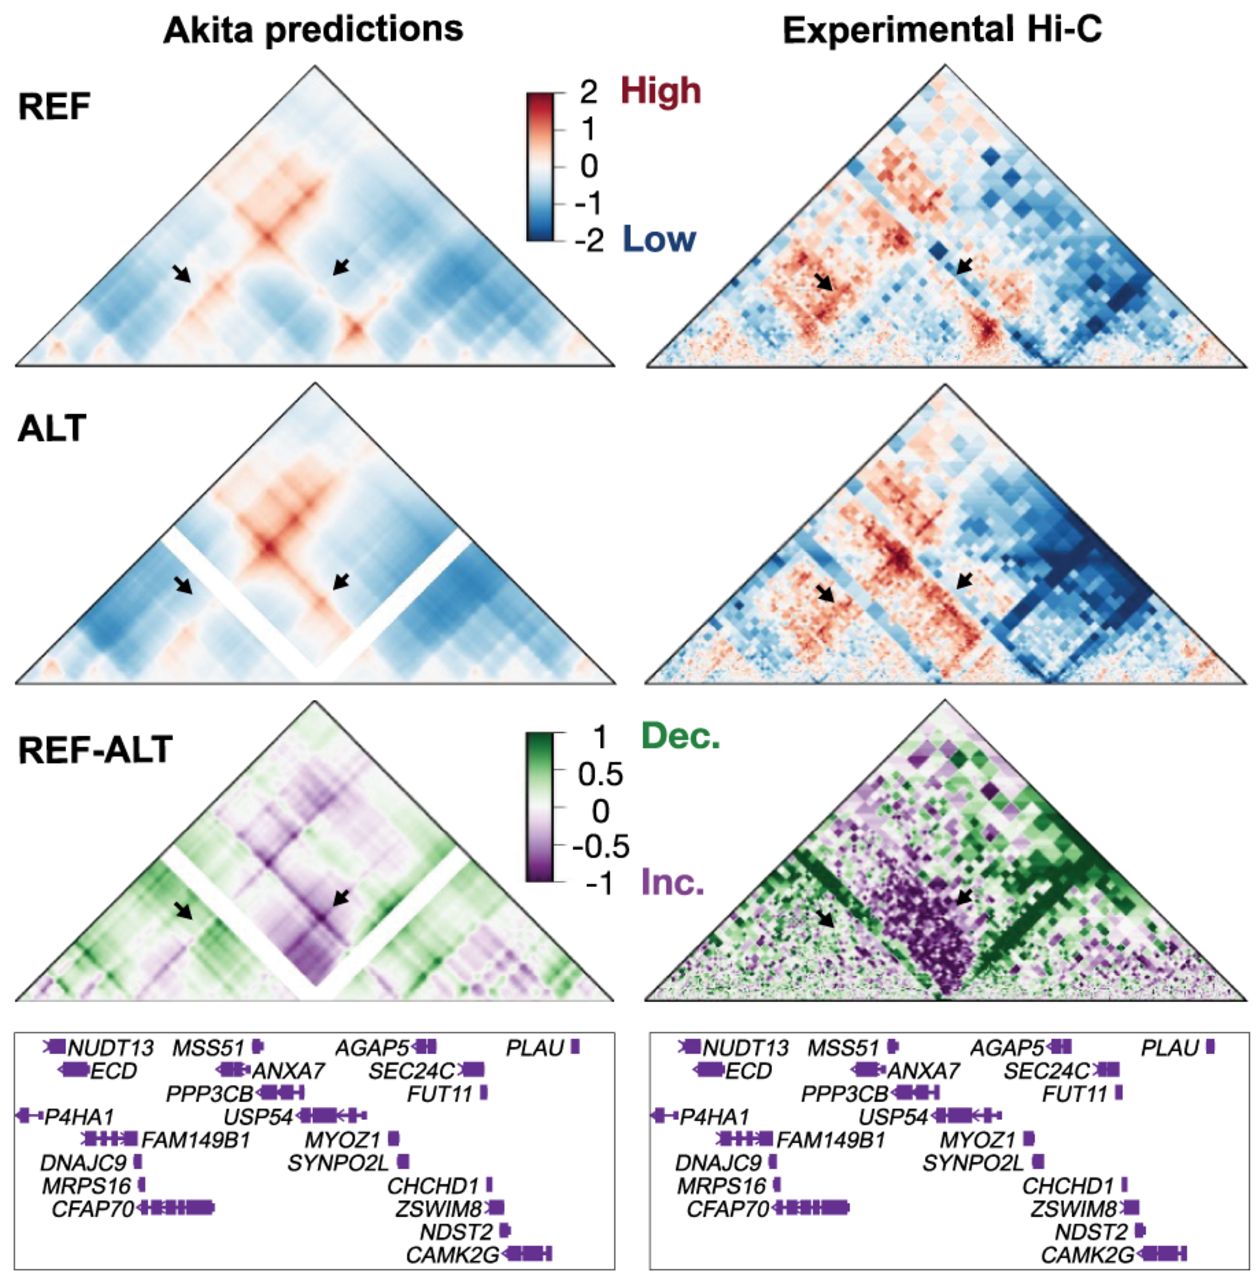
Because regulatory interactions are likely to vary across cell types, neuronal chromatin folding patterns are different from nonneuronal cells (Zagirova et al. 2024), and ASD largely affects ExNs, we characterized the Chromosome 10 proband dnSV in WTC11 i3N iPSC-induced ExNs. Using a CRISPR-Cas9-mediated deletion in the WTC11 i3N iPSC line (Wang et al. 2017), we generated two clonal cell lines with a homozygous deletion similar to the variant (“full deletion”; Methods) (Supplemental Fig. S4A; Supplemental Table S2), allowing us to isolate the effects of the deletion on genome folding without being influenced by an unedited copy. In contrast to the variant in the proband, which affects exons 11–18, is in frame, and should result in a partial mRNA expression of 14 exons of USP54, the engineered clones harbor a deletion of part of exon 13 and exons 14–18 and result in an early stop codon with in-frame transcription resuming after the deletion, including exons 19–22 (Supplemental Fig. S4B,C). USP54 is involved in ubiquitin-proteasome-dependent proteolysis and is expressed in primary ExNs (TPM = 16) (Song et al. 2020). We differentiated two unedited (WT) and the two isogenic full deletion clones into ExNs and performed Hi-C to evaluate chromatin interactions (Methods). The contact frequency map from WT ExNs matched the Akita prediction from the reference human genome fairly well (Spearman's correlation = 0.61), and the observed effect of the deletion on the map was highly similar to our prediction for the proband variant (Fig. 3). Namely, the overall pattern of the strengthened contact (purple) between the TAD boundaries, the decreased contact (green) of the upstream boundary with inter-TAD regions (left arrow), and increased contact of the downstream boundary with inter-TAD regions (right arrow) are consistent between the prediction and experimental Hi-C data, despite a few quantitative differences in which the experiment indicates larger effects. To test whether the predicted changes were because of the deleted CTCF binding site specifically, we generated two additional clonal cell lines in which only the CTCF ChIP-seq peak was deleted (“CTCF deletion”) (Supplemental Fig. S4A–C). Both reference and CTCF deletion contact frequency maps matched Akita predictions, resulting in a similar, but less strong, effect as the full deletion (Supplemental Fig. S5B,C). The more striking changes caused by the full deletion suggest that although the CTCF binding site plays a role in chromatin interactions in this locus, additional sequences within the full ASD dnSV likely also contribute.
Convolutional neural network (CNN) correctly predicted effect of an ASD deletion on chromatin contacts. Predicted (left) and experimental (right) contact frequency maps for the reference genome (top), reference genome with the 23 kb Chromosome 10 deletion (middle), and the difference between the two (bottom). Genes in the corresponding ∼917 kb region are shown below maps. Arrows point to two regions with changes in contact.
To evaluate the effect of the Chromosome 10 deletion on gene expression, we performed RNA-seq on cell lines from all three conditions (two WT, two full deletion, two CTCF deletion). We first evaluated the effect of the deletions on USP54 and found that its transcription continued after both deletion types (Supplemental Fig. S6A). A principal component analysis (PCA) of the gene expression data clearly separated all three editing conditions (Supplemental Fig. S6B). It is unclear how much of the separation between the full deletion and CTCF deletion cell lines is owing to the strength of the variant-caused contact change or the differing effect on USP54. We focus our next analyses on the full deletion because it is similar to the variant found in the proband, and the in vitro changes are most likely to mirror its expected effect. We then performed a genome-wide differential gene expression analysis and found that the full deletion resulted in 1102 differentially expressed genes (DEGs) (Supplemental Fig. S6C; Supplemental Table S3). Interestingly, full deletion DEGs are enriched for GO terms involving neuron development, differentiation, and function when using all expressed genes as a background (Supplemental Fig. S6D; Supplemental Table S4). They are also enriched for ASD genes (Supplemental Fig. S6E,F). Although the damaged USP54 transcript likely imparts some differential expression signal, we do not see enrichment of genes from the ubiquitin-proteasome-dependent proteolysis pathway in either deletion cell line (Supplemental Fig. S6E,F), suggesting it is not a dominant driver. Because the deletion overlaps neither PLAC-seq loops nor NPC H3K27ac and H3K4me3 ChIP-seq peaks (Supplemental Fig. S7A), the effects do not seem to be caused by direct removal of regulatory elements. To further assess coordinated transcriptomic effects, we performed a weighted gene coexpression network analysis and identified 43 gene coexpression modules, of which four were significantly associated with the deletion cell line (Supplemental Fig. S7B). All four modules included at least one gene that is within 5 kb of the deletion (included in Fig. 3), and three of them included DDIT4. The turquoise module, which had the most genes near the deletion, was strongly enriched for neurodevelopmental processes such as neuron differentiation, axon development, and axonogenesis (Supplemental Fig. S7C). Overall, the transcriptomic effects of the Chromosome 10 deletion cell model further support its potential to affect the function of neuronal cells.
Given these broad transcriptional changes and the lack of direct regulatory element disruption, we next asked whether altered 3D genome contacts could underlie the observed misregulation. We speculate that changes in genomic folding caused by the deletion may perturb long-range regulatory interactions, misregulating genes near the breakpoint and triggering cascading transcriptomic effects genome-wide.
Interestingly, the full deletion did not affect the expression of genes within the ∼1 Mb Akita prediction window; however, Hi-C data allow us to evaluate potential effects beyond this narrow range. These long-distance effects include regions with important neurodevelopmental genes such as DDIT4, which lies 1.2 Mb from the dnSV and may be influenced by altered chromatin contacts (Supplemental Fig. S8A). We observe downregulation of DDIT4 in the full deletion cell line (Supplemental Fig. S8B), suggesting that perhaps DDIT4 dysregulation, regardless of direction, may disrupt neuronal homeostasis and contribute to ASD risk. DDIT4 is a part of the mTOR signaling pathway, genes from which are enriched in the full deletion DEGs (odds ratio = 6; chi-squared P-value = 2.2 × 10⁻¹⁴) (Supplemental Fig. S8C), suggesting that a subset of DEGs is caused by DDIT4 downregulation. The CTCF deletion cell lines also showed similar contact changes at DDIT4 and decreased expression, although both these changes are less pronounced than in the full deletion (Supplemental Fig. S8A,B). Although the role of the 3D genome folding changes caused by the full deletion on gene expression is unclear, these data suggest a scenario in which the variant impacts DDIT4 expression by disrupting its distal regulatory contacts and, in turn, misregulating an array of genes in its pathway. Other nearby DEGs that could have a similar effect are SPOCK2, which is thought to be involved in neurogenesis, and UNC5B, which is involved in embryogenesis and nervous system development. This is one possible mechanism, and it remains speculative. More work needs to be done to link the differences in genomic contact to differences in gene expression and ultimately to ASD.
Discussion
Here, we assess the impact of ASD-associated SVs on genome organization and introduce a pipeline for prioritizing variants that may contribute to the disorder by disrupting distal regulatory interactions. We enhance the SuPreMo-Akita pipeline with two new features to evaluate the effects of variants on specific nearby ROIs. This software tool and our proof-of-principle analyses will enable variant prioritization for other cohorts and biological contexts. Our analyses of ASD probands and their unaffected siblings support a modest but consistent, hypothesis-generating signal that a subset of ASD dnSVs preferentially disrupt regulatory chromatin interactions, particularly those involving promoters of neuronal genes. Notably, we identified several candidate ASD de novo deletions predicted to affect genome folding near risk genes. We validated one of our predictions using CRISPR genome editing and iPSC-derived ExN cells, demonstrating that a 23 kb deletion overlapping a CTCF binding site increases contacts between previously insulated genomic regions. This deletion results in misregulation of neurodevelopmental genes across the genome and may be implicated in the proband's diagnosis, although further studies are needed to confirm this; a patient variant causing changes in chromatin contacts, even with accompanying gene expression changes, does not directly implicate the variant in ASD. We examined publicly available neuronal Hi-C data sets, and although we found the general pattern at the prioritized loci to match the Akita predictions, the resolution was insufficient for quantitative comparison. Other high-scoring dnSVs remain to be tested experimentally.
Finding appropriate controls for SVs, such as random length-matched SVs or ones from healthy individuals, is challenging because of their likelihood of falling in protected regions or being generally smaller. Studying variants in simplex families is especially valuable because the unaffected siblings share the same genetic background as the proband, enhancing the relevance of our comparisons. However, siblings are still more likely to possess damaging variants compared with unrelated individuals, reflecting the genetic complexity of ASD and the challenges in diagnosis. Indeed, we found examples of sibling dnSVs that are predicted to disrupt contacts of neuronal genes, even though they may not be causal for ASD. Consequently, we did not expect drastic differences in variant effects between probands and siblings, nor did we expect disruptive dnSVs to be present in all probands. Despite these challenges, the ability to detect significant differences in disruption scores is encouraging and underscores the robustness of our findings. This is the first evidence at a cohort scale that disrupted genome folding may play a role in ASD.
Studying large SVs poses significant challenges. Large variants are likely to contain many potentially causal elements (genes, enhancers, chromatin boundaries) that are difficult to disentangle computationally. Furthermore, results may be less reliable for dnSVs with low-confidence calls, potentially impacting the statistical power of our cohort-wide analyses. When it comes to experimental modeling, recapitulating large heterozygous variants, such as the 23 kb deletion on Chromosome 10, is constrained by factors like PAM site availability, gRNA efficiency, and allelic differences. The WTC11 cell line lacks sufficient heterozygous SNPs for allele-specific Hi-C analysis that would mirror Akita's allele agnostic predictions. To address these issues, we introduced a homozygous deletion. Although this approach does not directly model the heterozygous patient and may overestimate gene expression changes, it is a practical way to effectively isolate and confirm the impact of the deletion on genomic contacts. Because of gRNA efficiency limitations, the CRISPR-induced deletion results in an early stop codon that disrupts transcript continuity, differing from the in-frame deletion present in the proband. Despite these limitations, the generated clonal cell line closely models the variant's effects in neurons. Because USP54 is not a known ASD or neurodevelopmental gene and because it is not functionally associated with the DEGs we detected, we hypothesize that USP54 is a bystander gene and that the DEGs result from downregulation of DDIT4 and/or other neuronal genes affected by the dnSV. Though, we cannot disentangle contributions from altered 3D folding, loss of CTCF insulation, disruption of unmarked regulatory elements, or changes to USP54 transcript structure, all of which may contribute to the observed effects. Furthermore, because our experimental system uses homozygous deletions, the magnitude of expression changes may overestimate the effects of the heterozygous proband variant. Future work focused on engineering a more precise heterozygous deletion could provide further insights into gene expression changes and help identify potential functional phenotypes.
This work introduces a pipeline for prioritizing candidate disease variants and generating testable hypotheses regarding their functional impact. Its application to ASD demonstrates that variant-induced alterations in genome folding may contribute to the disorder and identifies a candidate causal deletion. Ultimately, teasing apart ASD's complex etiology will require a holistic understanding of variant effects. This may include new genetic underpinnings, which our study aims to predict with ML. Our study aims to clarify the genetic underpinnings of such disorders by individually characterizing variant effects with the SuPreMo-Akita workflow. Our updated software enables this strategy to be efficiently applied to other genetic diseases and biological contexts to generate and prioritize testable hypotheses about potentially causal variants.
Future work could enhance SuPreMo's utility by integrating it with other predictive models and annotating variants based on their impact on epigenetic modifications and gene expression. Developing models with better cell type specificity than Akita is a priority, because disease variants are expected to have tissue-specific effects. Publicly available neuronal Hi-C data sets were examined but were too low-resolution for quantitative analysis. We mitigated this limitation by utilizing publicly available ExN PLAC-seq and ChIP-seq data to prioritize ASD variants and interpret Akita predictions, followed by validations in ExNs. Following a similar strategy, the current pipeline can immediately be applied to nonneuronal cell types and other disorders. Looking ahead, a cell type–specific Akita model and other future refinements to the SuPreMo ISM pipeline would further enhance our ability to uncover new disease-associated variants for experimental validation. Because our experimental validation is currently limited to a single locus, the generalizability of SuPreMo-Akita predictions in ASD remains to be established and will require testing of additional loci. As experimental validation approaches become more precise and high-throughput, it will be possible to test large numbers of SuPreMo predictions and utilize the results to iteratively improve sequence-based variant prediction models like Akita. We envision an increased yield of genome editing studies enabled by ML models that prioritize variants among the huge number that could be tested, advancing our understanding of the molecular mechanisms underlying a wide array of genetic disorders.
Methods
Previously published data sources
SFARI SSC proband and sibling dnSVs were previously called from short-read whole-genome sequencing data using the GATK-SV pipeline (Belyeu et al. 2021; Collins et al. 2021). PLAC-seq data are from primary human mid-gestational ExNs (Song et al. 2020). ExN epigenetic data were downloaded from publicly available sources. ChIP-seq data are from ENCODE with the following data set IDs: ENCSR489QDF for CTCF, ENCSR201NXK for H3K27me3, ENCSR818PER for H3K27ac, and ENCSR411ZUA for H3K27me3. NPC Hi-C data were previously published (Keough et al. 2023). ASD genes are cataloged from three different data sets: SFARI genes (Banerjee-Basu and Packer 2010), risk genes from an exome sequencing study (Satterstrom et al. 2020), and genes found from de novo risk scores (An et al. 2018). Gene exon coordinates used are from GENCODE v46 (Frankish et al. 2019).
Akita model
Akita (Fudenberg et al. 2020) is a CNN model that predicts the chromatin interaction map for an input DNA sequence using no other information. The model was trained using deeply sequenced experimental Hi-C and Micro-C data from five cell lines (HFF, H1hESC, GM12878, IMR-90, HCT116) and processed at 2048 bp resolution into pairwise contact frequency maps using cooltools (log observed/expected contact frequencies for all pairs of 2048 bp bins) (Open 2C et al. 2024b). The input to Akita is ∼1 Mb (220 bp) of one-hot encoded DNA sequence. The model converts the sequence into a one-dimensional embedding, which is then transformed into a two-dimensional ∼1 Mb × ∼1 Mb contact map prediction at 2048 bp resolution. Akita was trained to minimize the MSE between experimental and predicted contact maps, achieving a genome-wide average MSE of 0.14 on held-out test set sequences (Pearson's R = 0.61, Spearman's R = 0.56). Performance across cell types depended slightly on sequencing depth of the experimental maps, with human foreskin fibroblast (HFF) cells being the best predicted. Only limited differences were detected between predictions for different cell types. This mirrors experimental maps, which are also largely similar across cell types, although further model optimization could potentially improve cell type specificity on those genomic loci that do show cell type differences in their chromatin interactions (see Discussion). Because none of the training cell types was a neuronal cell type, we opted to use predictions for HFF. As described below, we used ExN PLAC-seq and ChIP-seq data to further focus variant prioritization on effects in the developing brain.
Variant scoring with SuPreMo-Akita
To measure the predicted disruption on nearby chromatin contacts across 869 SVs, SuPreMo-Akita was used. For each SV, this pipeline takes the 1 Mb reference sequence surrounding the variant (center coordinate) and generates a 1 Mb mutated sequence with the alternate allele of the variant changed at the appropriate location. Both sequences are input to the Akita model, and the resulting contact frequency maps are padded and masked so that each 2048 bp bin from either map corresponds to a similar sequence. The remaining regions of the maps, those outside of the SV itself, are then compared using correlation and MSE. To get augmented scores, scores from four sequences were averaged: (1) no augmentation, (2) 1 bp right shift, (3) 1 bp left shift, and (4) the reverse complement. Of note, differences in scores across variant types could be partially owing to how SuPreMo-Akita scores different variant types; for instance, duplications are treated like insertions of the duplicated sequence at its 5′ end (Gjoni and Pollard 2024).
Variant exclusions
Only a subset of dnSVs were scored; they have to be above the length threshold, have known alternate allele sequences (deletions, inversions, duplications, and complex variants), and be in regions where the reference sequence is known. Scores represent changes in the region surrounding each variant, excluding the variant itself. As a result, the size of these regions varies depending on the size of the variant. This could overestimate the impact of very large variants, so we did not evaluate 73 variants >700 kb. These variants could be tested with genome folding prediction models that use larger input sequences, such as ORCA (Zhou 2022); however, the resulting predictions would be at much lower resolution and would preclude analysis of individual CREInts. Variants for which the alternate allele sequence is not known were excluded from the analyses, because Akita needs the exact sequence to generate a prediction. This includes insertions (SV types: Alu, LINE1, SVA, and INS) and translocations (SV type: CTX). SuPreMo filters out variants that are greater in length than two-thirds of the input sequence. Additionally, certain variants do not get a score because the region that they are in has a composition of unknown sequence of >5%. Because CPX variants are not compatible with SuPreMo, we wrote custom code to generate mutated sequences with those variants. However, these variant types are excluded from the CREint-weighted analyses (Fig. 2; Supplemental Fig. S2), because those analyses require using the SuPreMo pipeline. In total, we generated scores for 598 dnSVs.
Neuronal CREints
To annotate CREints, paired peak regions from primary human ExN PLAC-seq data were used (Song et al. 2020). Here, we refer to each pair of regions as a loop and each single region as a loop anchor. Loops were processed by grouping and filtering to generate ROIs for weighted scoring (Supplemental Fig. S2A). Only interchromosomal loops with anchors closer than 900 kb were considered, as limited by Akita, which outputs contact frequency maps corresponding to a 917,504 bp region. Then loops within 10 kb of each other were considered redundant and grouped together to result in fewer pairs and to better fit the Akita 2048 bp bin resolution. For all the pairs with the last left anchor, the right anchors that were within 10 kb were combined so that the new right anchor for all the pairs is the same and includes all the previous right anchors. The same process was done on the left anchors of pairs with the same right anchor. Although all of these steps are also a part of how SuPreMo processes inputted ROIs for weighting, in this study we also took additional filtering steps. We only kept CREints for which at least one anchor overlaps the promoter, defined as the 2 kb outside of the TSS, of genes expressed in ExNs (Song et al. 2020). Lastly, after pairing CREints with variants, we only kept ones in which both loops of the CREint and the variant are <900 kb and therefore fit in the prediction window. Note that any plotted CREints are not subject to this filtering but rather the initial PLAC-seq pairs. Although CREints may include nonregulatory contacts and introduce false positives (FPs), the FP rate will be consistent between probands and siblings, allowing for their fair comparison.
To calculate enrichment of dnSVs near CREints, the genome was split into 1 Mb bins, and each bin was annotated for whether it overlapped with a dnSV and a CREint region. A chi-squared test was used to calculate the P-value.
CREint weighted scoring
For weighting scores at ROIs, contact frequency maps were generated as described above. Instead of comparing the whole map, disruption tracks were generated by comparing each one-bin-wide column in the map and getting a list of 448 scores across all bins. Then a weight track was generated, which has a scalar value in bins that overlap ROI and one in the rest of the bins. The mean of the disruption track is the unweighted score, and the mean of the disruption track multiplied times the weight track is the weighted score. The weight track is generated by upscaling any bin that overlaps any ROI. ROIs can be given in the form of a BED file for a custom set of regions, such as accessible regions from ATAC-seq; a paired BED file, such as promoter contacts from PLAC-seq; or specification of “genes” that will use a 2 kb region centered at the TSS of every gene.
To find variants near CREints, CREints and variants were paired together if both CREint anchors and the variant were all with 900 kb. Pairs in which the variant overlapped either CREint anchor were removed. The resulting 3677 pairs were made up of 347 dnSVs and 2916 CREints. Disruption scores for this subset of dnSVs were extracted from the existing set of scores. Then, for each pair, a shift for the prediction window was calculated that would result in the pair being centered in the Akita input sequence. These shifted windows were scored using SuPreMo and 10-fold upweighting either all CREint anchors in the window or only anchors of the paired CREint. This resulted in a score for each dnSV–CREint pair, which was summarized into one score per dnSV by taking the maximum across all CREint pairs.
Criteria for variant prioritization
We used the following criteria for prioritizing candidate dnSVs.
These are required:
Not on ASD gene. Variant does not overlap ASD gene exon.
No causal dnSV. Proband does not have dnSV overlapping ASD gene exon.
Good prediction. Predicted maps for the reference genome around dnSV are similar to NPC experimental Hi-C maps. This includes dnSVs for which the MSE between the Akita predicted and the experimental contact maps is less than the 85th percentile of MSE across all scored variants.
No sibling dnSV. There are no similar variants in siblings. This includes proband dnSVs that do not overlap by more than half of the variant region with more than half of any sibling dnSV region.
CREint disruption. Variant results in changed contact at CREints. This includes dnSVs with weighted disruption scores at CREints (Fig. 2B, iii) larger than the 65th percentile across all standard scores (Fig. 1B).
Near ASD gene. Variant is within 500 kb of an ASD gene.
Disruptive. Variant is disruptive to 3D genome folding of surrounding regions. This includes dnSVs with disruption scores above the 65th percentile across all scores.
These are optional:
Not on expressed gene. Variant does not overlap expressed gene (TPM > 0.5) exon.
Not on ExN RE. Variant does not overlap ExN regulatory elements, namely, active enhancers (H3K27ac), poised enhancers (H3K4me1), and poised promoters (H3K27me3) as defined by their respective ChIP-seq peaks.
Change on CREint. Variant disruption focused on CREints, meaning the CREint weighted score (Fig. 2B, ii) is higher than the unweighted score (Fig. 2B, i).
On CTCF. Variant overlaps less than half of any ExN CTCF ChIP-seq peak.
Deletion. Variant is a deletion. These are the most straightforward to edit in cells.
Variants that passed all seven required criteria were qualitatively evaluated. The selected three deletions (Supplemental Fig. S3) were predicted to cause structural changes to the chromatin structure, as opposed to just changes in contrast. The changed contacts align with nearby ASD genes, and ExN PLAC-seq loops correspond well with Akita-predicted contacts. Additionally, the deletion that was selected for experiments had the most reproducible effect when augmenting maps with sequence shifting and reverse complement.
CRISPR-engineered cell lines
The isogenic clonal iPSC lines were made by CRISPR-Cas9 system-mediated deletion. The WTC11 i3N iPSC line with doxycycline-inducible Ngn2 integrated at the AAVS1 safe harbor locus was used as the parental line. We designed four sgRNAs using CHOPCHOP (https://chopchop.cbu.uib.no/) to delete the genomic region overlapping with the ASD variant and a CTCF site within the ASD variant. The designed sgRNAs (Supplemental Table S2) were in vitro transcribed using the precision gRNA synthesis kit (Invitrogen A29377), and Cas9-NLS protein was ordered from QB3 MacroLab at the University of California, Berkeley. We assembled the Cas9/sgRNA complex by incubating the in vitro transcribed sgRNAs and Cas9-NLS protein for 15 min at 20°C–25°C and delivered the complex into WTC11 i3N iPSCs using nucleofection (Lonza VPH-5012). After nucleofection, the cells were seeded into Matrigel-coated (Corning 354277) wells for recovery. Three to four days later, we sorted live cells into 96-well plates with one cell per well using fluorescence-activated cell sorting (FACS) to generate clonal cell lines. About 2 weeks later, the viable clones were expanded. Meanwhile, we extracted genomic DNA from each clone using QuickExtract DNA extraction solution (Biosearch Technologies QE09050) and checked the genotype of each clone using PCR and Sanger sequencing. This resulted in six clonal cell lines included in this paper: two WT, two full deletion, and two CTCF deletion, each a pair of biological replicates.
ExN differentiation
The WTC11 i3N iPSCs were cultured on Matrigel-coated (Corning 354277) plates and maintained in mTeSR plus media (STEMCELL Technologies 100-0276) and passaged with Accutase (STEMCELL Technologies 07920) and 10 µM ROCK inhibitor Y-27632 (STEMCELL Technologies 72302). The cells were grown with 5% CO2 at 37°C and verified mycoplasma-free using the MycoAlert mycoplasma detection kit (Lonza LT07-218). We differentiated the iPSCs into ExNs by using a two-step differentiation protocol. First, we cultured iPSCs on Matrigel-coated plates with predifferentiation media with doxycycline (2 µg/mL; Sigma-Aldrich D9891) for 3 days and changed the media daily. Three days later, the predifferentiated cells were dissociated with Accutase (STEMCELL Technologies 07920) and subplated on poly-L-ornithine-coated (15 µg/mL; Sigma-Aldrich P3655) plates with maturation media with doxycycline. Then, the maturation media was changed 7 days later by removing half of the media from each well and adding the same amount of fresh media without doxycycline. The differentiated neurons were collected 2 weeks after differentiation for experiments. The detailed protocol is accessible at the ENCODE portal (https://www.encodeproject.org/documents/d74fb151-366c-4450-9fa0-31cc614035f9/).
Hi-C
Hi-C libraries were generated using the Arima-HiC+ kit (P/N A101020) according to the manufacturer's protocol. Briefly, differentiated ExNs were fixed in culture plates with 2% PFA (Fisher Scientific F79-500) for 10 min at room temperature. About 0.5 million cells were used as input for each Hi-C library. The cross-linked chromatin DNA was treated with restriction digestion, biotinylation, and proximal ligation. The proximally ligated chromatin was sheared with a Covaris S220 sonicator to fragments between 300 and 1000 bp. The shared chromatin was then indexed with the Accel-NGS 2S plus DNA library kit (Swift Biosciences 21024) and amplified with KAPA library amplification kit (Roche KK2620). The final libraries were purified with AMPure XP beads (Beckman Coulter A63881) and sequenced on NovaSeq with paired-end 100 bp sequencing.
For analyzing Hi-C data, the 4DN processing pipeline was used as outlined: https://data.4dnucleome.org/resources/data-analysis/hi_c-processing-pipeline. In short, reads were mapped to GRCh38 using BWA v0.7.18 (Li and Durbin 2009). Valid Hi-C alignments were filtered using pairtools v1.0.3 (Open2C et al. 2024a) and returned to a .pairs file. Next, biological replicates were merged using https://github.com/4dn-dcic/docker-4dn-hic/blob/master/scripts/run-merge-pairs.sh. Lastly, the .pairs files were converted to .cool files using cooler v0.9.3 (Abdennur and Mirny 2020). Plotted maps from experimental Hi-C data are at a resolution of 1000 bp. Each biological replicate was also processed separately, and the replicates were visually compared at the variant locus and found to be highly similar.
For contact frequency map visualization, .cool files were preprocessed the same as the training data sets for the Akita model (Fudenberg et al. 2020; Krietenstein et al. 2020) to allow for easy visual comparison. Namely, Hi-C data were normalized with genome-wide iterative correction (ICE) (Imakaev et al. 2012). Then, using cooltools v0.7.1, the matrices were smoothed using adaptive coarsegraining, normalized for distance-dependent contact decay. The values were log-scaled and limited to (−2,2). Then, again using cooltools v0.7.1, they were linearly interpolated to fill missing values. Lastly, the maps were smoothed using astropy v5.2.2 (The Astropy Collaboration et al. 2022) convolution with a 2D Gaussian filter.
RNA-seq
RNA was extracted from 2-week-old ExNs differentiated from iPSCs using the RNeasy mini kit (Qiagen 74104). About 4 mg of extracted total RNA was used to prepare libraries for sequencing using the TruSeq stranded mRNA library prep kit (Illumina 20020594). Libraries were sequenced on NextSeq 2000 with paired-end 100 bp sequencing.
RNA-seq libraries, comprising six samples, were sequenced to an average depth of 8 × 10⁷ reads per sample. RNA-seq reads were aligned to GRCh38.112 using STAR v2.7.11b in gene annotation mode (Dobin et al. 2013). Alignment, RNA-seq, and insert size quality-control metrics were generated using Picard v3.1.1. Sample quality was assessed using FastQC v0.12.1 (http://www.bioinformatics.babraham.ac.uk/projects/fastqc/) and MultiQC v1.22.2 (Ewels et al. 2016).
Genes with more than two counts per million (cpm) in at least two of the six samples were retained for differential gene expression analysis. Filtered genes were tested for differential expression with DESeq2 v1.44.0 (Love et al. 2014) and considered significantly differentially expressed with an adjusted P-value < 0.05.
A Gene Ontology (GO) (https://bioconductor.org/packages/GO.db/) overrepresentation analysis was performed to test if DEGs from the full deletion are enriched in biological process (BP) terms compared with all expressed genes (R package clusterProfiler v4.8.3 and GO.db v3.18.0) (Wu et al. 2021). Enriched terms were defined by a Benjamini–Hochberg corrected P-value < 0.05 and more than 30 DEGs in the category (Supplemental Table S4).
A weighted gene coexpression network analysis (WGCNA v1.73) was performed to identify gene modules associated with full deletion status on six samples (two WT, two CTCF deletion, and two full deletion samples). Normalized counts from all six samples were used to construct an adjacency matrix (softPower = 6, selected by scale-free topology fit). Using the topological overlap distance matrix, genes were clustered into modules using dynamic tree cutting (deepSplit = 2, minClusterSize = 50) and merged by eigengene similarity, resulting in 43 modules. Deletion status was encoded as a binary variable and correlated with module eigengenes and gene expression using Pearson's correlation with Student's P-values. Four modules were significantly associated with the deletion, three of which contained DDIT4. GO enrichment analysis was performed for each module using the method described above. Because of the low sample size potentially causing modules to be unstable, these modules should be viewed as hypothesis generating rather than as definitive network structures.
Code availability
SuPreMo V2 code is available as Supplemental Code and at GitHub (https://github.com/ketringjoni/SuPreMo/).
Data access
All raw and processed sequencing data generated in this study have been submitted to the NCBI Gene Expression Omnibus (GEO; https://www.ncbi.nlm.nih.gov/geo/) under accession numbers GSE281283 and GSE281327 for Hi-C and RNA-seq, respectively.
Competing interest statement
The authors declare no competing interests.
Acknowledgments
We thank Ian Jones for guidance with PLAC-seq data analysis interpretation. We thank Shuzhen Kuang for input on Hi-C data analysis. We thank Jingjing Li for mentorship and feedback on the project. This project was funded by the National Institutes of Health (NIH) 4D Nucleome Project (grant U01HL157989), the NIH Office of the Director (grant R03OD034499), Additional Ventures, Achievement Rewards for College Scientists Scholarships, W.M. Keck Foundation, Biswas Family Foundation, Gladstone Institutes, and the Simons Foundation (grant SFI-AN-AR-Data Analysis-00019589).
Author contributions: K.G. helped conceive the project, performed most computational analyses, and prepared the manuscript and figures. X.R. performed all wet-laboratory experiments including CRISPR-Cas9 editing, cell differentiations, and sample preparation for Hi-C and RNA-seq. A.E. performed RNA-seq, differential expression, GO enrichment, and WGCNA analyses. Y.S. helped guide the project and managed the experiments. K.S.P. conceived and managed the project and edited the manuscript. All authors reviewed the manuscript.
Footnotes
[1] Supplementary material [Supplemental material is available for this article.]
[2] Article published online before print. Article, supplemental material, and publication date are at https://www.genome.org/cgi/doi/10.1101/gr.280394.124.
[3] Freely available online through the Genome Research Open Access option.
References
- ↵Abdennur N, Mirny LA. 2020. Cooler: scalable storage for Hi-C data and other genomically labeled arrays. Bioinformatics 36: 311–316. 10.1093/bioinformatics/btz540
- ↵An J-Y, Lin K, Zhu L, Werling DM, Dong S, Brand H, Wang HZ, Zhao X, Schwartz GB, Collins RL, 2018. Genome-wide de novo risk score implicates promoter variation in autism spectrum disorder. Science 362: eaat6576. 10.1126/science.aat6576
- ↵The Astropy Collaboration, Price-Whelan AM, Lim PL, Earl N, Starkman N, Bradley L, Shupe DL, Patil AA, Corrales L, Brasseaur CE, 2022. The Astropy Project: sustaining and growing a community-oriented open-source project and the latest major release (v5.0) of the core package. Astrophys J 935: 167. 10.3847/1538-4357/ac7c74
- ↵Banerjee-Basu S, Packer A. 2010. SFARI gene: an evolving database for the autism research community. Dis Model Mech 3: 133–135. 10.1242/dmm.005439
- ↵Belyeu JR, Brand H, Wang H, Zhao X, Pedersen BS, Feusier J, Gupta M, Nicholas TJ, Brown J, Baird L, 2021. De novo structural mutation rates and gamete-of-origin biases revealed through genome sequencing of 2,396 families. Am J Hum Genet 108: 597–607. 10.1016/j.ajhg.2021.02.012
- ↵Chaste P, Leboyer M. 2012. Autism risk factors: genes, environment, and gene-environment interactions. Dialogues Clin Neurosci 14: 281–292. 10.31887/DCNS.2012.14.3/pchaste
- ↵Collins RL, Brand H, Karczewski KJ, Zhao X, Alföldi J, Francioli LC, Khera AV, Lowther C, Gauthier LD, Wang H, 2021. Author correction: a structural variation reference for medical and population genetics. Nature 590: E55. 10.1038/s41586-020-03176-6
- ↵Dobin A, Davis CA, Schlesinger F, Drenkow J, Zaleski C, Jha S, Batut P, Chaisson M, Gingeras TR. 2013. STAR: ultrafast universal RNA-seq aligner. Bioinformatics 29: 15–21. 10.1093/bioinformatics/bts635
- ↵Ewels P, Magnusson M, Lundin S, Käller M. 2016. MultiQC: summarize analysis results for multiple tools and samples in a single report. Bioinformatics 32: 3047–3048. 10.1093/bioinformatics/btw354
- ↵Fischbach GD, Lord C. 2010. The Simons Simplex Collection: a resource for identification of autism genetic risk factors. Neuron 68: 192–195. 10.1016/j.neuron.2010.10.006
- ↵Frankish A, Diekhans M, Ferreira A-M, Johnson R, Jungreis I, Loveland J, Mudge JM, Sisu C, Wright J, Armstrong J, 2019. GENCODE reference annotation for the human and mouse genomes. Nucleic Acids Res 47: D766–D773. 10.1093/nar/gky955
- ↵Fudenberg G, Kelley DR, Pollard KS. 2020. Predicting 3D genome folding from DNA sequence with Akita. Nat Methods 17: 1111–1117. 10.1038/s41592-020-0958-x
- ↵Geschwind DH. 2011. Genetics of autism spectrum disorders. Trends Cogn Sci 15: 409–416. 10.1016/j.tics.2011.07.003
- ↵Gjoni K, Pollard KS. 2024. SuPreMo: a computational tool for streamlining in silico perturbation using sequence-based predictive models. Bioinformatics 40: btae340. 10.1093/bioinformatics/btae340
- ↵Gjoni K, Gunsalus LM, Kuang S, McArthur E, Pittman M, Capra JA, Pollard KS. 2025. Comparing chromatin contact maps at scale: methods and insights. Nat Methods 22: 824–833. 10.1038/s41592-025-02630-5
- ↵Grove J, Ripke S, Als TD, Mattheisen M, Walters RK, Won H, Pallesen J, Agerbo E, Andreassen OA, Anney R, 2019. Identification of common genetic risk variants for autism spectrum disorder. Nat Genet 51: 431–444 . 10.1038/s41588-019-0344-8
- ↵Gunsalus LM, Keiser MJ, Pollard KS. 2023. In silico discovery of repetitive elements as key sequence determinants of 3D genome folding. Cell Genom 3: 100410. 10.1016/j.xgen.2023.100410
- ↵Huang W-H, Guenthner CJ, Xu J, Nguyen T, Schwarz LA, Wilkinson AW, Gozani O, Chang HY, Shamloo M, Luo L. 2016. Molecular and neural functions of Rai1, the causal gene for Smith-Magenis syndrome. Neuron 92: 392–406. 10.1016/j.neuron.2016.09.019
- ↵Huguet G, Benabou M, Bourgeron T. 2016. The genetics of autism spectrum disorders. In A time for metabolism and hormones (ed. Sassone-Corsi P, Christen Y), pp. 101–129. Springer, Cham, Switzerland.
- ↵Imakaev M, Fudenberg G, McCord RP, Naumova N, Goloborodko A, Lajoie BR, Dekker J, Mirny LA. 2012. Iterative correction of Hi-C data reveals hallmarks of chromosome organization. Nat Methods 9: 999–1003. 10.1038/nmeth.2148
- ↵Iossifov I, O'Roak BJ, Sanders SJ, Ronemus M, Krumm N, Levy D, Stessman HA, Witherspoon KT, Vives L, Patterson KE, 2014. The contribution of de novo coding mutations to autism spectrum disorder. Nature 515: 216–221. 10.1038/nature13908
- ↵Kelley DR. 2020. Cross-species regulatory sequence activity prediction. PLoS Comput Biol 16: e1008050. 10.1371/journal.pcbi.1008050
- ↵Keough KC, Whalen S, Inoue F, Przytycki PF, Fair T, Deng C, Steyert M, Ryu H, Lindblad-Toh K, Karlsson E, 2023. Three-dimensional genome rewiring in loci with human accelerated regions. Science 380: eabm1696. 10.1126/science.abm1696
- ↵Kraft K, Magg A, Heinrich V, Riemenschneider C, Schöpflin R, Markowski J, Ibrahim DM, Acuna-Hidalgo R, Despang A, Andrey G, 2019. Serial genomic inversions induce tissue-specific architectural stripes, gene misexpression and congenital malformations. Nat Cell Biol 21: 305–310. 10.1038/s41556-019-0273-x
- ↵Kragesteen BK, Spielmann M, Paliou C, Heinrich V, Schöpflin R, Esposito A, Annunziatella C, Bianco S, Chiariello AM, Jerković I, 2018. Dynamic 3D chromatin architecture contributes to enhancer specificity and limb morphogenesis. Nat Genet 50: 1463–1473. 10.1038/s41588-018-0221-x
- ↵Krietenstein N, Abraham S, Venev SV, Abdennur N, Gibcus J, Hsieh T-HS, Parsi KM, Yang L, Maehr R, Mirny LA, 2020. Ultrastructural details of mammalian chromosome architecture. Mol Cell 78: 554–565.e7. 10.1016/j.molcel.2020.03.003
- ↵Krumm A, Duan Z. 2019. Understanding the 3D genome: emerging impacts on human disease. Semin Cell Dev Biol 90: 62–77. 10.1016/j.semcdb.2018.07.004
- ↵Kurth I, Klopocki E, Stricker S, van Oosterwijk J, Vanek S, Altmann J, Santos HG, van Harssel JJT, de Ravel T, Wilkie AOM, 2009. Duplications of noncoding elements 5′ of SOX9 are associated with brachydactyly-anonychia. Nat Genet 41: 862–863. 10.1038/ng0809-862
- ↵Laugsch M, Bartusel M, Rehimi R, Alirzayeva H, Karaolidou A, Crispatzu G, Zentis P, Nikolic M, Bleckwehl T, Kolovos P, 2019. Modeling the pathological long-range regulatory effects of human structural variation with patient-specific hiPSCs. Cell Stem Cell 24: 736–752.e12. 10.1016/j.stem.2019.03.004
- ↵Li H, Durbin R. 2009. Fast and accurate short read alignment with Burrows–Wheeler transform. Bioinformatics 25: 1754–1760. 10.1093/bioinformatics/btp324
- ↵Liu Z, Tan S, Zhou L, Chen L, Liu M, Wang W, Tang Y, Yang Q, Chi S, Jiang P, 2023. SCGN deficiency is a risk factor for autism spectrum disorder. Signal Transduct Target Ther 8: 3. 10.1038/s41392-022-01225-2
- ↵Love MI, Huber W, Anders S. 2014. Moderated estimation of fold change and dispersion for RNA-seq data with DESeq2. Genome Biol 15: 550. 10.1186/s13059-014-0550-8
- ↵More RP, Warrier V, Brunel H, Buckingham C, Smith P, Allison C, Holt R, Bradshaw CR, Baron-Cohen S. 2023. Identifying rare genetic variants in 21 highly multiplex autism families: the role of diagnosis and autistic traits. Mol Psychiatry 28: 2148–2157. 10.1038/s41380-022-01938-4
- ↵Nakamura T, Ueda J, Mizuno S, Honda K, Kazuno A-A, Yamamoto H, Hara T, Takata A. 2024. Topologically associating domains define the impact of de novo promoter variants on autism spectrum disorder risk. Cell Genom 4: 100488. 10.1016/j.xgen.2024.100488
- ↵Open2C, Abdennur N, Fudenberg G, Flyamer IM, Galitsyna AA, Goloborodko A, Imakaev M, Venev SV. 2024a. Pairtools: from sequencing data to chromosome contacts. PLoS Comput Biol 20: e1012164. 10.1371/journal.pcbi.1012164
- ↵Open2C, Abdennur N, Abraham S, Fudenberg G, Flyamer IM, Galitsyna AA, Goloborodko A, Imakaev M, Oksuz BA, Venev SV, 2024b. Cooltools: enabling high-resolution Hi-C analysis in Python. PLoS Comput Biol 20: e1012067. 10.1371/journal.pcbi.1012067
- ↵Rylaarsdam L, Guemez-Gamboa A. 2019. Genetic causes and modifiers of autism spectrum disorder. Front Cell Neurosci 13: 385. 10.3389/fncel.2019.00385
- ↵Satterstrom FK, Kosmicki JA, Wang J, Breen MS, De Rubeis S, An J-Y, Peng M, Collins R, Grove J, Klei L, 2020. Large-scale exome sequencing study implicates both developmental and functional changes in the neurobiology of autism. Cell 180: 568–584.e23. 10.1016/j.cell.2019.12.036
- ↵Short PJ, McRae JF, Gallone G, Sifrim A, Won H, Geschwind DH, Wright CF, Firth HV, FitzPatrick DR, Barrett JC, 2018. De novo mutations in regulatory elements in neurodevelopmental disorders. Nature 555: 611–616. 10.1038/nature25983
- ↵Sikic M. 2023. Facilitating genome structural variation analysis. Nat Methods 20: 491–492. 10.1038/s41592-023-01767-5
- ↵Song M, Pebworth M-P, Yang X, Abnousi A, Fan C, Wen J, Rosen JD, Choudhary MNK, Cui X, Jones IR, 2020. Cell-type-specific 3D epigenomes in the developing human cortex. Nature 587: 644–649. 10.1038/s41586-020-2825-4
- ↵Sun JH, Zhou L, Emerson DJ, Phyo SA, Titus KR, Gong W, Gilgenast TG, Beagan JA, Davidson BL, Tassone F, 2018. Disease-associated short tandem repeats co-localize with chromatin domain boundaries. Cell 175: 224–238.e15. 10.1016/j.cell.2018.08.005
- ↵Symmons O, Pan L, Remeseiro S, Aktas T, Klein F, Huber W, Spitz F. 2016. The Shh topological domain facilitates the action of remote enhancers by reducing the effects of genomic distances. Dev Cell 39: 529–543. 10.1016/j.devcel.2016.10.015
- ↵van Bemmel JG, Galupa R, Gard C, Servant N, Picard C, Davies J, Szempruch AJ, Zhan Y, Żylicz JJ, Nora EP, 2019. The bipartite TAD organization of the X-inactivation center ensures opposing developmental regulation of Tsix and Xist. Nat Genet 51: 1024–1034. 10.1038/s41588-019-0412-0
- ↵van Berkum NL, Lieberman-Aiden E, Williams L, Imakaev M, Gnirke A, Mirny LA, Dekker J, Lander ES. 2010. Hi-C: a method to study the three-dimensional architecture of genomes. J Vis Exp (39): 1869. 10.3791/1869
- ↵Wang C, Ward ME, Chen R, Liu K, Tracy TE, Chen X, Xie M, Sohn PD, Ludwig C, Meyer-Franke A, 2017. Scalable production of iPSC-derived human neurons to identify Tau-lowering compounds by high-content screening. Stem Cell Reports 9: 1221–1233. 10.1016/j.stemcr.2017.08.019
- ↵Weiner DJ, Wigdor EM, Ripke S, Walters RK, Kosmicki JA, Grove J, Samocha KE, Goldstein JI, Okbay A, Bybjerg-Grauholm J, 2017. Polygenic transmission disequilibrium confirms that common and rare variation act additively to create risk for autism spectrum disorders. Nat Genet 49: 978–985. 10.1038/ng.3863
- ↵Weischenfeldt J, Ibrahim DM. 2023. When 3D genome changes cause disease: the impact of structural variations in congenital disease and cancer. Curr Opin Genet Dev 80: 102048. 10.1016/j.gde.2023.102048
- ↵Willsey HR, Willsey AJ, Wang B, State MW. 2022. Genomics, convergent neuroscience and progress in understanding autism spectrum disorder. Nat Rev Neurosci 23: 323–341. 10.1038/s41583-022-00576-7
- ↵Wu T, Hu E, Xu S, Chen M, Guo P, Dai Z, Feng T, Zhou L, Tang W, Zhan L, 2021. clusterProfiler 4.0: a universal enrichment tool for interpreting omics data. Innovation (Camb) 2: 100141. 10.1016/j.xinn.2021.100141
- ↵Xia Q, Zheng H, Li Y, Xu W, Wu C, Xu J, Li S, Zhang L, Dong L. 2024. SMURF1 controls the PPP3/calcineurin complex and TFEB at a regulatory node for lysosomal biogenesis. Autophagy 20: 735–751. 10.1080/15548627.2023.2267413
- ↵Zagirova D, Kononkova A, Vaulin N, Khrameeva E. 2024. From compartments to loops: understanding the unique chromatin organization in neuronal cells. Epigenetics Chromatin 17: 18. 10.1186/s13072-024-00538-6
- ↵Zhou J. 2022. Sequence-based modeling of three-dimensional genome architecture from kilobase to chromosome scale. Nat Genet 54: 725–734. 10.1038/s41588-022-01065-4
- ↵Zhou J, Theesfeld CL, Yao K, Chen KM, Wong AK, Troyanskaya OG. 2018. Deep learning sequence-based ab initio prediction of variant effects on expression and disease risk. Nat Genet 50: 1171–1179. 10.1038/s41588-018-0160-6
- ↵Zhou J, Park CY, Theesfeld CL, Wong AK, Yuan Y, Scheckel C, Fak JJ, Funk J, Yao K, Tajima Y, 2019. Whole-genome deep-learning analysis identifies contribution of noncoding mutations to autism risk. Nat Genet 51: 973–980. 10.1038/s41588-019-0420-0