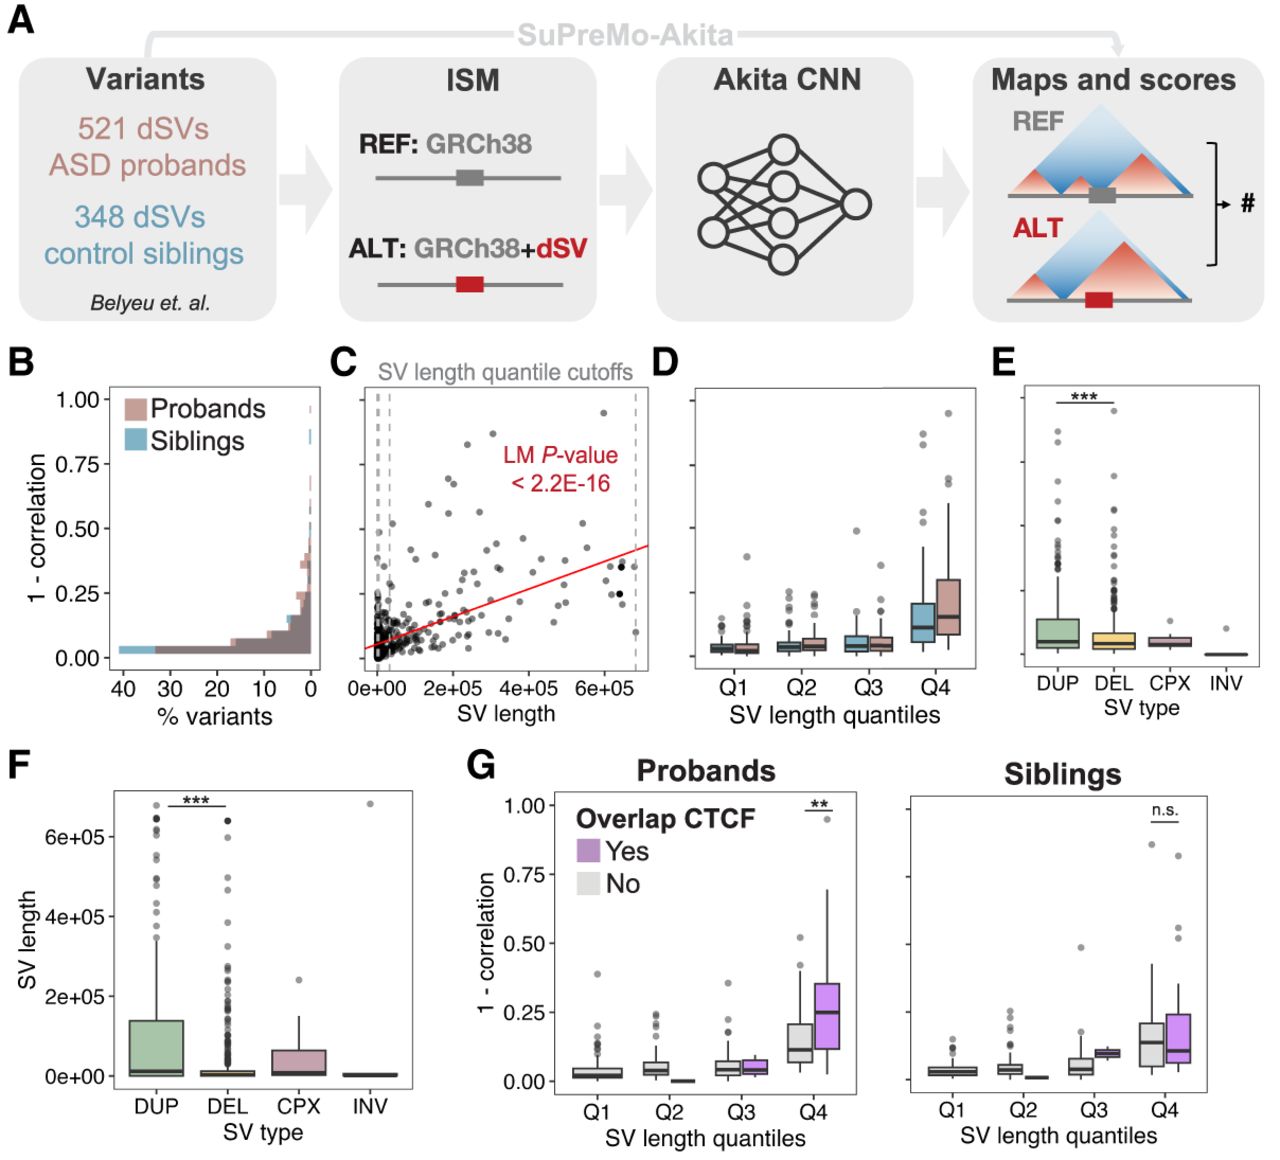
ASD dnSVs are predicted to be more disruptive to 3D genome folding than controls. (A) SuPreMo-Akita workflow for scoring variant disruption to genome folding. Variant information is inputted into SuPreMo-Akita, which in turn generates reference and alternate sequence pairs and inputs those into Akita. It then processes the resulting maps and compares them to generate disruption scores. (B) Distribution of disruption scores for dnSVs from probands (pink) and siblings (blue). Mann–Whitney U test P-value is 0.039 and Cohen's d is 0.18. (C) Disruption scores plotted against dnSV length. P-value of linear model predicting scores from length (red line) is shown. Dashed black lines are length cutoffs for the four categories in C and D. (D) Disruption scores across variant length quantiles, Q1–Q4, for proband and sibling dnSVs. Length quantile cutoffs are 147 bp, 3976 bp, and 32,549 bp. Numbers of dnSVs per quantile are as follows: 78 and 72 in Q1, 77 and 73 in Q2, 97 and 51 in Q3, and 97 and 53 in Q4 for probands and siblings, respectively. (E) Disruption scores across variant types, including both proband and sibling dnSVs: (DUP) duplications, (DEL) deletions, (CPX) complex variants, and (INV) inversions. Tukey HSD FDR-corrected P-value between DUP and DEL is 8.3 × 10⁻⁴. (F) SV length across SV types. Tukey HSD FDR-corrected P-value between DUP and DEL is 2.5 × 10⁻⁷. (G) Disruption scores across length quantiles for probands (left) and sibling (right) dnSVs separated by whether the variant coordinates overlap at least one CTCF binding site (purple) or not (gray) using ChIP-seq data from ExNs. Mann–Whitney U test FDR-corrected P-value for Q4 is 0.006 and 0.630 for proband and sibling dnSVs, respectively.