

Abstract
The clinical utility of PRS may be hindered by reliance on large, heterogeneous data sets for generation that dilute phenotypic specificity. Meanwhile, small, well-defined clinical cohorts (target) are ubiquitous but insufficient for PRS development. We propose an external-PRS (ePRS) framework borrowing from the transfer learning literature that integrates genetic evidence from target cohorts, incorporating continuous evidence measures and genetic correlation for robust predictions. Simulation indicates superior performance of ePRS across varying genetic correlations between the source and target phenotypes. ePRS refines an idiopathic generalized epilepsy (IGE) PRS to improve differentiation between juvenile myoclonic epilepsy (JME) and other IGE subtypes and, leveraging a large attention deficit hyperactivity disorder GWAS, enhances predictions for impulsivity in JME. Finally, to address concerns about potential cross-platform artifacts, we train and evaluate ePRS in the Canadian Cystic Fibrosis (CF) Gene Modifier Study cohort to predict CF-related diabetes using UK Biobank type 2 diabetes (T2D) summary statistics as the external source phenotype. ePRS continues to improve prediction accuracy in this single-cohort, harmonized-QC setting and offers more precise risk stratification and personalized care across complex traits.
One of the most promising genomic approaches for predicting complex traits to emerge from large biobank-scale data sets is polygenic risk scores (PRSs), a risk measure generated by aggregating effects of multiple genetic variants associated with a particular disease or trait (Choi et al. 2020). PRSs have demonstrated their validity in informing the genetic architecture of complex phenotypes (Ma and Zhou 2021) and shared genetic contributions across traits (Brikell et al. 2018). Although they have the potential to augment clinical diagnosis by enabling early detection and improved risk stratification for disease (Lewis and Vassos 2020), they have fallen short of delivering owing to a lack of evidence for clinical utility. Clinical utility refers to the ability to provide actionable information to improve health outcomes, distinct from clinical validity, which is the ability to predict disease status. The reliance on large biobank-scale data sets for construction of PRS may be the very reason for their limited utility in clinical practice. Here we explain this apparent contradiction, present a new tool to circumvent this barrier, and apply it to common subtypes of epilepsy and a comorbidity of cystic fibrosis (CF).
Although large sample sizes enable robust estimates of genetic effect sizes, large-scale data sets are often characterized by increased phenotypic heterogeneity that may include participants with self-reported conditions or broad diagnostic categories that do not align perfectly with more rigorously defined phenotypes used in clinical practice (Schoeler et al. 2023). This could dilute the statistical precision of the estimated genetic effects and limit generalizability of biobank-derived PRSs to the clinic. Consider heterogeneity within idiopathic generalized epilepsy (IGE) or type 2 diabetes (T2D), for which large genome-wide association studies (GWASs) exist (The International League Against Epilepsy Consortium on Complex Epilepsies 2018; Ghatan et al. 2024), but the T2D and IGE phenotype comprises distinct syndromes or pathways (i.e., juvenile myoclonic epilepsy [JME], juvenile absence epilepsy [JAE], epilepsy with generalized tonic–clonic seizures [EGTCS]) (Beniczky et al. 2025). Moreover, T2D shows some distinct and some genetic overlap with other diabetes phenotypes such as cystic fibrosis-related diabetes (CFRD) (Blackman et al. 2013), in which much smaller sample sizes are available owing to the rare nature of the disease. These IGE and diabetes phenotypes differ in their underlying genetic architecture, treatment responses, prognosis, and comorbidities (Moran et al. 2010; Rubboli et al. 2023). Therefore, constructing subtype- or syndrome-specific PRSs is critical before genetic prediction tools can be used to guide clinical care or stratify individuals for clinical trials.
Developing a JME-specific PRS is challenging because large (biobank-scale) cohorts of deeply phenotyped individuals with JME do not exist. Although deeply phenotyped clinical samples for JME exist, these are of modest size owing to the resources required for deep characterization of the phenotype and its comorbidities (Roshandel et al. 2023). For this reason, studies have opted to construct a general PRS, such as for IGE, and only test for its association with the subtype of interest (e.g., JME) without establishing and improving its predictive capacity to distinguish between different disease subtypes (JME vs. JAE) (Heyne et al. 2024). In particular, PRS developed for IGE can suffer from two distinct but related shortcomings when applied to a JME-specific cohort. First, an IGE-PRS is designed to differentiate individuals at risk of IGE from healthy controls, but its performance may deteriorate when used in individuals with JME owing to variations in the genetic architecture of epilepsy subtypes. These differences can also contribute to model instability if one or more syndromes are over- or underrepresented in the training data set. Second, an IGE-PRS is not designed to distinguish between different epilepsy subtypes, resulting in PRSs that are too general to guide personalized therapeutic decisions tailored to specific syndromes (Moreau et al. 2020). In clinical trials, JME-specific PRSs would also improve patient selection and phenotypic homogeneity, reduce sample size and costs, and increase chances of replicability.
Recent studies have shown that PRSs can be improved by incorporating external information or leveraging genetically related phenotypes (Mak et al. 2017; Chen et al. 2021; Zhao et al. 2022; Xu et al. 2023; Zhang et al. 2024). However, most existing approaches focus on transferring PRSs for the same phenotype across cohorts or are limited in the outcome types they can jointly model. Few methods focus specifically on adapting a general PRS—typically derived from large, heterogeneous data sets—to improve external validation on well-defined clinical cohorts with limited sample sizes, and none explore how effectively subtype-specific PRSs can distinguish between different clinical subtypes.
Adapting terminology from the transfer learning literature (Zhuang et al. 2021), we define JME or CFRD, for example, as the target phenotypes and the JME- or CF-specific cohort as the target data set. Meanwhile, an external phenotype derived from a large biobank-scale data set, such as IGE or T2D, is referred to as the source phenotype. Here, we introduce the external PRS (ePRS), a penalization framework that integrates effect size estimates for the target phenotype with statistical evidence (e.g., P-values) derived from large-scale GWAS on source phenotypes as penalized weights. We aim to leverage both designs—the small, well-characterized clinical sample and the large biobank-scale data with less phenotypic specificity—to strengthen the predictive capacity of PRS for diagnostics, for distinguishing subtypes in the clinic, and for clinical trials.
Our method differs from other methods in the literature in two key ways. First, an ePRS leverages a continuous measure of statistical evidence (−log10 pval) instead of forcing an arbitrary, binary cutoff threshold. Second, it provides a fail-safe mechanism for cases in which the source phenotype shares no overlapping genetic architecture with the target phenotype. We use simulations to evaluate how the ePRS performs as the genetic correlation between source and target phenotypes varies, including settings in which the source phenotype provides limited or no relevant information. Finally, we apply the ePRS to (1) refine an IGE-based PRS to improve its prediction of JME, enabling better distinction between JME and other epilepsy subtypes; and (2) use a large-scale attention deficit hyperactivity disorder (ADHD) GWAS to enhance PRS prediction for trait impulsivity in JME measured by the Barratt impulsivity scale (BIS), in which impulsivity is a component trait of ADHD and is elevated in individuals with JME (Shakeshaft et al. 2021); and (3) apply ePRS to CFRD by training and evaluating entirely within the Canadian CF Gene Modifier Study (CGMS) but borrowing from a large T2D GWAS, which also assuages any concerns that improvements in the JME-PRS could be driven by cross-cohort genotyping or QC differences.
Results
Simulation study
ePRS improves predictive performance on a deeply phenotyped cohort with limited sample size
Here, we demonstrate that ePRS can leverage source phenotypes with overlapping genetic architecture to improve predictive performance when only limited samples in the target cohort are available.
The simulated target phenotype cohort consists of 300 unrelated individuals, each with 1000 genetic variants used as predictors. GWAS summary statistics and the derived evidence measure Ej are obtained from a related phenotype within a large-scale external data set. In practice, to approximate a large, well-powered external GWAS without explicitly simulating tens of thousands of source samples, we treated the source phenotype as an idealized external reference and did not add nongenetic variance to the simulated source phenotype (Supplemental Material Sec. B). Across simulations, we explicitly model partially shared genetic architectures such that source and target phenotypes are generated with a shared component and phenotype-specific components, rather than assuming completely distinct architectures. We use the genome-wide genetic correlation rg as a controlled knob for the degree of effect-size sharing, spanning rg = 1 (highly shared) to rg = 0 (nonoverlapping). The genetic correlation between the two phenotypes ranges from zero to one, and model performance is evaluated using R2 (Supplemental Material Sec. B). In the simulation setup used for Figure 1A, the target phenotype was generated with residual noise (ε = 4), so the corresponding target-trait heritability is h2 = 0.714.
Simulation benchmarks of ePRS. Colors and line styles denote model type throughout the figure: blue, ePRS; orange, pruning and thresholding (P+T); black, elastic net (EN); and green, PRS derived from source GWAS summary statistics. Lines show smoothed mean performance across values of rg, and points indicate the values of rg at which performance was evaluated. In panel B, the red dashed horizontal line indicates random classification performance (AUC = 0.5). In panel C, the darker blue line indicates ePRS fitted using the true genetic correlation, and light blue indicates ePRS fitted using a fixed, misspecified genetic correlation. (A) ePRS demonstrates superior predictive performance against P+T, EN using the target phenotype cohort, and external GWAS summary statistics defined on the source phenotype (source). The simulated heritability of the target phenotype is h2 ≈ 0.7. (B) ePRS demonstrates stronger predictive capacity in differentiating between disease subtypes compared to conventional approaches including P+T and EN regression. Using GWAS summary statistics from the general phenotype would fail to distinguish between different subtypes, resulting in an AUC of 0.5, which is equivalent to random guessing (red dashed line). (C) Robustness of ePRS to misspecification of the genetic correlation rg. The x-axis shows the true genetic correlation used to generate simulated data, whereas ePRS is fit using either a fixed rg = 0.5 (light blue dashed curve) or the true rg (blue). EN is used as a reference because EN does not utilize rg. Misspecification leads to only modest attenuation in ePRS performance (blue/light blue remain close over the x-axis), and ePRS remains above EN except when the source and target phenotypes are uncorrelated. The simulated heritability of the target phenotype is h2 ≈ 0.7. (AUC) Area under the curve, (GWAS) genome-wide association study, (h2) heritability, and (rg) genetic correlation.
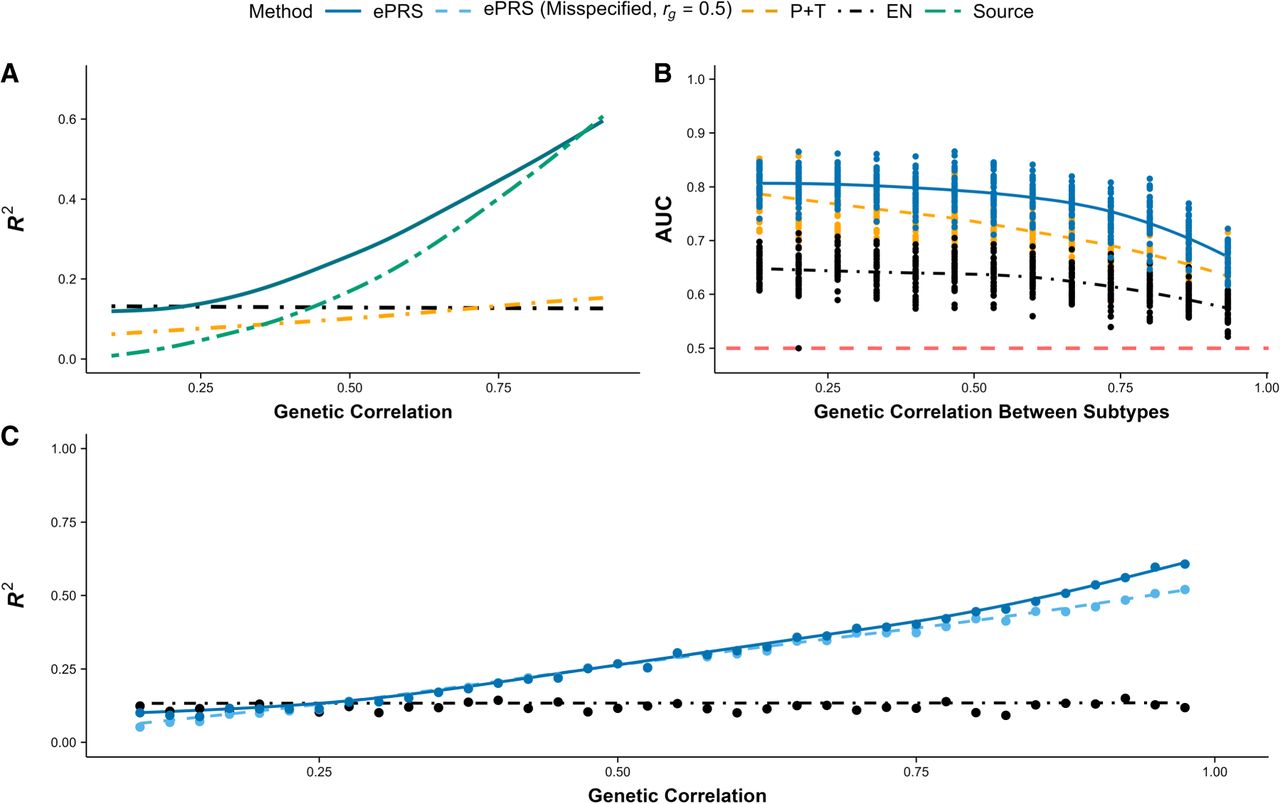
Figure 1A compares the predictive capacity of different models, with an ePRS (blue) demonstrating superior performance as genetic correlation (rg) varies from zero to one. Elastic net (EN) regression (black), which relies solely on the target phenotype cohort, maintains a consistent R2 regardless of rg but suffers from reduced model performance owing to the limited sample size. Pruning and thresholding (P+T; orange) leverages GWAS summary statistics from the source phenotype and optimizes the P-value threshold within the target cohort. However, this approach is overly restrictive as it misses many genetic variants that are specific to the target phenotype but absent from the source phenotype. Finally, naively employing external GWAS summary statistics defined on the source phenotype (source; green) performs exceptionally well when the phenotypes are highly correlated but fails dramatically when the correlation is low, as expected. In addition, we also benchmarked a globally weighted PRS that forms a linear combination of the target-only EN coefficients with the source GWAS coefficients, , with α ∈ [0, 1] selected via nested cross-validation within the target training data. Results for this weighted PRS baseline are shown in Supplemental Figure S12. As expected, weighted PRS becomes increasingly competitive as genetic correlation increases; however, when genetic correlation is low, tuning α in small target cohorts can be unstable, occasionally placing nontrivial weight on a poorly matched source signal (rg ≈ 0) and yielding worse out-of-sample performance than ePRSs.
An ePRS (blue) aims to balance these approaches, performing similarly to models that leverage related phenotypes when genetic correlation is high (rg → 1) while incorporating a fail-safe mechanism that increasingly relies on the target cohort when genetic correlation is low (rg → 0). As rg decreases from one to zero, the source phenotype becomes only weakly correlated with the target phenotype, which in turn provides less useful information for constructing a PRS specific to the target cohort. This is demonstrated through the naïve approach (GWAS from the source phenotype; green), in which its predictive capacity measured in R2 declines sharply as rg decreases from one to zero, eventually converging to zero when the external data set (source) offers no valuable information for predicting the phenotype of interest. Conversely, an ePRS increasingly relies on the target cohort when genetic correlation between the two traits weakens. The nonzero R2 observed at rg = 0 in Figure 1A arises from the predictive signal present in the target cohort's training set, not from the source phenotype. Although the predictive capacity of ePRSs also declines as rg → 0 owing to the limited sample size in the target cohort, it converges to the performance of EN as if only the target cohort was used without external data. In essence, rg functions as a fail-safe mechanism, ensuring that information from the source phenotype is disregarded when it offers no contribution to constructing clinically relevant PRS for the target phenotype.
ePRSs can differentiate between disease subtypes
Our goal extends beyond improving model performance for clinical cohorts versus controls, and we also aim to develop specific PRS that can differentiate between subtypes of a heterogeneous disease. The simulated target phenotype cohort includes 400 unrelated individuals, each with 1000 genetic variants used as predictors. Each individual is assigned a probability of developing the broad disease label (e.g., IGE) and, if diagnosed, is further classified into one of two distinct subtypes. The simulated causal variants for both subtypes are included within the set of causal variants for the general disease. This construction reflects a shared genetic background for the broad disease label, with additional subtype-differentiating effects (i.e., subtype-specific components acting on a shared background rather than completely distinct architectures). This means that although a GWAS on the general disease can capture genetic variants involved in the subtypes’ genetic architecture, it cannot differentiate between the subtypes. GWAS summary statistics and the derived evidence measure Ej are obtained from the general disease in a large-scale external data set. The genetic correlation between the two subtypes ranges from zero to one, and model performance for classifying the subtypes (binary) is measured using area under the curve (AUC; subtype assignment uses a liability-threshold model) (Supplemental Material Sec. B).
Figure 1B illustrates the performance of different models in distinguishing between two disease subtypes across a range of genetic correlation rg from zero to one. On the x-axis, rg represents genetic correlation between the two subtypes, whereas the genetic correlation between the target and source phenotypes (rg defined in Fig. 1A) remains fixed. The ePRS (blue) consistently demonstrates superior predictive performance, effectively separating the subtypes at all levels of genetic correlation between the disease subtypes. Unlike in Figure 1A, naively using GWAS summary statistics based on the broad disease label proves ineffective, yielding an AUC of 0.5 across all levels of rg. EN regression (black) suffers from reduced performance owing to its reliance solely on the target cohort, with its effectiveness further declining as rg increases, making subtype differentiation more challenging. P+T (orange) relies on estimated GWAS effect sizes and P-value threshold optimization from the target cohort, performing comparatively better by capturing genetic variants specific to the target phenotype. However, limited sample size can lead to unstable effect size estimates, and the lack of shrinkage (winner's curse) and consideration for linkage disequilibrium (LD) further diminishes its predictive power. The ePRS again seeks to balance these approaches by estimating variant effect sizes within the target cohort (subtype of interest) while applying shrinkage by incorporating GWAS summary statistics from the general phenotype as a form of penalization.
ePRSs improve model stability and deliver consistent performance compared with EN
Table 1 highlights model stability, measured by the standard error of R2 across 100 bootstrapped samples, with and without incorporating GWAS summary statistics from external data sets. ePRSs consistently enhance model stability across all levels of genetic correlation compared with EN, which relies solely on the target cohort without using external GWAS data. Although EN maintains consistent model stability regardless of rg, ePRSs increasingly benefit from stronger correlation between the source and target phenotypes, leading to a widening advantage in model stability. Although P+T performs more stably when the source and target phenotypes are highly correlated, ePRSs outperform P+T in both prediction tasks—JME risk prediction and subtype differentiation—as shown in Figure 1, A and B. ePRSs also demonstrate improved stability in estimated effect sizes and predicted individual risk within smaller target cohorts. Additional stability diagnostics are shown in Supplemental Figures S3, S4, and S5: We report bootstrap variability in predictive performance (Supplemental Fig. S3), stability and separation of estimated SNP effects for source-only/shared/target-only predictors (Supplemental Fig. S4), and stability of individual-level predicted risk across bootstrap resamples (Supplemental Fig. S5). Together, these show that improvements are not limited to mean AUC or R2 but also reflect more stable coefficient estimation and risk stratification in small target cohorts.
The ePRS improves model stability
| Standard error of model performance across 100 bootstrapped samples | |||
|---|---|---|---|
| rg between source/target phenotypes | ePRS | EN | P+T |
| 0.1 | 9.7% | 12.5% | 11.2% |
| 0.3 | 8.5% | 11.1% | 10.3% |
| 0.5 | 8.3% | 11.2% | 8.8% |
| 0.7 | 7.3% | 10.5% | 7.1% |
| 0.9 | 6.0% | 10.9% | 5.1% |
[i] Across all levels of genetic correlation, the ePRS shows smaller standard errors compared with elastic net (EN), which does not leverage genome-wide association study summary statistics defined on external sources. rg represents the genetic correlation between the source and target phenotypes, whereas model instability is measured by the standard error of the coefficient of determination (R2) across 100 bootstrapped samples. The most stable model for each rg is shown in bold. Although pruning and thresholding (P+T) demonstrates greater stability when the source and target phenotypes are highly correlated, the ePRS outperforms P+T in both prediction tasks: juvenile myoclonic epilepsy risk prediction and subtype differentiation, as shown in Figure 1, A and B.
ePRSs remain robust when the estimated genetic correlation is misspecified
Cross-trait LD score regression is known to be unstable with small sample sizes, resulting in variability in the estimated genetic correlation (rg). Therefore, ePRSs must be sufficiently robust to misspecified rg to generalize effectively to a target patient cohort with limited sample size. To assess robustness to rg misspecification, we vary the true genetic correlation used to generate simulated data from zero to one (Fig. 1C; x-axis) while fitting the ePRS with either a fixed value of rg = 0.5 (light blue dashed curve) or the true rg (blue), with the results shown in Figure 1C. The EN curve is shown as a reference because EN does not depend on rg. Misspecifying rg causes only a modest reduction in ePRS performance, and the ePRS remains robust relative to EN except when the source and target phenotypes are uncorrelated. Because cross-trait LD score regression provides a standard error along with the estimated rg, we recommend fitting the ePRS multiple times with estimated genetic correlation within the 95% confidence interval () to ensure model predictions remain consistent across all plausible values of rg. When no reliable external estimate of rg exists, it can be treated as a hyperparameter and selected via nested cross-validation within the training data. In the simulation setup used for Figure 1C, the target-trait heritability is likewise h2 = 0.7.
Improving PRSs for clinical application in JME
JME-specific PRSs from IGE GWAS
Individuals of European descent diagnosed with JME from the Biology of Juvenile Myoclonic Epilepsy (BIOJUME) study (n = 624) were included as cases, whereas a randomly selected sample of 3000 unrelated White British individuals without epilepsy from the UKBB served as controls. The combined data set was split into training (70%) and test (30%) sets for both cases and controls. Covariates included in each analysis are listed in Supplemental Table S2. All JME individuals included for this analysis were unrelated; thus, no relatives were split across training and test sets. Hyperparameters were selected using cross-validation within the training set only, and performance was reported on the held-out test set. GWAS summary statistics for IGE were obtained from a large-scale meta-analysis combining 24 different population cohorts (The International League Against Epilepsy Consortium on Complex Epilepsies 2018). JME-specific effect sizes were derived after applying ePRS on the training set, and its predictive performance was subsequently evaluated on the test set. Our objective is to generalize GWAS summary statistics derived from IGE, the source phenotype, to JME, the target phenotype cohort.
Table 2 compares the model performance of various competing methods in distinguishing individuals with JME from UKBB controls. The shared genetic architecture between JME and IGE is evident, as IGE-PRS, which uses GWAS summary statistics from the external meta-analysis for IGE, already performs well in distinguishing JME from the controls. However, our proposed ePRS outperforms both IGE-PRS and P+T, the latter of which relies solely on the target data set to estimate GWAS effect sizes and optimize the P-value threshold for maximizing predictive power. Although EN achieves predictive performance comparable to that of an ePRS, it shows greater variability across 50 different train-test splits derived from the target data set (±0.043 vs. ±0.021). The ePRS distinguishes itself by improving predictive capacity without compromising on model stability, even when only limited sample sizes are available.
Model performance (AUC) in distinguishing JME individuals from UKBB controls
| Performance metric | JME v. UKBB controls (AUC) |
|---|---|
| IGE-PRS | 0.74 |
| Pruning and thresholding | 0.78 |
| Elastic net | 0.848 ± 0.043 |
| ePRS | 0.874 ± 0.021 |
[i] The ePRS significantly outperforms both IGE-PRS and pruning and thresholding and demonstrates greater stability in model performance across 50 different train-test splits derived from the original target cohort (JME individuals and UKBB controls). (AUC) Area under the curve, (IGE) idiopathic generalized epilepsy, (JME) juvenile myoclonic epilepsy, and (UKBB) UK Biobank.
Table 3 compares the predictive capacity, measured by AUC, of various methods for subtype differentiation, specifically aiming to accurately identify individuals with JME from those with other epilepsy syndromes. IGE-PRS is not designed to differentiate between different epilepsies and performs no better than random guessing (∼0.5 AUC). The univariate P+T approach achieves moderate performance but is surpassed by multivariate methods such as EN and ePRS, which incorporate shrinkage effects and account for the correlation structure (e.g., LD). As seen in Table 2, EN continues to demonstrate comparable performance to ePRS on average, especially in differentiating JME from individuals with JAE; however, EN exhibits greater variability across different train-test splits, leading to greater uncertainty in its performance on any given data set. ePRS continues to stand out for its enhanced predictive accuracy and more consistent performance for subtype differentiation, especially when only limited sample sizes are available. Positive predictive values and log odds ratios (log ORs) across JME-PRS deciles, and sensitivity/specificity metrics are reported in Supplemental Figures S9, S10, and S11. It is important to note that although imperfect case-control matching may introduce spurious associations between JME cases and UK Biobank (UKBB) controls, this does not undermine the conclusion that ePRS provides a more refined PRS for JME and improves differentiation between JME and other non-JME epilepsies.
Model performance (AUC) in distinguishing between JME and the other epilepsy subtypes
| JME v. Non-IGE Epilepsies (AUC) | JME v. IGE Epilepsies (AUC) | |||
|---|---|---|---|---|
| Performance metric | RE | ESES | CAE | JAE |
| IGE-PRS | 0.51 ± 0.02 | 0.48 ± 0.02 | 0.50 ± 0.03 | 0.52 ± 0.02 |
| Pruning and thresholding | 0.60 ± 0.03 | 0.50 ± 0.03 | 0.61 ± 0.03 | 0.61 ± 0.04 |
| Elastic net | 0.60 ± 0.04 | 0.62 ± 0.04 | 0.62 ± 0.03 | 0.71 ± 0.04 |
| ePRS | 0.65 ± 0.02 | 0.66 ± 0.03 | 0.65 ± 0.03 | 0.69 ± 0.02 |
[i] IGE-PRS performs no better than random guessing as expected, whereas the ePRS significantly outperforms both IGE-PRS and pruning and thresholding. Although elastic net demonstrates comparable predictive performance with ePRS on average, it exhibits greater variability across different train-test splits, leading to greater uncertainty in its performance on any given data set. Epilepsy subtypes listed include rolandic epilepsy (RE), electrical status epilepticus in sleep (ESES), childhood absence epilepsy (CAE), and juvenile absence epilepsy (JAE). (IGE) idiopathic generalized epilepsy; (JME) juvenile myoclonic epilepsy.
A PRS for impulsivity in JME improved from an ADHD GWAS
Individuals of European descent with complete Barratt impulsiveness scale brief (BIS-brief) score ratings were included in the analyses (n = 324), which was divided into training (70%) and test (30%) sets. BIS-brief assesses impulsivity with an eight-item self-report instrument derived from the 30-item Barratt impulsiveness scale that provides a unidimensional total score ranging from eight to 32 (higher scores indicate greater trait impulsivity) (Steinberg et al. 2013). External GWAS summary statistics for ADHD were obtained from a large-scale case-control study (n = 55,374) (Demontis et al. 2019). We focus on BIS-brief because impulsivity is a clinically relevant comorbidity in JME and provides a quantitative target phenotype for evaluating cross‐phenotype transfer from ADHD GWAS results. BIS score-specific effect sizes were derived after applying the ePRS on the training set, and its predictive capacity was subsequently evaluated on the test set.
Table 4 compares the predictive performance of the ePRS with ADHD-PRS and EN. ADHD-PRS leverages GWAS summary statistics on ADHD and optimizes the P-value threshold directly on the target data set (training set only) for maximum prediction power. Moreover, the ePRS significantly outperforms EN while achieving comparable standard error across 50 different train-test splits of the target data set. Although the ePRS demonstrates superior performance compared with ADHD-PRS, using external GWAS summary statistics (ADHD-PRS) performs reasonably well compared with the previous example with JME. The smaller difference in prediction performance between ADHD-PRS and ePRS is likely attributable to the small sample size available for training data (70% of the BIS-score data set; n = 227) and R2 being driven by a few variants with large effect sizes. Nonetheless, ePRS continues to achieve improved predictions even for an ordinal measure with limited sample size.
Model performance in predicting BIS scores
| Performance metric | BIS scores (R2) |
|---|---|
| ADHD-PRS | 14.8% |
| Elastic Net | 6.5% ± 2.1% |
| ePRS | 17.8% ± 2.3% |
[i] ePRS significantly outperforms elastic net while achieving comparable standard error across 50 different train-test splits of the target data set. R2 represents the proportion of variance in BIS scores explained by the various polygenic scores. ADHD-PRS performs comparably well, potentially owing to R2 being driven by a few variants with large effect sizes. (ADHD) Attention-deficit/hyperactivity disorder, (BIS) Barratt impulsiveness scale.
ePRSs improve prediction of CFRD onset in CF cohorts
Although CF is caused by loss-of-function CF transmembrane conductance regulator (CFTR) variants, individuals with the same causal genotype show substantial variability in comorbidities across the CF-affected organs that is influenced by modifier genes. CFRD is one such comorbidity, and unlike the previous JME examples that included cases and controls genotyped at different times on different platforms, this CF application provides a within-cohort demonstration of the ePRS that complements simulations and shows that gains are not driven by cross-cohort genotyping or quality-control (QC) differences. We performed model training and evaluation entirely within the CGMS (n = 1958) and restricted model fitting to the set of overlapping variants with uniformly applied QC criteria, as described by Lin et al. (2021). Because prior work by Blackman et al. (2013) has shown substantial genetic overlap between CFRD and T2D, we used T2D summary statistics from the UKBB as the external source phenotype and trained ePRS models to predict CFRD status in CGMS, with strict separation of model tuning and evaluation through nested cross‐validation.
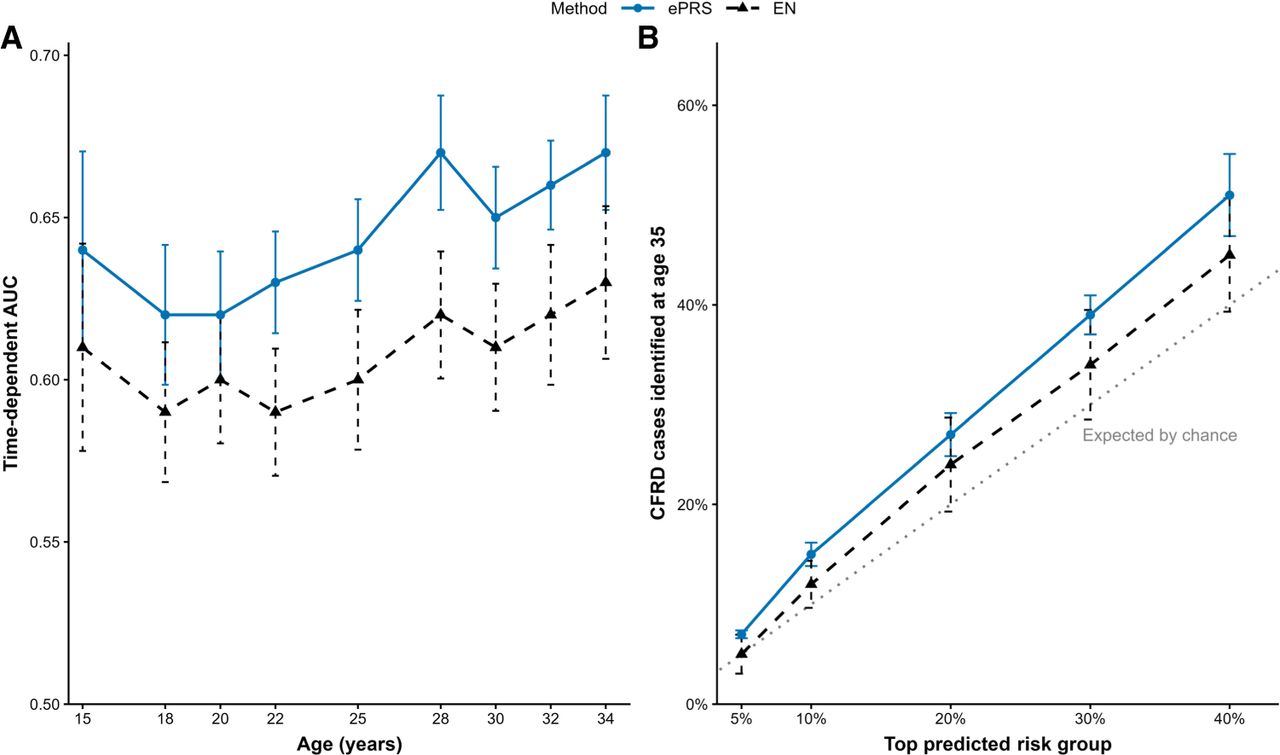
Figure 2A shows model performance, measured by time-dependent AUC, comparing the ePRS and EN. Error bars denote the 95% confidence interval of model performance across 100 iterations of train-test splits. The ePRS consistently outperformed EN by 3%–4% in out-of-fold prediction of CFRD onset across all ages, while also producing more stable predictions as reflected by the narrower error bars. Figure 2B ranks held-out individuals by predicted risk and evaluates the proportion of CFRD cases identified within the highest-risk groups at age 35. The ePRS captured a larger fraction of CFRD cases than EN at each evaluated risk threshold. Together, the results demonstrate that ePRS not only improves time-dependent discrimination but also better prioritizes individuals at elevated risk of CFRD onset within a single harmonized cohort.
ePRSs improve within-cohort prediction and the identification of high-risk individuals for cystic fibrosis–related diabetes (CFRD) onset in the Canadian Cystic Fibrosis Gene Modifier Study (CGMS). (A) Model performance measured in time-dependent area under the curve (AUC) between the ePRS and elastic net (EN) in CGMS. Error bars represent the 95% confidence interval of model performance from 100 iterations of train-test splits. The ePRS consistently outperformed EN by 3%–4% in out-of-fold performance when predicting CFRD onset at all ages and simultaneously achieved more stable predictions compared with EN. (B) Ranking of held-out individuals by predicted risk and evaluation of the proportion of CFRD cases at age 35 identified within the highest-risk groups. The ePRS captured a larger fraction of CFRD cases than EN at each evaluated risk threshold. For example, the top 20% of individuals ranked by the ePRS captured ∼30% of CFRD cases, exceeding both EN and the expected proportion by chance. The ePRS not only improves time-dependent discrimination but also better prioritizes individuals at elevated risk of CFRD within a single harmonized cohort.
Discussion
We present the ePRS, a penalized regression framework that adapts polygenic scores from deeply phenotyped clinical cohorts using large, heterogeneous GWAS summary statistics of correlated traits. ePRSs yield measurable and statistically supported improvements in clinically relevant prediction tasks. ePRSs use a continuous measure of external GWAS evidence to define variant‐specific penalties, whereas genetic correlation rg modulates how strongly external information is borrowed. This design improves prediction stability when the target sample size is limited and provides a principled fail-safe mechanism when the source phenotype is weakly related to the target phenotype by downweighting external information and increasingly relying on the target cohort instead through rg. Through simulation, we demonstrate this fail-safe mechanism allows ePRSs to converge toward the target-only model when the external phenotype is weakly related or uninformative.
Related approaches have addressed the power specificity trade-off in biobank settings by integrating broad, shallow phenotyping with smaller sets of deeply phenotyped measures within the same cohort. For example, Dahl et al. (2023) improves downstream PRS performance primarily through phenotype imputation across correlated traits to increase the effective sample size for a deeply phenotyped target. Our ePRS framework is complementary but is designed for when the clinically refined phenotype is measured in a relatively small cohort and within-biobank phenotype imputation is not feasible. The ePRS then incorporates external GWAS evidence via variant-specific penalization, with genetic correlation providing a fail-safe mechanism when the shared genetic basis is weak. These approaches may be synergistic, in which improved biobank-derived phenotypes could yield more specific GWAS summary statistics that serve as stronger external evidence that can be leveraged by an ePRS.
Using an ePRS, we refined an IGE-based PRS into JME-specific risk scores in the BIOJUME cohort, improving JME prediction and differentiation from other epilepsy subtypes relative to IGE-PRS. A subtype-specific PRS may therefore complement conventional clinical features for improved subtype classification and clinical trial recruitment. We emphasize that this primary JME application is to demonstrate phenotypic refinement and subtype specificity for diagnosis. Extending the ePRS to prognosis/severity-related outcomes (e.g., age of onset) will require harmonized, well-powered severity phenotypes in the target cohort and sufficiently correlated external GWAS evidence for those severity-related traits.
The ePRS also improves the predictive capacity of PRS for impulsivity in JME, measured through BIS scores. Individuals with JME often exhibit increased impulsivity comparable to those with personality and neurotic disorders (Shakeshaft et al. 2021). Identifying individuals with impulsivity could help clinicians select the most effective treatment strategies. Moreover, increased impulsivity is also linked to comorbidities including a higher risk of substance abuse, suicidality, and obesity (Chamorro et al. 2012). A tailored PRS for impulsivity could enable preventive interventions and long-term support, improving outcomes from a younger age. We do caution against relying solely on the PRS for diagnosis, given its relatively low explanatory power measured in R2. Because impulsivity is only one component of ADHD, we hypothesize that ADHD-PRS, based solely on GWAS summary statistics for ADHD, could only provide limited predictive accuracy for BIS scores but provides proof of concept. The ePRS methodology can easily incorporate GWAS summary statistics from other phenotypes and even multiple studies of the same phenotype to further improve predictive accuracy of the target phenotype. For instance, in addition to IGE, incorporating GWAS summary statistics from multiple epilepsy subtypes can potentially improve performance, especially when only limited data are available for the target phenotype.
PRS applications can introduce spurious signal from differences in genotyping arrays, imputation pipelines, or subtle stratification, especially when cases and controls are drawn from different cohorts. To directly address this, we conducted a within‐cohort application of an ePRS in the CGMS, predicting CFRD using T2D GWAS summary statistics from the UKBB. In this setting, the ePRS improved CFRD prediction by 3%–4% in AUC over EN, supporting that the gains observed in the epilepsy analyses are not spurious and are not explained by cross-platform artifacts or QC differences (Lin et al. 2021).
The ePRS focuses on improving prediction for a small, deeply phenotyped target cohort by incorporating external GWAS evidence from related phenotypes through variant-specific penalization. The ePRS fits a penalized regression model directly to individual-level data in the target cohort, allowing for regularization, covariate adjustment (e.g., sex, age of onset), gene-by-environment interactions, and the integration of biologically informed penalty weights. This is in contrast or complementary to other PRS methods with related goals. Transfer learning and multiancestry PRS methods have been developed to improve PRS portability across populations, for example, TL-PRS (Zhao et al. 2022) and penalized-regression ensemble approaches such as PROSPER (Zhang et al. 2024). These methods are complementary to ePRS in that they primarily focus on transferring PRS for the same phenotype across ancestries/cohorts.
PRS methods have been proposed to leverage external information to help improve prediction accuracy in small clinical cohorts, including cross-trait penalized regression (CTPR) (Chung et al. 2019), risk-factor PRS (R-F PRS) (Jung et al. 2024), and multitrait analysis of GWAS (MTAG) (Turley et al. 2018). However, R-F PRS requires polygenic scores derived from each external phenotype or risk factor before leveraging them in an EN regression, which does not allow for adjusting contributions from different genetic variants within the same risk factor. This simplicity can pose a challenge as overlapping genetic architecture between different traits may not be uniform across all genomic regions. On the other hand, CTPR estimates variant effect sizes directly by modeling multiple traits simultaneously, but the loss function can become non-ideal when the traits are of different data types (e.g., binary vs. continuous). Although MTAG improves statistical power by leveraging GWAS summary statistics from genetically correlated traits, it assumes a nonzero genetic correlation and does not support individual-level modeling.
Functional annotations could be incorporated into the ePRS by scaling variant-specific penalties so that variants with stronger functional support receive less shrinkage. We did not evaluate annotation-informed penalties here because our focus was on borrowing information from genetically correlated external GWAS, but this extension may further improve stability and prediction when the selected annotations are relevant to the target biology. This approach mitigates potential bias when the genetic correlation between traits is weak or absent.
We recognize that real genetic architectures can involve modifier effects, phenotypic heterogeneity, and higher-order interactions. Our simulations adopt an additive generating model (with a liability-threshold model for binary traits), consistent with the paradigm commonly used in other PRS methodological studies and with the marginal-effect framework of GWAS summary statistics (Dudbridge 2013; Ge et al. 2019; Privé et al. 2020). This alignment helps ensure that observed performance differences are attributable to the ePRS's external‐evidence weighting and transfer mechanism, rather than artifacts of evaluating methods under mismatched generative assumptions. Extending the evaluation to explicitly nonadditive architectures is an important direction for future work, and the ePRS can accommodate interaction terms when such features are available and sufficiently powered in the target cohort.
A few limitations for an ePRS should be noted. A small target cohort may result in large statistical errors when estimating effect sizes for individual variants, leading to increased model instability. Moreover, penalized regression methods, such as EN, tend to shrink estimated coefficients to zero when the dimensionality (i.e., number of variants) increases relative to the sample size, which could lead to an ineffective model that assigns a uniform PRS to all individuals in the study. An alternative approach, leveraging variant effect sizes from the external data set while incorporating evidence measures from the target data set, may also be unsatisfactory, and we recommend either searching for additional phenotypes with higher genetic correlation rg or implementing a two-stage approach to remove variants with weak evidence of association in both the source and target data sets. Specifying the “required” target sample size is also not straightforward as it depends on the dimensionality of the model (number of variants), the genetic architecture of the target phenotype, and the extent of shared genetic architecture with the external source phenotype. Although train-test splits reduce effective training size in very small cohorts, our simulations varying the target cohort size (Supplemental Figs. S6, S7) can provide guidelines for sample size and show that ePRS is most beneficial in precisely the small-N regime for which only limited sample size is available. More broadly, this instability is not specific to ePRSs. In small target cohorts, any method that relies on splitting data to tune hyperparameters can be volatile. This includes the weighted PRS in which a global mixing parameter α ∈ [0, 1] is selected by cross-validation to combine a target-derived PRS with a source-derived PRS (Supplemental Fig. S12). When the genetic correlation between the source and target phenotypes is weak (rg → 0), the oracle choice is essentially the target-only solution (α ≈ 1 under our parameterization; see Methods). In practice, however, with limited sample sizes the cross-validated loss as a function of α can be shallow and dominated by sampling noise, such that the selected α can vary substantially across folds. In this regime, even a modest deviation away from α = 1 can introduce noise from a poorly matched source phenotype and yield worse model performance than the target-only approach.
In summary, PRSs from large biobank-scale data often lack alignment with clinical populations, limiting their practical utility in personalized care. The ePRS bridges this gap by combining the strengths of biobank-scale studies and targeted clinical data sets, enhancing predictive accuracy and clinical relevance.
Methods
The ePRS framework
Let y1,2,3,…,n represent the phenotype of interest for individuals i = 1, 2, …, n in the target patient cohort, and let Xi,j denote the number of minor alleles for individual i and variant j. Constructing a PRS for the target phenotype involves learning variant-specific weights, , to obtain an aggregated risk score for each individual:
However, estimating becomes particularly challenging when the sample size is limited. The goal is thus to leverage GWAS summary statistics based on external large-scale data sets to develop robust variant-specific weights, improving model stability and predictive capacity of the resulting PRS.
Assume we have access to GWAS summary statistics from a large-scale, source data set. Let p1,2,…,M be the P-values corresponding to variants 1, 2, … M. A smaller P-value indicates stronger evidence of association between the variant and the source phenotype, and thus, the ePRS should encourage the selection of such variants and impose a smaller penalty when estimating their effect sizes. Therefore, we define the variant-specific penalty (Ej; variant j) as follows:
The variant-specific penalty is inversely proportional to the negative log-transformed P-value, as illustrated in Supplemental Figure S1. An alternative concave penalty formulation is shown in Supplemental Figure S2. A genome-wide significant variant from an external GWAS would carry a small P-value (e.g., 1 × 10⁻⁸), resulting in a smaller penalty under the ePRS framework . Conversely, variants with moderate P-values, indicating weaker evidence of association, are assigned stronger penalties, discouraging ePRSs from assigning large effect sizes and thereby reducing the variants’ influence on an individual's overall genetic risk score. Ej could also be interpreted as the reciprocal of the s-value, also known as surprisal, in base 10. The use of s-values, which arise naturally from an information-theoretic perspective, provides Ej with a clear interpretation and allows for simple addition to combine evidence from multiple independent studies. For instance, if a variant j has P-values pa,j and pb,j from two independent GWAS, the combined penalty for variant j would be
We introduce the ePRS, a modified weighted penalized regression framework that leverages a continuous evidence measure from large-scale external data sets. Variant-specific effect sizes for the target phenotype are obtained by solving the following optimization problem:
The loss function is analogous to a weighted EN penalized regression that linearly combines L1 and L2 penalties, with an additional parameter, rg, that captures the genetic correlation between the source and target phenotypes. Specifically, rg measures the proportion of variance the two traits share owing to their overlapping genetic architectures. A genetic correlation of zero implies nonoverlapping genetic effects, whereas a genetic correlation of one indicates that all the genetic effects between the two traits are identical. We assume rg to be constant in the ePRS and can either be obtained from estimates reported in previous studies or estimated using cross-trait LD score regression (Bulik-Sullivan et al. 2015) exclusively on the training data set to avoid data leakage. This assumption can be relaxed by allowing region-specific (local) genetic correlation estimates. For instance, partition the genome into approximately independent LD blocks b = 1, …, B and replace the global rg with a local estimate for SNP j in block b(j). In practice, local estimates may be noisy in small target cohorts and can be shrunk toward the genome-wide rg to preserve model stability. Moreover, when SNP-based rg estimates are statistically unstable in a small, targeted cohort, we recommend treating rg as a tuning parameter and selecting it via nested cross-validation on the training data. Twin/pedigree-based genetic correlation estimates, although not directly equivalent to SNP-based rg, can also be used to define a plausible range for this tuning grid. We emphasize that ePRS does not require GWAS to be performed in the target cohort. Instead, SNP effect sizes are estimated directly by applying the ePRS framework to the training subset of the target phenotype cohort.
Incorporation of covariates
Let Z ∈ ℝn×q denote a matrix of nongenetic covariates measured in the target cohort (e.g., sex, age, principal components [PCs], and study-specific covariates), with corresponding coefficients γ ∈ ℝq. In an ePRS, covariates are included as unpenalized fixed effects, whereas genetic variant effects β are subject to penalization. This ensures adjustment for known confounders (including population structure) in the same manner as standard PRS association models and penalized regression frameworks. Covariates used in each analysis are listed in Supplemental Table S2.
A detailed description of the ePRS framework is provided below.
Input
X ∈ ℝn×p: genotype matrix for the target phenotype cohort (with n individuals and p SNPs)
y ∈ ℝn: phenotype vector for the target cohort
p ∈ ℝp: external GWAS summary statistics (P-values) for the source phenotype
λ, α: regularization parameters
Output
Estimated SNP weights
Polygenic risk scores for individuals i = 1, …, n
Steps
Split into training and test sets
Partition the target cohort into disjoint training and test sets: (Xtrain, ytrain) and (Xtest, ytest)
Estimate genetic correlation rg between source and target phenotypes
Estimated in the training set only or taken directly from other studies.
Can be estimated via LD score regression
Define SNP-specific penalties from external GWAS statistics
For each SNP j = 1, …, p, define penalty as
Optional: Penalties can be derived by combining multiple independent GWAS of the same phenotype,
Model fitting via weighted elastic net
Solve the weighted elastic net optimization problem on the training set:
(1)Tune (λ, α) via cross-validation in the training set
Risk scoring and evaluation
For each individual i in the test set, compute
Evaluate predictive performance using metrics such as AUC or R2
A detailed description of the ePRS framework, which integrates external GWAS summary statistics with individual-level data from the target cohort. To avoid data leakage and ensure unbiased evaluation, the target cohort is split into independent training and test sets. Genetic correlation (rg) between source and target phenotypes is estimated using only the training set and controls the relative influence of external variant-specific penalties (Ej) in a weighted penalized regression framework. When rg = 1, the external information is fully leveraged, whereas rg = 0 yields a conventional penalized regression model that relies solely on the target data.
Leveraging genetic correlation instead of Pearson's correlation between the source and target phenotypes offers two advantages. First, genetic correlation applies equally to quantitative traits and binary traits on a liability scale, allowing for the straightforward estimation of rg between case-control studies and those with continuous outcomes, something not possible with Pearson's correlation. Second, Pearson's correlation between the two traits can be arbitrarily weakened by adding random variations to the measured traits, even when the shared genetic architecture remains unchanged. For instance, introducing measurement error in the phenotype of interest Y will reduce Pearson's correlation, causing the ePRS to borrow less information from the source phenotype despite that their shared genetic influences remain intact.
Consider the scenario in which the source phenotype is completely irrelevant for predicting the target phenotype. In such cases, incorporating the variant-specific penalty Ej from the source data set is unnecessary and may introduce unwanted noise, potentially degrading model performance. By extending the loss function to include genetic correlation rg, we introduce a fail-safe mechanism when the source and target phenotypes have nonoverlapping genetic effects. When rg → 1, the source and target phenotypes are perfectly correlated and share the same underlying genetic etiology, allowing ePRS to converge to a weighted EN model that fully leverages external information from the large-scale source data set. In contrast, when rg → 0, the phenotypes become uncorrelated, and no useful information could be gained from incorporating the external data set. In this scenario, the proposed ePRS framework simplifies to a conventional EN regression using only data from the target phenotype cohort.
We emphasize that ePRSs are not intended to identify unknown clusters within a complex phenotype, a goal typically addressed by clustering methods such as principal component analysis (PCA), DBSCAN, and graph-based clustering networks (Ester et al. 1996; Patterson et al. 2006; Tsitsulin et al. 2023). Instead, an ePRS focuses on constructing specific polygenic scores tailored to the target phenotype, even with limited sample sizes available. The ePRS framework utilizes iterative gradient descent to estimate model coefficients for the target cohort until convergence. To optimize the hyperparameters λ and α, the target cohort is split into training and validation sets, which can exacerbate model instability especially when sample sizes are small. In practice, this tuning is performed within the training set (nested cross-validation), whereas the held-out test set is used only for performance evaluation. To overcome this challenge, we propose a two-stage approach to screen out genetic variants with weak evidence of association (e.g., P > 0.3) in both the target phenotype cohort (training set only) and the large-scale external cohort before applying the ePRS. The two-stage approach is particularly attractive when the target phenotype is a subtype of the source phenotype defined on the large-scale heterogeneous cohort.
Combining multiple external phenotypes
The ePRS framework allows users to easily incorporate multiple studies of the same external phenotype or from multiple phenotypes. Ej allows for simple addition to combine evidence from multiple independent studies of the same phenotype. For instance, if a variant j has P-values pa,j and pb,j from two independent GWAS, the combined penalty for variant j would be
To account for multiple external phenotypes within the ePRS framework, a separate estimate of cross-trait genetic correlation is to be derived for each phenotype: rg,k for external phenotypes k = 1, 2, 3, etc. Penalty assigned to each variant would thus be a weighted linear combination of different rg,k and Ej, and a separate EN penalty term would be added for each additional external phenotype:
Baseline PRS methods used in simulation
Comparator PRS methods used for benchmarking (P+T, source-only PRS, elastic net, and weighted PRS) are described in Supplemental Material Section K.
Study cohorts, phenotype definitions
Epilepsy cohorts
Clinical and genetic data were collected from the BIOJUME consortium study (n = 864) (Shakeshaft et al. 2022), the Rolandic Epilepsy Genome-wide Association International Study (REGAIN; n = 852; NCT03547050), and from other studies of electrical status epilepticus in slow-wave sleep (ESES) and IGEs (Lemke et al. 2013). We obtained informed consent from all participants and ethical approval from the UK Health Research Authority: South Central Oxford C research ethics committee (16/SC/0266), London Bridge research ethics committee 18/LO/0207, and all other collaborating sites. The SickKids research ethics committee of The Hospital for Sick Children (1000033784) gave ethical approval for this work.
Individuals of European descent (defined as within 6 SD from the 1000 Genomes European cluster in a PCA analysis) diagnosed with JME from the BIOJUME study (n = 624) were used for all subsequent PRS analyses (Roshandel et al. 2023). Individuals with other epilepsy subtypes include childhood absence epilepsy (CAE; n = 88), electrical status epilepticus in sleep (ESES; n = 73), JAE (n = 30), and rolandic epilepsy (RE; n = 143) (Panjwani et al. 2016). Sex distributions across the JME and other epilepsy subtypes are provided in Supplemental Table S1. JME, CAE, and JAE are considered subtypes of IGE, whereas RE is an idiopathic focal epilepsy, and ESES is considered a developmental and/or epileptic encephalopathy (Beniczky et al. 2025). Moreover, we randomly sampled 3000 unrelated individuals of European descent from the UKBB (Bycroft et al. 2018) to serve as controls. PCA was conducted on the combined data set, and 10 PCs were used as adjustments during the implementation of GWAS and all predictive algorithms in the target phenotype cohort.
BIS-brief impulsivity phenotype in BIOJUME
Barratt impulsivity scale (BIS) scores used to measure self-rating of impulsivity in the study were collected through BIS-brief, which is a shorter version of conventional BIS scores (Steinberg et al. 2013). The current version of BIS scores includes 30 questions on 11 items measuring three theoretical subtraits: attentional, motor, and nonplanning impulsiveness. In contrast, BIS-brief is a unidimensional scale including eight of the original 11 items generating a total score from eight to 32. Moreover, BIS-brief demonstrated comparable construct validity as observed in conventional BIS scores. It has been shown that using BIS-brief in large epidemiological studies of psychiatric disorders reduces the burden on respondents without the loss of information (Steinberg et al. 2013).
A total of 381 individuals with JME who passed phenotype QC with complete BIS-score ratings were included. Four individuals who failed genotyping QC and one additional individual were removed owing to cryptic relatedness. We identified 329 individuals from the remaining cohort as being of European ancestry (within 6 standard deviations [SD] from the 1000 Genomes European cluster in a PCA) (Gong et al. 2019) and removed five additional patients with missing information on seizure frequency. A total of 324 individuals were used for all subsequent PRS analyses for BIS scores. Further details on genotyping QC and imputation are provided in the work of Roshandel et al. (2023).
External GWAS summary statistics on IGE from ILAE
GWAS summary statistics for IGE were obtained from the 2018 ILAE Consortium meta-analysis, which combined data from 24 population cohorts and included 15,212 IGE cases and 29,677 controls. Importantly, there is no sample overlap between the 2018 ILAE study and the BIOJUME consortium cohort used in this study, which ensures that all external GWAS statistics used in ePRS are fully independent of the target data set, mitigating concerns about data leakage or inflated predictive performance. To further support the robustness of our findings, we provide a simulation in Supplemental Figure S8 showing that the results are not materially affected by the presence or absence of sample overlap.
UKBB participants
UKBB is a large-scale biomedical database with more than 500,000 individuals from across the United Kingdom (Bycroft et al. 2018). We randomly sampled 3000 unrelated White British individuals without epilepsy to serve as controls for individuals with IGE. Individuals with epilepsy reported under “first occurrences” (category 1712), which incorporates primary care data, ICD-10 codes, and self-reported outcomes, were removed from the healthy controls. Only variants with minor allele frequency (MAF) > 0.01 are included in the analyses, whereas genotyping and QC are described in detail here.
Canadian CGMS
The CGMS is a nationwide collaborative initiative aimed at identifying genetic variants outside the primary CFTR gene that influence the severity and progression of CF disease across the affected organs. We included 1958 individuals from CGMS who have CFTR variants associated with pancreatic insufficiency (PI) or have a CFTR genotype carried by individuals diagnosed with CFRD in the CGMS. Specifically, CFRD was observed in CGMS participants who had a PI pathogenic variant in combination with one of the following “mild” CFTR alleles: 2789+5G>A, A455E, G85E, and IVS8(5T). To ensure representation of these genotypes, we included 10 individuals without a CFRD diagnosis but carrying the same CFTR genotypes. Detailed descriptions of phenotyping and genotyping criteria have been reported previously (Lin et al. 2021).
Table 5 summarizes the Study cohorts section and describes its sample size, ancestry, genotyping platform, and the corresponding phenotypes.
Human participants and genotyping data included in the study
| Sample source | N | Genotyping platform | Ancestry | Phenotypes/notes |
|---|---|---|---|---|
| BIOJUME (Shakeshaft et al. 2022) JME Individuals | 624 | Illumina Omni 2.5 | European | EUR ethnicity defined as within 6 SD of 1KG EUR (PCA) |
| Panjwani et al. 2016 | 259 | Illumina Omni 2.5 | European | Includes ESES (N = 73), RE (n = 143), MAE (n = 43) |
| Panjwani et al. 2016 | 118 | Human OmniExpress BeadChip | European | Includes CAE (n = 88), JAE (n = 30) |
| BIOJUME BIS score substudy | 324 | Illumina Omni 2.5 | European | JME individuals with complete BIS scores and seizure data |
| UK Biobank (UKBB) | 3000 | Axiom Array | White British | Random unrelated controls, filtered to exclude individuals with epilepsy |
| Canadian Gene Modifier Study (CGMS) | 1958 | Illumina 610 Quad/660W/Omni 2.5 | European | Cystic fibrosis–related diabetes |
[i] (1KG) 1000 Genomes Project, (BIOJUME) Biology of Juvenile Myoclonic Epilepsy, (BIS) Barratt impulsiveness scale, (CAE) childhood absence epilepsy, (ESES) electrical status epilepticus in sleep, (EUR) European, (JAE) juvenile absence epilepsy, (JME) juvenile myoclonic epilepsy, (MAE) myoclonic–atonic epilepsy, (PCA) principal component analysis, (RE) rolandic epilepsy, (SD) standard deviation.
Quality control
Genotyping and quality control
BIOJUME participants were genotyped using the Illumina Omni 2.5 array, and the UKBB participants were genotyped using the Axiom Array by Affymetrix. Individuals with RE and ESES were genotyped using the Illumina Omni 2.5 array, and CAE/JAE individuals were genotyped using the human OmniExpress BeadChip. Individuals in CGMS were genotyped using the Illumina 610 Quad, 660W, and the Omni 2.5 array, but only 3984 overlapping variants that were annotated to genes previously identified as CF modifiers were included in the analysis (Lin et al. 2021). QC was performed using PLINK v.190b6.18 (Chang et al. 2015). Individuals and variants with call rates <90%, samples with sex mismatches and/or high heterozygosity, males with heterozygous calls for X Chromosome markers, and females with nonmissing calls for markers on the Y Chromosome were removed. Unrelated individuals were obtained using KING v.2.2.4 (Manichaikul et al. 2010) –unrelated option. Moreover, we further removed ambiguous SNPs, indels, monomorphic variants, duplicated variants, and all variants with MAF < 1%. Details of individual-level QC in CGMS have been reported previously (Lin et al. 2021).
Population structure control in cross-cohort analyses
To account for fine-scale structure when cases and controls are drawn from different cohorts, we performed PCA on the merged BIOJUME–UKBB data set. Individuals were restricted to European ancestry based on proximity to the 1000 Genomes European cluster (within 6 SD). The top 10 PCs from the merged PCA were included as covariates in the GWAS and in all predictive modeling to adjust for within-European structure across recruitment sources. Because BIOJUME and UKBB were genotyped on different arrays (Illumina Omni 2.5 vs. Affymetrix Axiom), all modeling is performed after harmonized QC. Moreover, we performed sensitivity analysis by repeating the primary case–control modeling with additional PCs (20 PCs) and observed consistent results.
Rationale for real-data applications
To evaluate ePRS in clinically realistic settings, we applied the framework to three target phenotypes using complementary data sources. Each application was selected to emphasize a distinct methodological contribution of ePRS in the context of small, deeply phenotyped cohorts: (1) phenotype refinement and subtype specificity when the external GWAS is broader than the target phenotype of interest, (2) cross-phenotype transfer when the external GWAS is on a related (but nonidentical) phenotype and the target outcome is a refined trait measure, and (3) robustness to cross-cohort genotyping through a design that trains and evaluates within a single harmonized cohort. A summary of sample sizes, ancestry, and genotyping platforms is provided in Table 5.
Application 1. IGE → JME (BIOJUME cases + UKBB controls)
This analysis tests whether ePRSs can adapt a broad, biobank/meta-analysis-derived genetic signal (IGE) to produce a JME-tailored PRS that improves prediction and stability in a small, clinically ascertained cohort, including improved differentiation of JME from other epilepsy subtypes (i.e., increased phenotypic specificity).
Application 2. ADHD → impulsivity in JME
This analysis serves as a proof-of-concept for cross-phenotype transfer, leveraging a large external ADHD GWAS to improve prediction of a refined component trait (impulsivity) measured directly in the target cohort. It highlights that ePRS can borrow external evidence even when the source phenotype is related but not identical to the target trait, as well as when the target outcome is measured on a quantitative scale.
Application 3: T2D → CFRD (within Canadian CF Gene Modifier Study; CGMS)
This analysis is designed to address concerns about cross-cohort confounding (e.g., genotyping platform or QC differences between cases/controls). Model fitting and evaluation are performed entirely within a single harmonized cohort (CGMS), while using an external GWAS (UK Biobank T2D) only to define variant-specific evidence weights. This isolates the methodological benefit of an ePRS (borrowing stable external signal to improve prediction in modest samples) from potential cross-platform artifacts.
Data sets
UKBB genotype data are available to eligible researchers. Applications are submitted via the UKBB access management system (https://ams.ukbiobank.ac.uk) following UKBB guidance (https://www.ukbiobank.ac.uk/use-our-data/apply-for-access/). After an application is approved, data are made available primarily via the UKBB research analysis platform (UKB‐RAP; https://ukbiobank.dnanexus.com), with limited exemptions for temporary downloads in specific circumstances.
BIOJUME consortium data supporting the findings of this study are available to qualified researchers upon request, subject to consortium approval and applicable ethics/privacy restrictions. Access instructions for researchers can be found at https://childhoodepilepsy.org/research-studies/biojume/.
CF genotype data are available by application to the CF Canada National Data Registry for accessing confidential clinical data as previously described (Lin et al. 2021). Application form can be found at https://cysticfibrosis.ca/for-researchers.
Code availability
The R implementation of ePRS and simulation code are available at GitHub (https://github.com/strug-hub/ePRS) and as Supplemental Code.
Competing interest statement
The authors declare no competing interests.
Acknowledgments
We thank the Canadian Cystic Fibrosis Gene Modifier Study (CGMS) consortium study sites and the individuals with CF who participated in the study, together with their families, for their contributions to this research. Funding was provided by peer-reviewed Cystic Fibrosis (CF) Canada 2022 Basic and Clinical Research Grant (1009794) jointly funded by CF Canada and Canadian Institutes of Health Research Institute of Circulatory and Respiratory Health (CIHR-ICRH) FRN: BCG 187014; Cystic Fibrosis Canada Grant 608828; Cystic Fibrosis Foundation STRUG17PO; Canadian Institute of Health Research (CIHR) Foundation Grant, FRN: 167282; University of Toronto McLaughlin Centre; and Government of Canada through Genome Canada and Ontario Genomics Institute (OGI-148). This research was undertaken, in part, thanks to funding from the Canadian Research Chairs Program to L.J.S. who is the Canada Research Chair in Genome Data Science. This research has been conducted using the UK Biobank Resource under Application Number 40946.
Author contributions: Y.L. led and performed the statistical analyses. L.J.S. provided supervision. Y.L. and L.J.S. drafted the manuscript. All other authors reviewed the manuscript for clarity and provided editorial feedback. All authors read and approved the final version.
Footnotes
[6] Supplementary material [Supplemental material is available for this article.]
[7] Article published online before print. Article, supplemental material, and publication date are at https://www.genome.org/cgi/doi/10.1101/gr.281480.125.
[8] Freely available online through the Genome Research Open Access option.
References
- ↵Beniczky S, Trinka E, Wirrell E, Abdulla F, Al Baradie R, Alonso Vanegas M, Auvin S, Singh MB, Blumenfeld H, Bogacz Fressola A, 2025. Updated classification of epileptic seizures: position paper of the international league against epilepsy. Epilepsia 66: 1804–1823. 10.1111/epi.18338
- ↵Blackman SM, Commander CW, Watson C, Arcara KM, Strug LJ, Stonebraker JR, Wright FA, Rommens JM, Sun L, Pace RG, 2013. Genetic modifiers of cystic fibrosis-related diabetes. Diabetes 62: 3627–3635. 10.2337/db13-0510
- ↵Brikell I, Ghirardi L, D'Onofrio BM, Dunn DW, Almqvist C, Dalsgaard S, Kuja-Halkola R, Larsson H. 2018. Familial liability to epilepsy and attention-deficit/hyperactivity disorder: A nationwide cohort study. Biol Psychiatry 83: 173–180. 10.1016/j.biopsych.2017.08.006
- ↵Bulik-Sullivan BK, Loh PR, Finucane HK, Ripke S, Yang J, Schizophrenia Working Group of the Psychiatric Genomics Consortium, Patterson N, Daly MJ, Price AL, Neale BM. 2015. LD score regression distinguishes confounding from polygenicity in genome-wide association studies. Nat Genet 47: 291–295. 10.1038/ng.3211
- ↵Bycroft C, Freeman C, Petkova D, Band G, Elliott LT, Sharp K, Motyer A, Vukcevic D, Delaneau O, O'Connell J, 2018. The UK biobank resource with deep phenotyping and genomic data. Nature 562: 203–209. 10.1038/s41586-018-0579-z
- ↵Chamorro J, Bernardi S, Potenza MN, Grant JE, Marsh R, Wang S, Blanco C. 2012. Impulsivity in the general population: a national study. J Psychiatr Res 46: 994–1001. 10.1016/j.jpsychires.2012.04.023
- ↵Chang CC, Chow CC, Tellier LC, Vattikuti S, Purcell SM, Lee JJ. 2015. Second-generation PLINK: rising to the challenge of larger and richer datasets. GigaScience 4: 7. 10.1186/s13742-015-0047-8
- ↵Chen TH, Chatterjee N, Landi MT, Shi J. 2021. A penalized regression framework for building polygenic risk models based on summary statistics from genome-wide association studies and incorporating external information. J Am Stat Assoc 116: 133–143. 10.1080/01621459.2020.1764849
- ↵Choi SW, Mak TS, O'Reilly PF. 2020. Tutorial: a guide to performing polygenic risk score analyses. Nat Protoc 15: 2759–2772. 10.1038/s41596-020-0353-1
- ↵Chung W, Chen J, Turman C, Lindstrom S, Zhu Z, Loh PR, Kraft P, Liang L. 2019. Efficient cross-trait penalized regression increases prediction accuracy in large cohorts using secondary phenotypes. Nat Commun 10: 569. 10.1038/s41467-019-08535-0
- ↵Dahl A, Thompson M, An U, Krebs M, Appadurai V, Border R, Bacanu SA, Werge T, Flint J, Schork AJ, 2023. Phenotype integration improves power and preserves specificity in biobank-based genetic studies of major depressive disorder. Nat Genet 55: 2082–2093. 10.1038/s41588-023-01559-9
- ↵Demontis D, Walters RK, Martin J, Mattheisen M, Als TD, Agerbo E, Baldursson G, Belliveau R, Bybjerg-Grauholm J, Bækvad-Hansen M, 2019. Discovery of the first genome-wide significant risk loci for attention deficit/hyperactivity disorder. Nat Genet 51: 63–75. 10.1038/s41588-018-0269-7
- ↵Dudbridge F. 2013. Power and predictive accuracy of polygenic risk scores. PLoS Genet 9: e1003348. 10.1371/journal.pgen.1003348
- ↵Ester M, Kriegel HP, Sander J, Xu X. 1996. A density-based algorithm for discovering clusters in large spatial databases with noise. In Proceedings of the Second International Conference on Knowledge Discovery and Data Mining (KDD-96), pp. 226–231. AAAI Press, Portland, OR.
- ↵Ge T, Chen CY, Ni Y, Feng YCA, Smoller JW. 2019. Polygenic prediction via Bayesian regression and continuous shrinkage priors. Nat Commun 10: 1776. 10.1038/s41467-019-09718-5
- ↵Ghatan S, van Rooij J, van Hoek M, Boer CG, Felix JF, Kavousi M, Jaddoe VW, Sijbrands EJG, Medina-Gomez C, Rivadeneira F, 2024. Defining type 2 diabetes polygenic risk scores through colocalization and network-based clustering of metabolic trait genetic associations. Genome Med 16: 10. 10.1186/s13073-023-01255-7
- ↵Gong J, Wang F, Xiao B, Panjwani N, Lin F, Keenan K, Avolio J, Esmaeili M, Zhang L, He G, 2019. Genetic association and transcriptome integration identify contributing genes and tissues at cystic fibrosis modifier loci. PLoS Genet 15: e1008007. 10.1371/journal.pgen.1008007
- ↵Heyne HO, Pajuste FD, Wanner J, Onwuchekwa JID, Mägi R, Palotie A, FinnGen Estonian Biobank research team, Kälviainen R, Daly MJ. 2024. Polygenic risk scores as a marker for epilepsy risk across lifetime and after unspecified seizure events. Nat Commun 15: 6277. 10.1038/s41467-024-50295-z
- ↵The International League Against Epilepsy Consortium on Complex Epilepsies. 2018. Genome-wide mega-analysis identifies 16 loci and highlights diverse biological mechanisms in the common epilepsies. Nat Commun 9: 5269. 10.1038/s41467-018-07524-z
- ↵Jung H, Jung HU, Baek EJ, Kwon SY, Kang JO, Lim JE, Oh B. 2024. Integration of risk factor polygenic risk score with disease polygenic risk score for disease prediction. Commun Biol 7: 180. 10.1038/s42003-024-05874-7
- ↵Lemke JR, Lal D, Reinthaler EM, Steiner I, Nothnagel M, Alber M, Geider K, Laube B, Schwake M, Finsterwalder K, 2013. Mutations in GRIN2A cause idiopathic focal epilepsy with rolandic spikes. Nat Genet 45: 1067–1072. 10.1038/ng.2728
- ↵Lewis CM, Vassos E. 2020. Polygenic risk scores: from research tools to clinical instruments. Genome Med 12: 44. 10.1186/s13073-020-00742-5
- ↵Lin YC, Keenan K, Gong J, Panjwani N, Avolio J, Lin F, Adam D, Barrett P, Bégin S, Berthiaume Y, 2021. Cystic fibrosis–related diabetes onset can be predicted using biomarkers measured at birth. Genet Med 23: 927–933. 10.1038/s41436-020-01073-x
- ↵Liu Y, Xie J. 2020. Cauchy combination test: a powerful test with analytic p-value calculation under arbitrary dependency structures. J Am Stat Assoc 115: 393–402. 10.1080/01621459.2018.1554485
- ↵Ma Y, Zhou X. 2021. Genetic prediction of complex traits with polygenic scores: a statistical review. Trends Genet 37: 995–1011. 10.1016/j.tig.2021.06.004
- ↵Mak TSH, Porsch RM, Choi SW, Zhou X, Sham PC. 2017. Polygenic scores via penalized regression on summary statistics. Genet Epidemiol 41: 469–480. 10.1002/gepi.22050
- ↵Manichaikul A, Mychaleckyj JC, Rich SS, Daly K, Sale M, Chen WM. 2010. Robust relationship inference in genome-wide association studies. Bioinformatics 26: 2867–2873. 10.1093/bioinformatics/btq559
- ↵Moran A, Brunzell C, Cohen RC, Katz M, Marshall BC, Onady G, Robinson KA, Sabadosa KA, Stecenko A, Slovis B, 2010. Clinical care guidelines for cystic fibrosis-related diabetes: a position statement of the American Diabetes Association and a clinical practice guideline of the Cystic Fibrosis Foundation, endorsed by the Pediatric Endocrine Society. Diabetes Care 33: 2697–2708. 10.2337/dc10-1768
- ↵Moreau C, Rébillard RM, Wolking S, Michaud J, Tremblay F, Girard A, Bouchard J, Minassian B, Laprise C, Cossette P, 2020. Polygenic risk scores of several subtypes of epilepsies in a founder population. Neurol Genet 6: e416. 10.1212/NXG.0000000000000416
- ↵Panjwani N, Wilson MD, Addis L, Crosbie J, Wirrell E, Auvin S, Caraballo RH, Kinali M, McCormick D, Oren C, 2016. A microRNA-328 binding site in PAX6 is associated with centrotemporal spikes of Rolandic epilepsy. Ann Clin Transl Neurol 3: 512–522. 10.1002/acn3.320
- ↵Patterson N, Price AL, Reich D. 2006. Population structure and eigenanalysis. PLoS Genet 2: e190. 10.1371/journal.pgen.0020190
- ↵Privé F, Arbel J, Vilhjálmsson BJ. 2020. LDpred2: better, faster, stronger. Bioinformatics 36: 5424–5431. 10.1093/bioinformatics/btaa1029
- ↵Roshandel D, Sanders EJ, Shakeshaft A, Panjwani N, Lin F, Collingwood A, Hall A, Keenan K, Deneubourg C, Mirabella F, 2023. SLCO5A1 and synaptic assembly genes contribute to impulsivity in juvenile myoclonic epilepsy. NPJ Genom Med 8: 28. 10.1038/s41525-023-00370-z
- ↵Rubboli G, Beier CP, Selmer KK, Syvertsen M, Shakeshaft A, Collingwood A, Hall A, Andrade DM, Fong CY, Gesche J, 2023. Variation in prognosis and treatment outcome in juvenile myoclonic epilepsy: a Biology of Juvenile Myoclonic Epilepsy Consortium proposal for a practical definition and stratified medicine classifications. Brain Commun 5: fcad182. 10.1093/braincomms/fcad182
- ↵Schoeler T, Speed D, Porcu E, Pirastu N, Pingault JB, Kutalik Z. 2023. Participation bias in the UK Biobank distorts genetic associations and downstream analyses. Nat Hum Behav 7: 1216–1227. 10.1038/s41562-023-01579-9
- ↵Shakeshaft A, Panjwani N, McDowall R, Crudgington H, Peña Ceballos J, Andrade DM, Beier CP, Fong CY, Gesche J, Greenberg DA, 2021. Trait impulsivity in juvenile myoclonic epilepsy. Ann Clin Transl Neurol 8: 138–152. 10.1002/acn3.51255
- ↵Shakeshaft A, Panjwani N, Collingwood A, Crudgington H, Hall A, Andrade DM, Beier CP, Fong CY, Gardella E, Gesche J, 2022. Sex-specific disease modifiers in juvenile myoclonic epilepsy. Sci Rep 12: 2785. 10.1038/s41598-022-06324-2
- ↵Steinberg L, Sharp C, Stanford MS, Tharp AT. 2013. New tricks for an old measure: the development of the Barratt impulsiveness scale-brief (BIS-brief). Psychol Assess 25: 216–226. 10.1037/a0030550
- ↵Tsitsulin A, Palowitch J, Perozzi B, Möller E. 2023. Graph clustering with graph neural networks. J Mach Learn Res 24: 1–21.
- ↵Turley P, Walters RK, Maghzian O, Okbay A, Lee JJ, Fontana MA, Nguyen-Viet TA, Wedow R, Zacher M, Furlotte NA, 2018. Multi-trait analysis of genome-wide association summary statistics using MTAG. Nat Genet 50: 229–237. 10.1038/s41588-017-0009-4
- ↵Xu C, Ganesh SK, Zhou X. 2023. mtPGS: leverage multiple correlated traits for accurate polygenic score construction. Am J Hum Genet 110: 1673–1689. 10.1016/j.ajhg.2023.08.016
- ↵Zhang J, Zhan J, Jin J, Ma C, Zhao R, O'Connell J, Jiang Y, 23andMe Research Team, Koelsch BL, Zhang H, 2024. An ensemble penalized regression method for multi-ancestry polygenic risk prediction. Nat Commun 15: 3238. 10.1038/s41467-024-47357-7
- ↵Zhao Z, Fritsche LG, Smith JA, Mukherjee B, Lee S. 2022. The construction of cross-population polygenic risk scores using transfer learning. Am J Hum Genet 109: 1998–2008. 10.1016/j.ajhg.2022.09.010
- ↵Zhuang F, Qi Z, Duan K, Xi D, Zhu Y, Zhu H, Xiong H, He Q. 2021. A comprehensive survey on transfer learning. Proc IEEE 109: 43–76. 10.1109/JPROC.2020.3004555