
Abstract
Understanding the molecular mechanisms underpinning convergent traits can provide insight into the predictability of the evolutionary process. The thylacine, an extinct marsupial carnivore, has been long known to have a very similar craniofacial morphology to that of eutherian canids, despite having diverged ≈160 million years ago. Using a massively parallel reporter assay (MPRA), we test the regulatory potential of a set of previously identified highly conserved craniofacial enhancers that showed convergent sequence acceleration in thylacine and wolf (TWARs). We compare orthologous sequences from six different taxa, including outgroup taxa with nonconvergent craniofacial phenotypes (Tasmanian devil and giant panda) and ancestral reconstructions for marsupial and placental carnivores (Dasyuromorphia and Carnivora). Dense 10 bp tiling allowed us to thoroughly examine features associated with activity, including percentage GC content and transcription factor binding motifs turnover. We identify marked conservation of levels and patterns of regulatory activity across all six taxa, as well as multiple cases of differentially active TWARs within each clade, with both thylacine and wolf driving functional divergence. However, evidence of convergent divergence relevant to craniofacial biology is limited to a TWAR with reduced activity in both the thylacine and wolf near the developmental gene LMO4. Ultimately our findings suggest that shared gene regulatory potential is not a feature of these convergently accelerated regions in the thylacine and wolf.
Convergent evolution is the independent emergence of the same traits in multiple lineages or populations, possibly in response to shared selective pressures. Echolocation, for example, is thought to have independently originated in marine mammals and bats as an adaptation to their low visibility habitats (Liu et al. 2010; Parker et al. 2013), with parallel amino acid substitutions in the cochlear motor protein PRESTIN in these animals pointing to its key specialized role in enabling the phenotype (Li et al. 2008; Choi 2011). However, other traits, such as the development of winged structures in birds and bats, exhibit convergence at the phenotypic level, but not necessarily at the level of independent base substitutions, highlighting the flexibility of developmental toolkits and ontogenetic processes (Orkney et al. 2025). Identifying and studying the genetic basis of convergent traits can therefore provide unique insight into the role of adaptation and constraint in trait evolution, and the repeatability of evolutionary processes.
The extinct marsupial thylacine (Thylacinus cynocephalus, also known as the Tasmanian tiger, and the Tasmanian dog by early European colonizers), displays high levels of morphological convergence with placental canids (Harris 1808), especially in the craniofacial region (Feigin et al. 2018; Newton et al. 2021) (Supplemental Fig. S1). In particular, morphometric analyses have shown high feature overlap in craniodental structures (Wroe and Milne 2007; Goswami et al. 2011; Feigin et al. 2018). Although its specific predatory behaviors and diet are disputed, the thylacine is universally agreed to have been a hypercarnivore, like most placental canids (Jones and Stoddart 1998; Wroe et al. 2007; Goswami et al. 2011; Rovinsky et al. 2021). This phenotypic convergence is thus hypothesized to be an adaptation to a shared feeding ecology requiring shearing of prey flesh.
We recently identified a set of 339 candidate cis-regulatory elements (CREs) active during murine craniofacial development that showed increased rates of substitution in the thylacine and the gray wolf (Canis lupus) relative to 61 vertebrate taxa. These thylacine-and-wolf-accelerated-regions, or TWARs (Feigin et al. 2019), are promising candidates for explaining craniofacial convergence across these taxa, but their effects on craniofacial development cannot be directly tested in either species. Here we have employed a massively parallel reporter assay (MPRA), to compare the gene regulatory potential of orthologs of these TWAR elements from the thylacine, wolf, and four outgroup taxa (Inoue and Ahituv 2015; Gallego Romero and Lea 2023). We identify putative functional CREs and test for convergence in two cell line models, mouse-derived cranial neural crest cells and preosteoblasts, chosen for their relevance to craniofacial development.
Results
Designing an MPRA to compare marsupial and placental enhancer sequences
To investigate the genetic basis of convergent evolution in the thylacine and wolf, we performed an episomal MPRA testing the regulatory potential of 295 orthologous TWAR sequences from the two species, alongside orthologous sequences from two species with a nonconvergent morphology and similar divergence times from the focal species, the Tasmanian devil, Sarcophilius harrisi (thylacine-Tasmanian devil TMRCA: 25–35 MYA (Duchêne et al. 2018)) and the giant panda, Ailuropoda melanoleuca (panda-wolf TMRCA = 40–50 MYA, Hassanin et al. 2021) and ancestral reconstructions of the two parent clades (Dasyuromorphia and Carnivora) (Fig. 1A). Due to the lack of suitable marsupial and canid cell lines, we were limited to using murine cell lines in our experiment. We determined that cranial neural crest cells (CNCCs) and preosteoblast cells represented the tractable cell types to examine enhancer activity of our library, given we previously observed strong ontogenetic similarity and adult convergence in thylacine and wolf skull bones derived from fronto-nasal neural crest (NC) and mesodermal origins (Newton et al. 2021). Both cell types chosen possess the capacity to differentiate into osteoblasts and form calcifed condensations (Wang et al. 1999; Ishii et al. 2012; Mishina and Snider 2014). We thus also included the murine orthologous sequence of all tested TWARs to account for any effects driven by the mouse trans-regulatory environment.
Performing an MPRA to test convergence of regulatory activity. (A) Orthologous TWAR sequences from seven different taxa—two test (thylacine and wolf), two outgroup (Tasmanian devil and panda), two ancestral (Dasyuromorphia and Carnivora) and one control (mouse) taxa were tested for activity in an episomal MPRA. Elements longer than 170 bp were covered with overlapping tiles in 10 bp steps. The cloned library was transfected into preosteoblasts and CNCCs. TWARs were then tested for convergent differential activity within each clade. (B) Number of tiled library sequences and the number of TWARs and controls with at least 1 tile captured in each cell line. (C) Number of active tiled library sequences and number of TWARs and controls with at least one active tile captured in each cell line (D) Correlation of log2 activity for library sequences in preosteoblasts and CNCCs (with significantly active library sequences in green). (E) Proportion of TWARs and cell-line specific positive controls determined to be active in each cell line. (F) Proportion of active tiles versus the total number of tiles captured for each multi-tiled TWAR and control sequence, for each cell line. (G) Proportion of TWARs from each taxa determined to be active in each cell line.
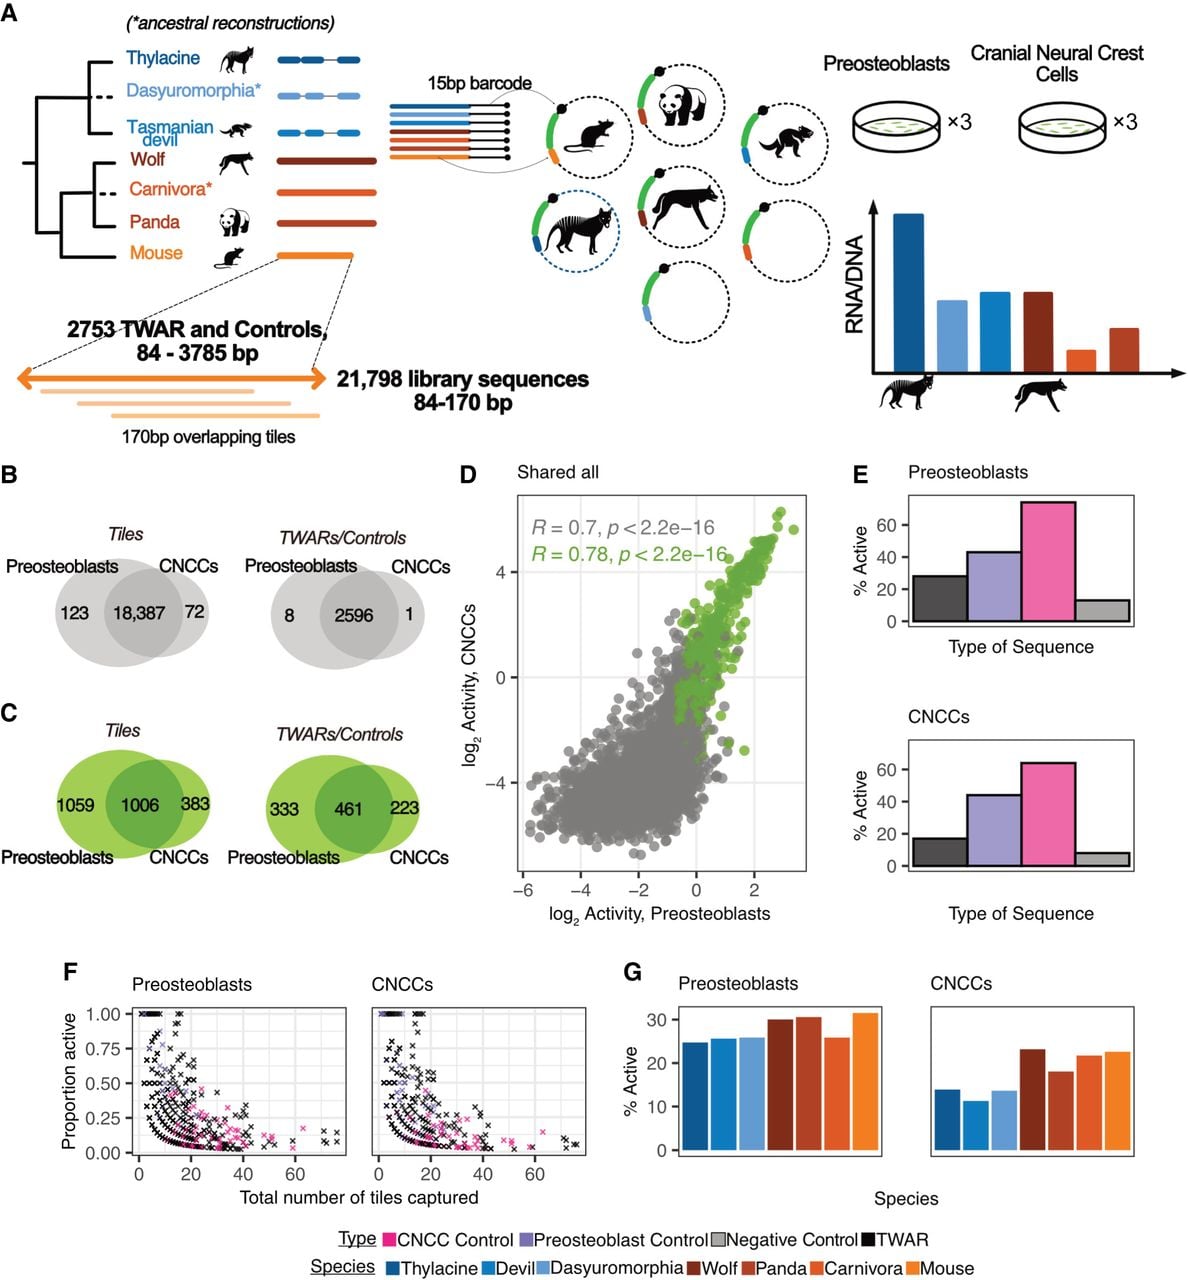
TWAR lengths ranged from 84 to 1001 bp; thus we tiled across elements longer than 170 bp with a 10 bp sliding window, enabling us to examine the regulatory potential of the whole TWAR at high resolution. However, because TWAR orthologs can display variable lengths and alignment, we note that tiles did not always map 1-to-1 across taxa. Our library consisted of 21,798 unique oligos (representing 2753 distinct TWAR and control elements) (Supplemental Table S1). The synthesized library was tagged with a median of 337 barcodes/oligo (Supplemental Fig. S2), assembled into an episomal vector, and transfected into 3× replicates per cell line. After sequencing and quality control, we found that ≈85% of the library was captured in both cell lines (preosteoblasts: 18,510, CNCCs: 18,459) (Fig. 1B), with 2065 significantly active sequences (11.2% of tested) in preosteoblasts (log2 activity between −0.82 and 3.36) and 1389 (7.5%) in CNCCs (log2 activity between −3.5 and 6.28) (Fig. 1C). The lower range in activity values in the CNCCs is due to a technical artifact in the sequencing of mRNA from CNCCs (Supplemental Figs. S3 and S4, see Methods); despite this, 72.4% (1006) of the library sequences active in CNCCs were also active in preosteoblasts, demonstrating high reproducibility. Spearman’s correlation between activity values in the two cell lines was 0.70, increasing to 0.78 for shared active sequences (Fig. 1D). The proportion of the negative controls that were active was lower than of the positive control and TWARs, and in every cell line replicate, the distribution of activity for these negative controls was significantly lower than those for the positive controls and the TWARs (Fig. 1E, Supplemental Fig. S5A,C, BH-adjusted pairwise t-tests results in Supplemental Table S2). It is worth noting that negative controls in MPRA experiments can sometimes display low levels of activity due to the stochastic nature of expression control and are best thought of as capturing the baseline activity of the minimal promoter in the reporter plasmid rather than a complete absence of activity.
Our overlapping tile design helped compensate for the loss of individual library sequences during cloning/transfection. By examining sequence coverage across complete TWAR and control sequences, we found that 2569 (out of 2626 TWARs with >0 coverage, 97.8%) and 2563 (out of 2620, 97.8%) have at least 80% coverage in preosteoblasts and CNCCs data sets, respectively (Supplemental Fig. S6). We observed that regulatory potential is not uniform across tested sequences. For both TWARs and positive controls the overall region length was inversely correlated with the proportion of active tiles (Fig. 1F). The mean and median number of active tiles for multi-tiled TWARs was 2.0 and 2.6 in the preosteoblasts and 1.0 and 2.5 in the CNCCs. When focusing on the subset of active TWARs in each cell line for which (i) all tiles were captured and (ii) more than one tile was found active (146 in preosteoblasts and 78 in CNCCs), the median distance between active tiles was estimated to be 10 nt, i.e., most active tiles within this subset were neighboring each other and shared most of their sequence (Supplemental Fig. S7). These observations are consistent with a role for small transcription factor binding motifs in driving regulatory activity within promoter and enhancer regions. This also underlies the lack of activity in some of our cell-line specific positive controls; 83.9% of controls <170 bp were active, greater than the overall percentage of 48.7% that were active.
To assess the impact of the murine trans-regulatory environment, we compared TWAR activity for each of the test taxa with that of the orthologous mouse sequence. Activity values were not significantly different between the mouse and any of the other taxa in either cell line (BH-adjusted pairwise t-test results in Supplemental Table S3, Supplemental Fig. S5B,D). The percentage of active TWARs did not differ significantly among the placental taxa, with pairwise differences ranging from 0.9%–5.6% in preosteoblasts and 0.5%–4.3% in CNCCs (Fig. 1G, BH-adjusted two-proportion tests in Supplemental Table S4). The mouse had the highest and the second-highest percentage of active TWARs in the preosteoblasts (31.5%) and CNCCs (21.5%, slightly lower than the 22% of active wolf TWARs) respectively and all placental taxa, excluding the Carnivora in preosteoblasts, had a greater percentage of active TWARs than the three marsupial taxa (pairwise differences ranging 4.1%–6.8% in preosteoblasts and 4.0%–11.3% in CNCCs). This could indicate a slight placental bias arising from the placental trans environment; however, these differences were not statistically significant (two-proportion tests in Supplemental Table S4).
Genomic features underlying TWAR activity
To identify genomic features driving activity in our assay, we first used FIMO to scan TWARs for transcription factor binding motifs (TFBMs) from the HOCOMOCO Mouse Core v11, summarizing all motifs inside a TWAR into a single metric that ranges from 0-1 and can be directly compared across all orthologs of a given TWAR (see Methods). Active TWARs have significantly higher aggregated FIMO scores than inactive TWARs (Fig. 2A) (pairwise t-test, preosteoblasts p-value: 3.386 × 10⁻¹⁷, CNCCs p-value: 4.794 × 10⁻¹⁷). We also observed that active TWARs also had significantly higher percentage GC content, consistent with the well-known association of GC-rich DNA with open chromatin, promoters and broadly active enhancers (Fenouil et al. 2012; Colbran et al. 2017) (Fig. 2B) (t-test preosteoblasts p-value: 3.027 × 10⁻¹⁰, CNCCs p-value: 1.459 × 10⁻¹⁸). Finally, we classified TWARs within 1 kb of a mouse (GRCm38) transcription start site as promoters and the rest as enhancers (26 and 271, respectively), to test for any differences in activity between distal and proximal elements. There was no enrichment for activity in proximal sequences relative to distal ones (Fisher’s exact test, preosteoblasts p-value: 0.447, CNCCs p-value: 0.454) (Fig. 2C). Furthermore, there was only a weak association between the absolute distance from a transcription start site in mouse to the proportion of taxa in which a TWAR was determined to be active, in either cell line (see Methods).
Examining sequence features driving the activity of TWARs. Distribution of (A) aggregated FIMO scores and (B) percentage GC content for active and nonactive TWARs, for both cell lines. (C) Distribution of active and nonactive TWARs in cell lines by their distance from a transcription start site in the mouse genome. (D) Distribution of pairwise sequence distances between each pair of TWAR orthologs that display shared or divergent activity. (E) Correlation between pairwise sequence distance and absolute activity differences for each pair of TWAR orthologs.
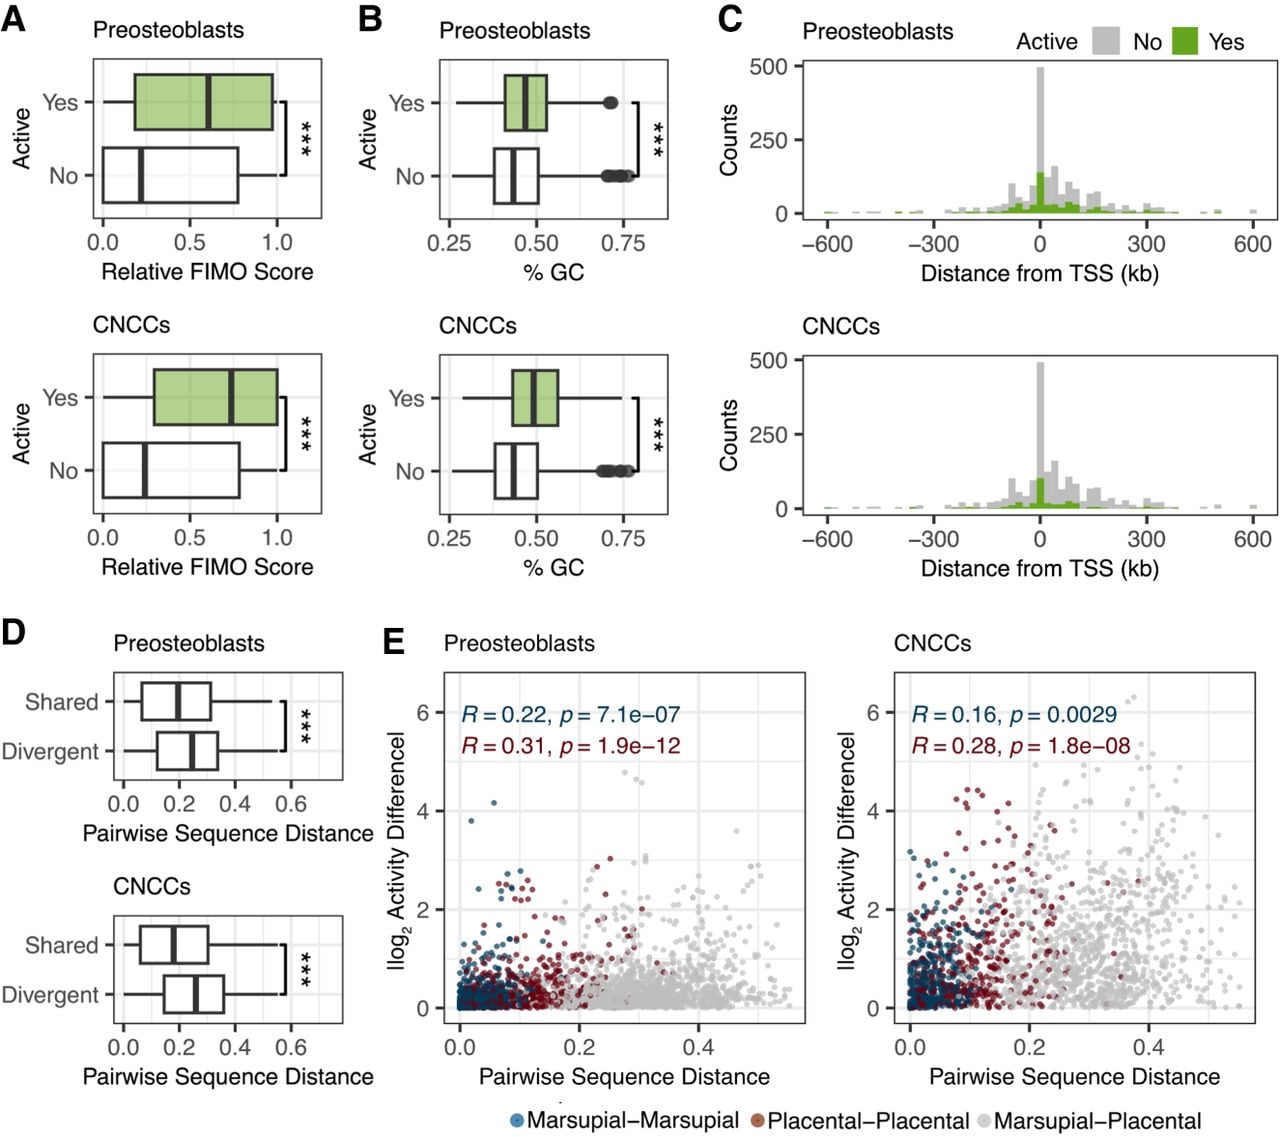
We then examined the role of sequence divergence in influencing patterns of TWAR activity. Overall, 167 TWARs in preosteoblasts and 120 in the CNCCs were active in at least one of the six tested taxa. Of these 117 (70.0%) and 83 (56.5%), respectively, were active in more than one taxon (Supplemental Fig. S8). Considering only TWARs with demonstrated activity in at least one taxa, we observed significantly higher pairwise sequence distances between pairs of orthologous TWARs that show divergent activity (one active, one inactive) than pairs of orthologous TWARs for which activity was shared (both active or inactive) (Fig. 2D) (pairwise t-test preosteoblasts p-value: 1.950 × 10⁻¹⁰, CNCCs p-value: 1.440 × 10⁻¹⁹). Differences in relative FIMO scores were also significantly larger between pairs of orthologous TWARs with divergent activity (Supplemental Fig. S9) (t-test preosteoblasts p-value: 0.0004, CNCCs p-value: 4.630 × 10⁻¹⁵). Spearman’s ρ between pairwise sequence distance and absolute activity differences was 0.21 (p-value 1.86 × 10⁻³³) in preosteoblasts and 0.28 (p-value 7.41 × 10⁻²⁶) in CNCCs. We observed higher correlations for the placental-placental comparisons in both cell lines than the marsupial-marsupial comparisons (Fig. 2E). This is likely due to the overall greater sequence similarity between the marsupial orthologs (mean pairwise sequence distance thylacine vs. Tasmanian devil: 0.068, thylacine vs. Dasyuromorphia: 0.015, Tasmanian devil vs. Dasyuromorphia: 0.054, wolf vs. panda: 0.166, wolf vs. Carnivora: 0.154 and panda vs. Carnivora: 0.043) (Supplemental Fig. S10).
Examining patterns of TWAR activity across taxa
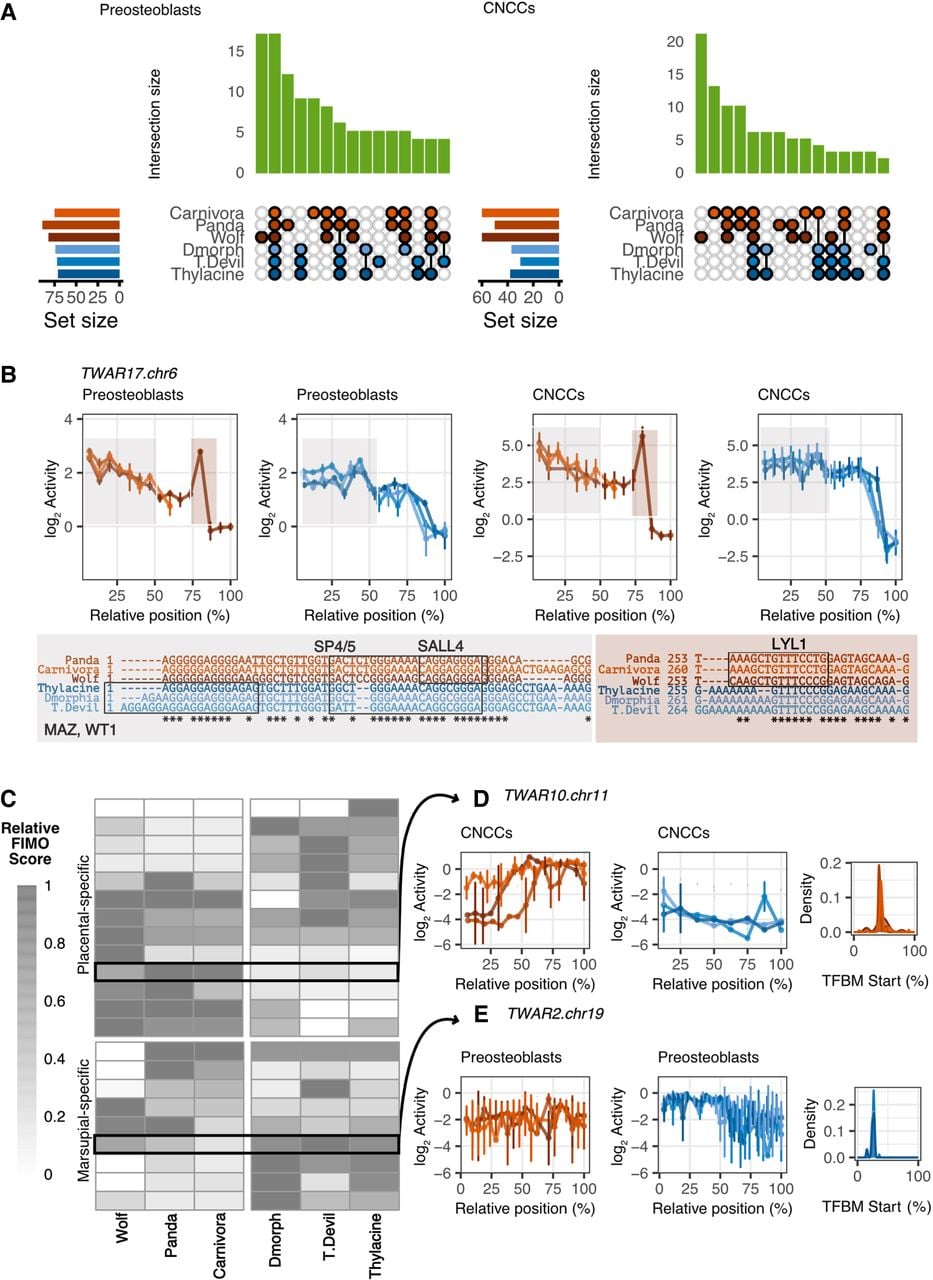
Seventeen TWARs displayed significant activity across all six taxa in the preosteoblasts, with six being also universally active in CNCCs (Fig. 3A, Supplemental Tables S5 and S6). Variation across taxa in TWAR lengths and thus tile numbers confounded 1:1 tile activity comparisons but activity-by-tile plots of all conserved elements are available as Supplemental File S1. The top-ranked TWAR by activity in all taxa was TWAR17.chr6; 85% of tiles in this TWAR were significantly active in all taxa. Our sliding window design identified a consistent pattern of decreasing activity when moving across tiles (5′ to 3′) in the TWAR (Fig. 3B). Although only the first six panda and seven of the first eight Carnivora tiles were present in the final library, the orthologous mouse sequence had activity patterns nearly identical to those of the wolf, with a peak of activity in tile 12 (Wolf—Mouse Spearman’s ρ preosteoblasts: 0.86, CNCCs: 0.91) (Supplemental Fig. S11). Zooming in, our FIMO analyses identified a cluster of TFBMs within the first 70 bp of TWAR17.chr6 (Supplemental Fig. S12), while the peak in activity in tile 12 for the wolf ortholog (spanning positions 111–280 in the sequence) overlapped a placental-specific binding site for LYL1 (at positions 254–267). TWAR17.chr6 intersects with a super-enhancer in mouse embryonic stem cells for the neighboring ATF7IP (Khan and Zhang 2016), known to inhibit premature differentiation of progenitor cells (including the preosteoblasts used in our study) (Tsusaka et al. 2020; Hu et al. 2023; Wu et al. 2023). Thus it is likely that the endogenous gene regulatory network that regulates ATF7IP expression is highly active in our cell lines and driving these activity patterns.
Functional conservation of activity across taxa. Dark blue: thylacine, medium blue: Tasmanian devil, light blue: Dasyuromorphia; dark red: wolf, medium red: panda, light red: Carnivora. (A) UpSet plot (top 15 combinations) displaying overlap in active TWARs among the six focal taxa across both cell lines. (B) Patterns of activity across tiles for TWAR17.chr6 in marsupial and placental taxa. Due to variation in the number of tiles across taxa, tile number has been summarized as relative to the total number of tiles (“Relative position”). Boxes identify TFBMs motifs present in the sequences for this TWAR highlighted in the plots. (C) Heatmap of relative FIMO scores for every TWAR with marsupial- or placental-specific activity in either cell line. (D) Activity across tiles of the placental-active TWAR10.chr11 for all taxa in the CNCCs, along with distribution of binding motifs across sequence length for the placentals. (E) Activity across tiles of the marsupial-active TWAR2.chr19 for all taxa in the preosteoblasts, along with distribution of binding motifs across sequence length specifically for the marsupials.
As originally defined, all TWARs overlapped H3K9ac and H3K27ac peaks in mouse craniofacial tissues collected at E11.5 in The ENCODE Project Consortium (2012). Recently, we published a novel H3K27ac and H3K4me3 ChIP-seq data set from craniofacial tissue of newborn fat-tailed dunnarts (Sminthopis crassicaudata), a carnivorous dasyurid marsupial model species (Cook et al. 2025) that diverged from the thylacine 25–35 million years (Duchêne et al. 2018). Of the 17 universally active TWARs, 12, including TWAR17.chr6 overlapped or were adjacent to dunnart H3K27ac and/or H3K4me3 peaks, also confirming their activity in the craniofacial region of a developing dasyurid and their broad enhancer potential across therians.
Having established that our MPRA could distinguish TWARs with broad gene regulatory potential, we sought to establish its capacity to detect regulatory changes over long evolutionary distances. We identified TWARs with marsupial and placental-specific regulatory behavior—eight TWARs in preosteoblasts and one in CNCCs, were exclusively active in the marsupial carnivores, and six TWARs in preosteoblasts and eight in CNCCs (one overlapping) were exclusively active in the placental carnivores (Supplemental Tables S5, S6 and Supplemental File S2). Aggregated FIMO scores were higher in the marsupials for marsupial-active TWARs (mean difference marsupials—placentals 0.180, pairwise t-test p-value 0.055) and higher in placentals for the placental active TWARs (mean difference 0.128, p-value 0.128). While these differences were not significant overall, clustering elements by their aggregated FIMO scores highlights individual examples of clade-specific regulatory activity associated with clade-specific binding motifs (Fig. 3C). For instance, TWAR10.chr11 displayed placental-specific activity in CNCCs (Fig. 3D), with identical tile activity patterns across all three placental taxa. These correlated with the presence of TFBMs for SP/KLF family proteins in these sequences. Similarly, the first half of TWAR2.chr19 displayed marsupial-specific activity in the preosteoblasts (Fig. 3E), consistent with a cluster of TFBMs for ELF5, ETV2, KLF15, MAZ, SP5 and SP1 in the region. TWAR2.chr19 was also distinguished by a stronger H3K27ac and H3K4me3 signal in the dunnart (which shares these motifs) than the mouse (Supplemental Fig. S13). Across the clade-specific active TWARs, five (63%) marsupial-specific and four (31%) placental-specific TWARs overlapped or were adjacent to H3K27ac and/or H3K4me3 peaks in dunnart craniofacial tissue, confirming the ability of our MPRA to detect less conserved activity patterns.
Characterizing differential TWAR activity in the thylacine and wolf
We then asked whether any TWARs exhibited activity patterns unique to the wolf or thylacine sequences. By assessing binary active/inactive trends, we found a distinct signal of unique behavior for the wolf—23 TWARs in preosteoblasts and 24 in CNCCs were either only active or inactive in this species (Supplemental Fig. S8). To assess differential activity systematically, we applied the mpralm framework (Myint et al. 2019) (Methods). Given the large evolutionary and sequence distance separating our two focal species, these analyses were carried separately within each clade; additionally they were restricted to TWARs that were active in at least one species within the clade. We found that 33 TWARs (out of 110, 30.0%) in preosteoblasts and 11 TWARs in CNCCs (out of 50, 22.0%) were significantly differentially active (DA) (adjusted p-value < 0.05) and had a pairwise fold-change (FC) > 0.10 between the thylacine and Tasmanian devil and/or the thylacine and Dasyuromorphia (Fig. 4A). Of these, 8 were shared between both cells lines, and 7/8 had identical directions of effect. An additional 18 TWARs in the preosteoblasts and none in the CNCCs were significantly differentially active but had FC < 0.10 relative to the Thylacine. In parallel, we investigated whether wolf TWAR activity differed from that of the panda and Carnivora, determining that, 40 (out of 134, 29.9%) TWARs were DA in preosteoblasts and 21 were DA in CNCCs (out of 103, 20.3%) with a FC > 0.10; 11 were shared and 10/11 had an identical direction of effect. Only 6 TWARs in the preosteoblasts and none in the CNCCs were differentially active with FC smaller than 0.10 relative to the wolf. Plots displaying log2 activity across species for every differentially active TWAR are available in Supplemental File S3.
Differential activity of TWARs within the marsupials and placentals. (A) UpSet plot displaying overlap in TWARs found to be differentially active (DA) among the marsupials and the placentals in each cell line. (B) Comparisons of activity differences between the test and outgroup taxa to the differences in activity between the test and ancestral taxa for marsupial and placental differentially active (DA) TWARs in both cell lines. (C) Distributions of activity differences between each pair of taxa for marsupial and placental DA TWARs in both cell lines.
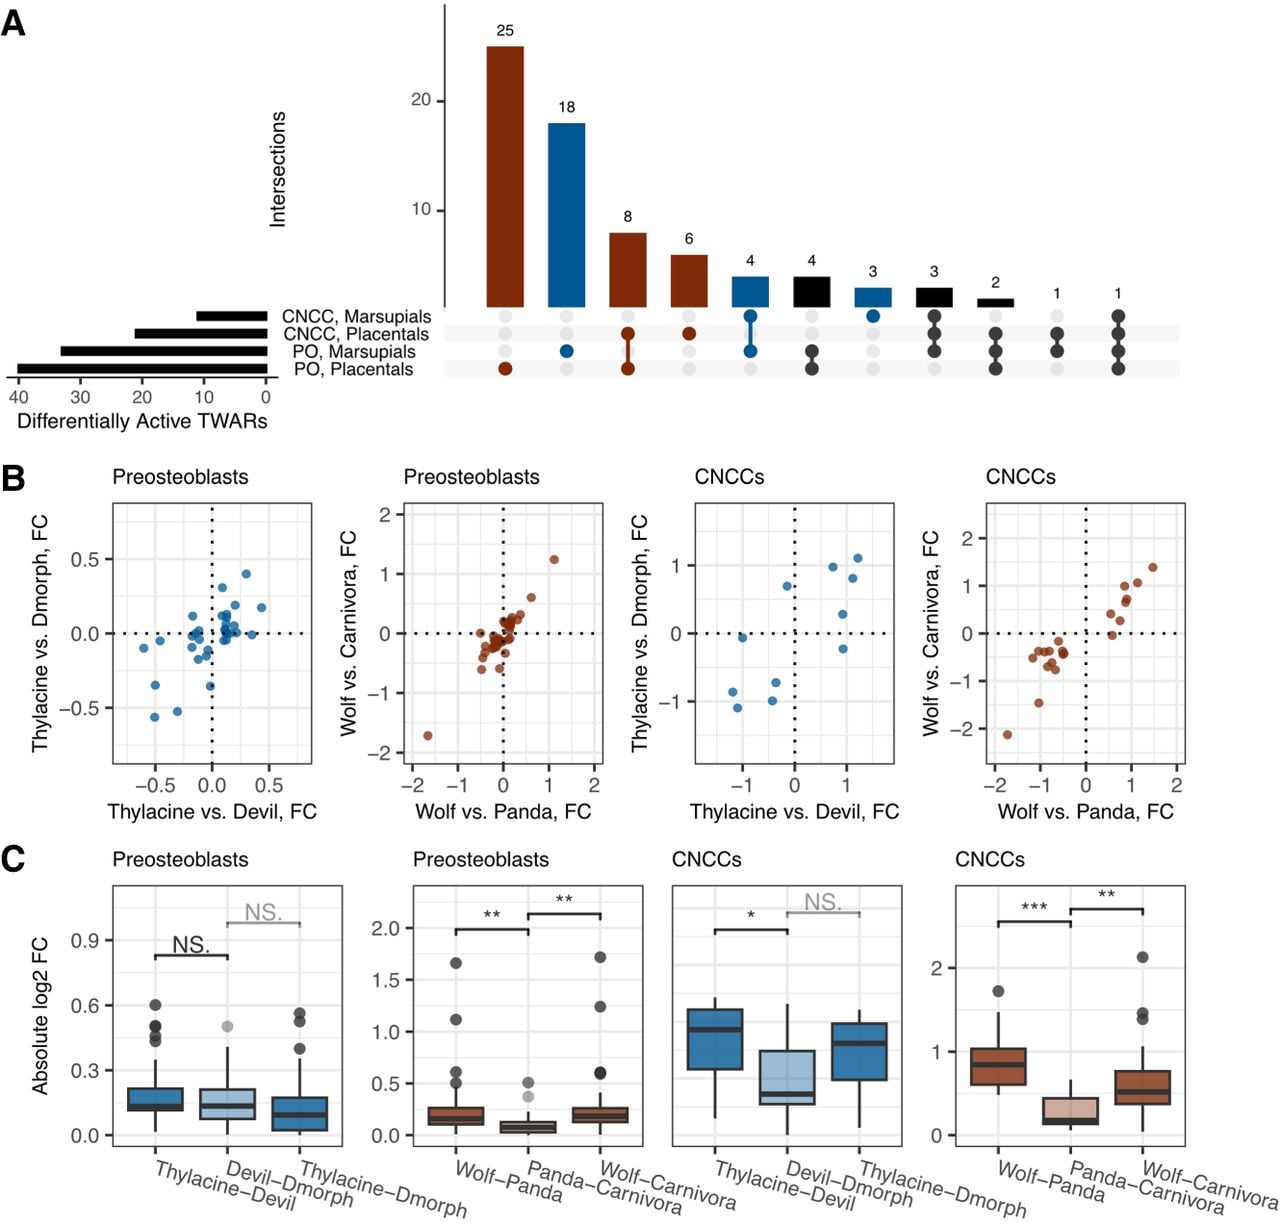
For both taxa in each cell line, we observe a positive linear correlation in log2 fold-changes in the focal species relative to the outgroup and the ancestor (Pearson’s R 0.64–0.92; Fig. 4B), indicating that the thylacine and wolf elements were driving differentially activity within their clade. This was particularly evident among the placentals—absolute fold changes in activity between the wolf and the panda, and the wolf and Carnivora were significantly larger than those between the panda and Carnivora (Fig. 4C) (pairwise t-test p-values, Wolf-Panda vs. Panda-Carnivora, POs: 0.006, CNCCs: 6.32 × 10⁻⁸; Wolf-Carnivora vs. Panda-Carnivora, POs: 0.003, CNCCs: 0.003). While a similar pattern of fold-change distribution was observed for thylacine, only one comparison was significant in the CNCCs (Thylacine-Devil vs. Devil-Dasyuromorphia, p-value 0.044). This is possibly due to the greater overlap in sequence composition of the marsupial TWARs (Supplemental Fig. S10). The highest pairwise log2 fold-change relative to the thylacine for each TWAR ranged between 0.103 and 0.602 in the preosteoblasts and 0.695 and 1.22 in the CNCCs; the highest pairwise fold-change relative to the wolf ranged between 0.105 and 1.72 in the preosteoblasts and 0.482 and 2.13 in the CNCCs. Fewer differentially active TWARs with smaller effect sizes were thus captured in CNCCs, which could be due to technical challenges associated with this cell line.
To identify associations between the presence of TFBMs and differential TWAR activity, we recalculated our FIMO scores for each TWAR relative to the most active ortholog separately for each clade. FIMO scores were overall comparable between DA TWARs than non-DA TWARs for both marsupials and placentals (Supplemental Fig. S14). For placental differentially active TWARs, the direction of effect was significantly associated with differences in FIMO scores—TWARs with increased activity in the wolf relative to other placental taxa also have higher FIMO scores in the wolf than the other two taxa, and vice versa (Fig. 5A) (pairwise t-test p-values Wolf-Panda 0.009; Wolf-Carnivora 0.005).
Transcription factor binding and differential activity. Dark blue: thylacine, medium blue: Tasmanian devil, light blue: Dasyuromorphia; dark red: wolf, medium red: panda, light red: Carnivora. (A) Differences in FIMO scores between the test species and the outgroup or ancestral taxon, for DA TWARs that have gained (+) or lost (−) activity in the focal species. (B) Relative FIMO scores for differentially active (DA) TWARs in the marsupials and placentals for both cell lines. Direction of effect highlights if the thylacine/wolf (“test”) TWARs have gained activity relative to both outgroup (“O”) and ancestor (“A”) (+ +), lost activity relative to both outgroup and ancestor (− −) or have intermediate activity to that of the outgroup and ancestor (+ −). Note the concordance in direction for DA TWARs across cell lines. (C) Activity across tiles of the differentially active TWAR27.chr3 for marsupial taxa; highlighted are the Tasmanian devil-specific binding motifs associated with Tasmanian devil-active tiles for this TWAR. (D) Activity across tile in the preosteoblasts and CNCCs for the placental differentially active TWAR17.chr1, as well as density of TFBMs along the lengths of these sequences. The sequence alignments highlight the wolf-specific sequence containing clusters of binding motifs.
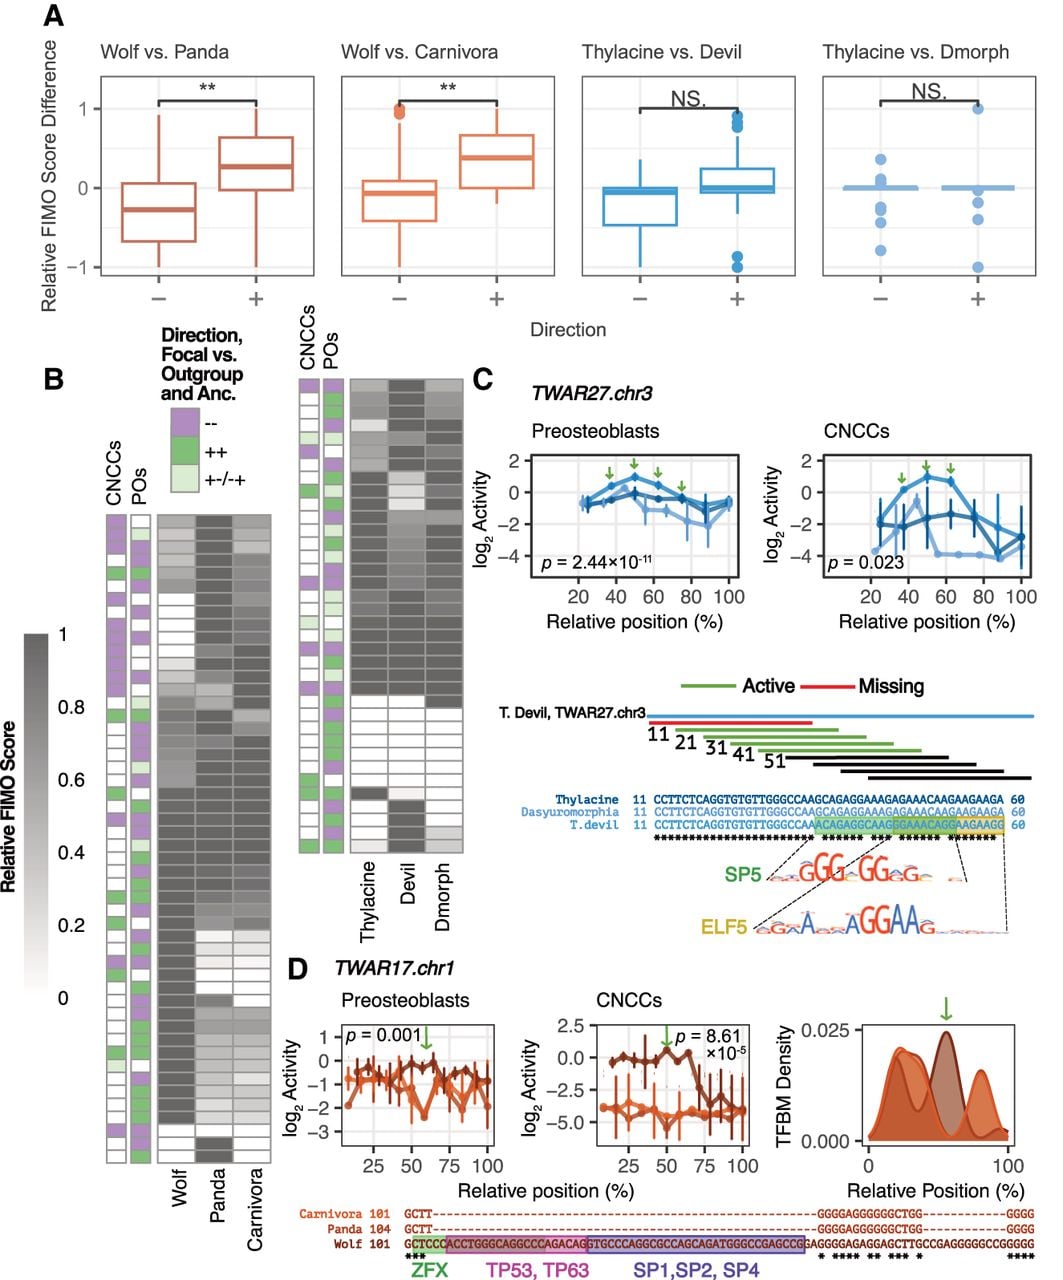
Clustering differentially active TWARs in each clade by their FIMO scores, we identified several examples for which direction of activity could be linked to variation in FIMO scores (Fig. 5B). Taking advantage of the fact that our tiling design traverses TWARs 10 bp at a time, we examine how activity patterns and binding motifs change across a TWAR’s length at high resolution. For instance, TWAR27.chr3 was differentially active between marsupials (Fig. 5C; BH-adjusted p-value preosteoblasts 2.44 × 10⁻¹¹, CNCCs 0.023), Supplemental Tables S7–S10). Both Tasmanian devil and Dasyuromorphia TWAR orthologs were more active than the thylacine one, with higher differences in activity between Tasmanian devil and thylacine (log2 FC preosteoblasts −0.602, CNCCs −1.00) than between the thylacine and Dasyuromorphia (log2 FC POs −0.099, CNCCs, −0.066). In the Tasmanian devil activity peaked between tiles 2–5; examining sequence covered uniquely by these tiles (11–60 nt) we found 3 fixed single nucleotides differences in the Tasmanian devil relative to the other marsupials, which span predicted TFBMs for ELF5, ETS2, ETV2, MAZ and SP5. Similarly, TWAR17.chr1, displayed increased regulatory potential in the wolf relative to other placentals (Fig. 5D; preosteoblasts: BH-adjusted p-value 0.001; log2 FC Wolf-Panda 0.032, Wolf-Carnivora 0.171. CNCCs: BH-adjusted p-value 8.61 × 10⁻⁵; log2 FC Wolf-Panda 0.871, Wolf-Carnivora 0.651). Higher log2 activity was observed in wolf in tiles corresponding to unique sequence at positions 105–159 nt of the wolf ortholog. This sequence does not align with other placental orthologs and contains a cluster of binding motifs, including for ZFX, TP53, TP63 and SP/KLF transcription factors (Fig. 5D). These examples illustrate how combining evidence of activity and tiling patterns from the MPRA with sequence changes and FIMO results can provide granular insights into drivers of functional change within individual noncoding elements.
Limited regulatory convergence of the thylacine and wolf accelerated regions
Our initial hypothesis was that shared sequence acceleration of the TWARs for thylacine and wolf would be reflected in convergent patterns of regulatory activity. Ultimately however, only 11 TWARs were differentially active in both the marsupials and placentals across the two cell lines (Fig. 4A, Supplemental Table S11; Supplemental File S3). Of these, four agree in the direction of effect in the thylacine and the wolf, and TWAR27.chr3 is distinguished by its proximity to genes with known roles in craniofacial development. As discussed in the previous section, TWAR27.chr3 has significantly lower activity in the thylacine relative to the other two marsupials in both cell lines, an effect that colocalizes with specific nucleotide changes (Fig. 6A). A 123 bp deletion in the wolf sequence also resulted in ablation of its regulatory potential, which is significantly lower than the other placentals in the CNCCs (Fig. 6B,C, Supplemental Fig. S15; BH-adjusted p-value = 0.029; log2 FC Wolf-Panda = −0.843, Wolf-Carnivora = −0.699). The orthologous region to this TWAR in mouse is 97 kb downstream from LMO4, known to be expressed in pre-migratory neural crest cells, regulating their formation (Kenny et al. 1998; Ochoa et al. 2012).
TWARs with convergent regulatory activity. Dark blue: thylacine, medium blue: Tasmanian devil, light blue: Dasyuromorphia; dark red: wolf, medium red: panda, light red: Carnivora. (A) Activity across tiles of the TWAR27.chr3 for marsupials (preosteoblasts and CNCCs). (B) Activity of most active tile for each placental ortholog of TWAR27.chr3 in the CNCCs. (C) Density of transcription factor binding motifs across the length of the placental orthologs of TWAR27.chr3. (D) Activity in the preosteoblasts of the single-tiled TWAR34.chr2 for the marsupials and placentals, and the relative FIMO score (0–1) for each ortholog within a clade. (E) Activity in the preosteoblasts of the single-tiled TWAR7.chr4 for the marsupials and placentals, and the relative FIMO score (0–1) for each ortholog within a clade.
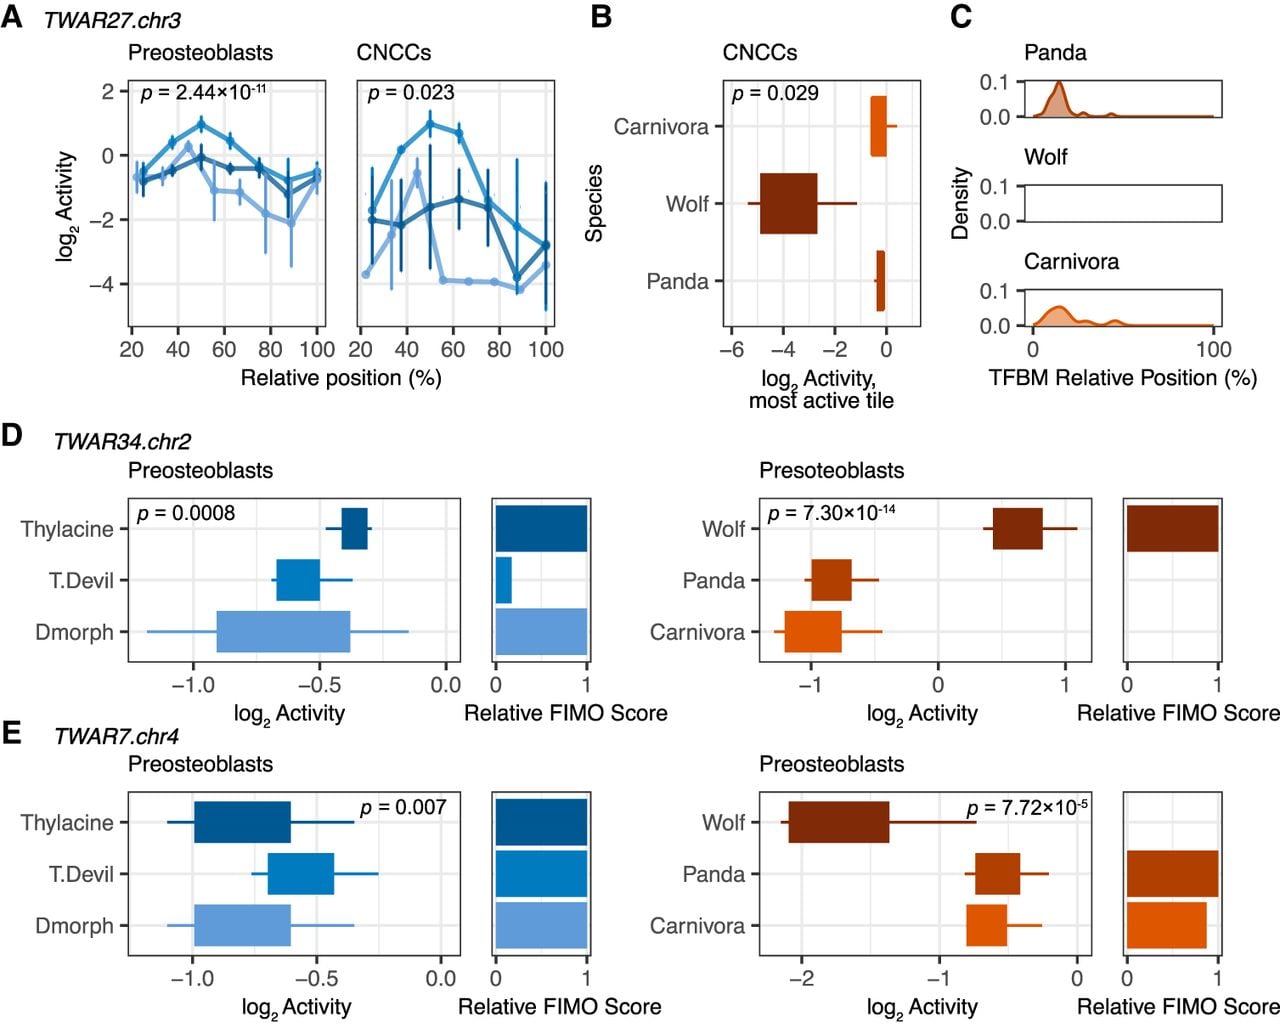
The single-tile TWAR34.chr2 (124.kb upstream NUP35) had significantly reduced activity in the thylacine (Fig. 6D); preosteoblasts: BH-adjusted p-value = 0.0008; log2 FC Thylacine-T.devil = 0.203, Thylacine-Dasyuromorphia = 0.189) and wolf (preosteoblasts: BH-adjusted p-value = 7.30 × 10⁻¹⁴; log2 FC Wolf-Panda = 1.12, Wolf-Carnivora = 1.24). The wolf TWAR7.chr4 showed significantly lower regulatory potential (preosteoblasts: BH-adjusted p-value = 7.72 × 10⁻⁵) than the panda (log2 FC −0.216) and Carnivora (log2 FC −0.245) orthologs (Fig. 6E). This TWAR was also differentially active in the marsupials (BH-adjusted p-value = 0.007); the thylacine and Dasyuromorphia display lower activity relative to the Tasmanian devil (log2 FC Thylacine-T. Devil = −0.145, Dasyuromorphia-T. Devil = −0.145). TWAR7.chr4 is 932 bp downstream from the Snx30 in the mouse genome. While both SNX30 and NUP35 have crucial roles in cell processes (intracellular trafficking and forming the nuclear pore complex, respectively) (Chen et al. 2018; Antón et al. 2020), neither have been implicated in craniofacial biology.
TWAR6.chr14 was uniquely differentially active in each clade in both the preosteoblasts (Fig. 7A,B; BH-adjusted p-value marsupials 4.88 × 10⁻⁹; placentals 1.75 × 10⁻⁹) and CNCCs (BH-adjusted p-value marsupials 3.72 × 10⁻⁴; placentals 1.36 × 10⁻⁶), although it had opposing directions of effect in the thylacine (reduced regulatory potential, preosteoblasts log2 FC Thylacine-T. Devil −0.500, Thylacine-Dasyuromorphia −0.348; CNCCs log2 FC Thylacine-T. Devil −1.19, Thylacine-Dasyuromorphia −0.862) and wolf (gained regulatory potential, POs log2 FC Wolf-Panda 0.610, Wolf-Carnivora 0.603; CNCCs log2 FC Wolf-Panda 1.47; Wolf-Carnivora 1.39). These changes correlated to sequence features within each group; increased activity in the Tasmanian devil and Dasyuromorphia TWAR6.chr14 relative to the thylacine was limited to their last two tiles. We observe a cluster of sequence differences in the last 13 bp of the Tasmanian devil and dasyuromorphia sequences, as well as TFBMs from the SP/KLF family that mapped to these positions only in the former (Fig. 7C). Likewise, gain-of-activity in the wolf TWAR6.chr14 was associated to a 22 bp deletion which introduces two unique binding motifs for ZBTB17 and ZNF143 absent in the other therian taxa (Supplemental Fig. S17). TWAR6.chr14 is in the promoter region of CHD8, which is involved in the patterning and differentiation of cranial neural crest cells (Kasah et al. 2018; Fan et al. 2021); as such, there is some evidence that this TWAR may have functional contribution to the thylacine-wolf convergent phenotype. However, the lack of concordance in direction of effect complicates interpretability across clades.
Regulatory convergence through nonidentical changes. Dark blue: thylacine, medium blue: Tasmanian devil, light blue: Dasyuromorphia; dark red: wolf, medium red: panda, light red: Carnivora. (A) Activity across tiles of TWAR6.chr14 for marsupials and placentals in each cell line. The arrow corresponds to tiles with increased activity in the Tasmanian devil which also have Tasmanian devil-specific biding motifs. (B) The schematic compares the constitutive tiles of TWAR6.chr14 for the wolf and panda; it describes how although we have lost the last two panda tiles for this TWAR, panda sequences orthologous to wolf tiles that have significant activity are indeed present in our data set. (C) Distribution of binding motifs for the marsupial taxa, with the Tasmanian devil-specific binding motif indicated by the arrow. (D) Activity across tiles of TWAR8.chr7 in the thylacine and Tasmanian devil. (E) Activity across tiles of TWAR9.chr7 for all of the placental taxa. (F) Position of the TWAR8.chr7 and TWAR9.chr7 in the mouse genome in intron 11 and 5 of Ebf3, respectively.
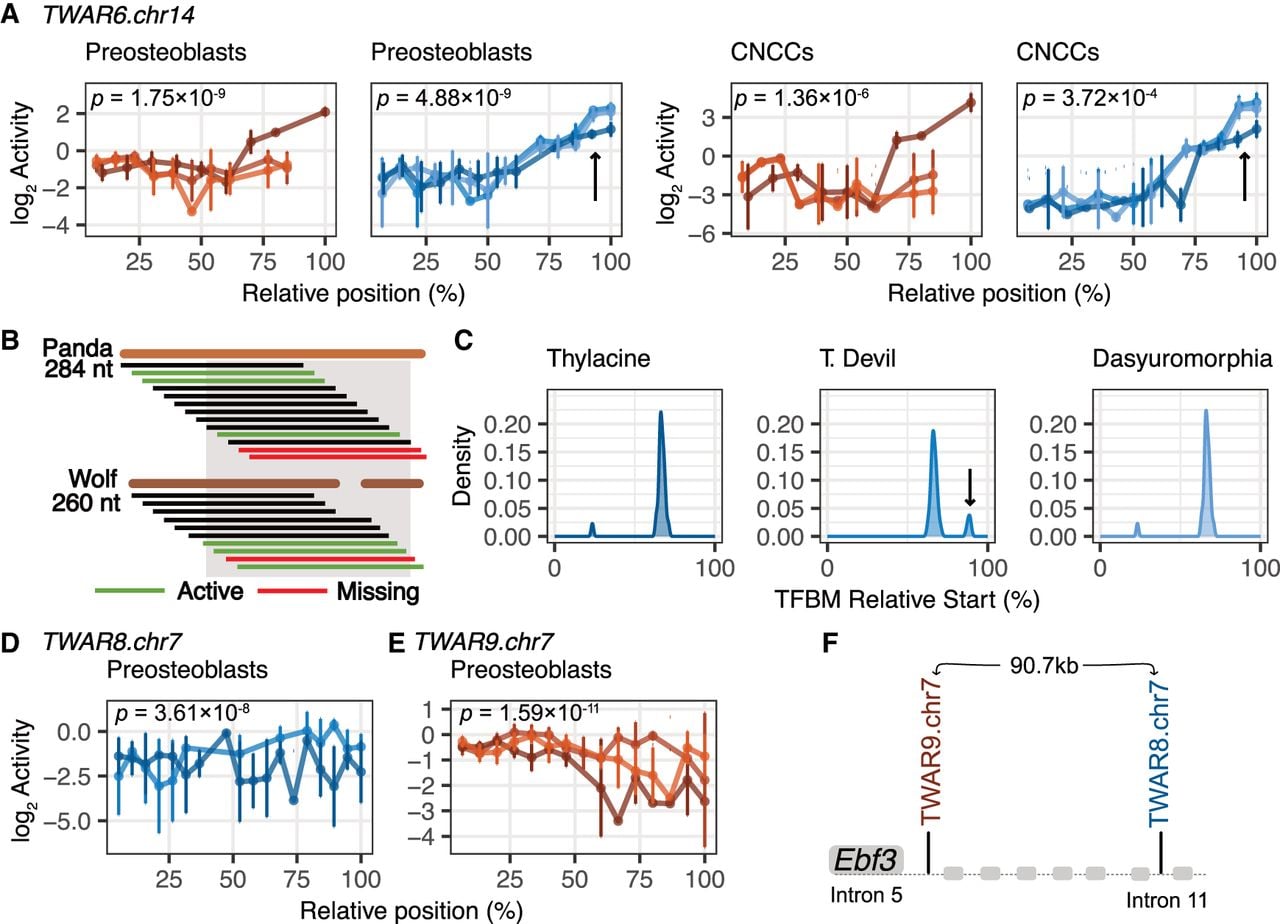
Given the limited evidence for convergence at individual loci, we finally turned to searching for overlaps in molecular functions or pathways among genes near the other marsupial and placental DA TWARs. We found one instance of potential regulatory convergence near a gene involved in craniofacial biology. TWAR8.chr7 had significantly reduced expression in the thylacine in the preosteoblasts, with absolute fold-change >0.10 relative to the Tasmanian devil (Fig. 7D, Supplemental Fig. S16A,C; BH-adjusted p-value = 3.61 × 10⁻⁸; log2 FC Thylacine-T. devil = −0.458, Thylacine-Dasyuromorphia = −0.050). TWAR9.chr7 had significantly reduced expression relative to the other two placentals, in both cell lines (Fig. 7E, Supplemental Fig. S16B,D,E); preosteoblasts: BH-adjusted p-value = 1.59 × 10⁻¹¹; log2 FC Wolf-Panda = −0.393, Wolf-Carnivora = −0.216. CNCCs: BH-adjusted p-value = 0.002; log2 FC Wolf-Panda = −0.751, Wolf-Carnivora = −0.615). Both these TWARs are located in different introns of the gene EBF3 (Fig. 7F), which is highly-expressed during craniofacial development, particularly in the olfactory epithelium (Wang et al. 2004; Yankee et al. 2023). Mutations in this gene have also been associated with neurodevelopmental disorders involving facial pathologies and orofacial clefting (Harms et al. 2017; Cioffi et al. 2025).
Ultimately, the intersection of differentially active TWARs with similar regulatory potentials between the marsupials and placentals was small, indicating limited role for nucleotide-level genetic convergence in giving rise to the observed phenotypic similarities between the two taxa.
Discussion
We have used an MPRA to evaluate the activity of 295 conserved noncoding elements that display convergent sequence acceleration in the marsupial thylacine and the placental wolf. To our knowledge, this is the first high-throughput functional dissection of noncoding elements from lineages this distant (divergence time ≈160 MYA) (Bininda-Emonds et al. 2007). We observed substantial functional divergence and find that thylacine and wolf sequences frequently drove differential activity within their respective clades. However, only 10 TWARs were differentially active in both the marsupials and placentals, and four had the same direction of effect in the thylacine and wolf. Of these, we find one locus near the key craniofacial developmental genes LMO4 (TWAR27.chr3) as a possible candidate for further in vivo dissection.
We demonstrated how MPRAs can be employed to ask complex evolutionary questions. Including outgroup and ancestral taxa facilitated our comparisons by controlling for sequence decay observed over longer divergence times. It also provides more conclusive evidence of gene regulatory activity specific to the focal species. Despite this separation and although the TWARs were defined by excess of sequence changes in the thylacine and wolf relative to other taxa, the function of promoters and enhancers can be robust to sequence turnover (Ludwig et al. 2000; Fisher et al. 2006; Snetkova et al. 2021). Correspondingly, 6.8% (17 out of the 250 TWARs captured in all taxa) of our TWARs displayed functional conservation of gene regulatory potential for all six marsupial and placental mammals in one or both cell lines. Furthermore, we identified for some TWARs conservation in patterns of regulatory activity across taxa, even with turnover of specific transcription-factor binding motifs. This supports higher-level evolutionary constraint restricting the order of motifs in noncoding elements, as the position of these can affect the strength and specificity of regulatory activity (Jindal and Farley 2021; Reiter et al. 2023).
Largely however, patterns of conservation and divergence were significantly associated with sequence features, such as GC content and presence of transcription factor binding motifs, as in previous MPRAs (Arnold et al. 2014; Uebbing et al. 2021; Whalen and Pollard 2022). For individual differentially active TWARs, we were able to identify overall differences in the strength in transcription factor binding (as summarized by the relative FIMO score) as well as for some examples, specific nucleotide and motif changes that were underlying differences in regulatory function. A broader pattern was significant in the placentals, whereby increased and decreased activity in the wolf relative to the other taxa could be attributed to the gain and loss in the strength of binding respectively. This was not found among the marsupials however, partly because the greater sequence similarity between the marsupial sequences.
This sequence similarity in part also explains the lower differential activity we observed in the marsupials (36 DA TWARs across the two cell lines) than in the placentals (50 DA differentially active TWARs). In addition, our analyses suggest a limited impact of the murine trans-regulatory environment, with fewer TWARs active in marsupials than placentals, which could also obscure true signal. However, there are currently no validated craniofacial lineage cell lines from marsupials that would enable us to directly test this hypothesis. Our previous work has shown that the expression of craniofacial development genes is highly conserved during early development in the mouse and the marsupial fat-tailed dunnart (Cook et al. 2025), suggesting that the possibility of widespread rewiring of the developmental regulatory network is unlikely. Both the marsupial and placental taxa TWARs that are inactive in our results could also be active in other developmental stages, such as later ossification; alternatively, some sequences that we identify as active may be inactive in vivo due to being located in inaccessible chromatin.
Our study relied on a previously defined set of TWARs, which we found displayed lower sequence divergence among marsupials than among carnivores even when classified as accelerated. This reflects the challenges of studying an undersampled taxon, as the TWARs were derived from a 61-species whole genome alignment of vertebrates that contained 41 placentals and 4 marsupials (opossum, wallaby, Tasmanian devil and thylacine). Of these, only the Tasmanian devil is within the same order as the thylacine (Dasyuromorphia), whereas the alignment includes two representatives from Carnivora besides the wolf (Feigin et al. 2019). The undersampling of marsupials coupled with a placental-biased phylogeny could be overestimating sequence acceleration that is unique to the thylacine (Shukla and Gallego Romero 2026) and explains the limited number of differences we observe within marsupials.
In conjunction with this, the low sequence and functional divergence in craniofacial noncoding elements among marsupials could be reflective of their unique biology. Unlike placentals, marsupials give birth to highly altricial young that complete development ex utero in the maternal pouch. To enable the transition from newborn to suckling young, marsupials undergo accelerated development in both limbs and orofacial features (Smith 1997, 2006; Cook et al. 2021). This developmental requirement has been hypothesized to impose constraints on the evolution of early forming features in marsupials (Sears 2004; Bennett and Goswami 2013; Goswami et al. 2016; Spiekman and Werneburg 2017; Newton et al. 2021; Pevsner et al. 2022). Though still subject to debate, this theory suggests that the craniofacial development machinery would also be more constrained in marsupials. Functional craniofacial noncoding elements may only tolerate sequence changes with no or subtle effects on regulatory activity which we do not have the power to capture in this assay.
Overall, we found that convergent regulatory activity was not widespread in the thylacine and wolf accelerated regions. This result aligns with previous findings on the lack of homoplasic substitutions in protein-coding sequences between wolf and thylacine (Feigin et al. 2018). Our work instead suggests that morphological convergence between the thylacine and wolf arises through distinct genetic changes, and demonstrate that shared acceleration in sequence may not be reflective of shared regulatory function. These results need to be considered with the caveats of our experimental design (including our murine cell lines) as well as the technical challenges with the cranial neural crest cells in which we identified fewer active and differentially active TWARs. Furthermore, as MPRAs test sequences outside their native context and are limited by the length of sequences that can be synthesized and tested, the regulatory activity we identified may not be recapitulated in vivo. We also note that the novelty of our experimental design introduced unique challenges—for example, the variable lengths of orthologous sequences being compared—that are not perfectly resolved by existing analysis methods.
Nonetheless, taking into account the complexity of the gene regulatory architecture, our finding are not unprecedented. As noncoding elements are characterized by flexible organization and frequent redundancy (Spitz and Furlong 2012; Osterwalder et al. 2018), identical genetic changes are not necessary to produce similar regulatory outcomes. Our decision to focus on TWARs that showed convergent evidence of acceleration was motivated by the desire to test the hypothesis of locus-level convergence; the flexibility of the regulatory architecture in craniofacial development could facilitate the emergence of diverse paths to same trait. The intersecting thylacine and wolf accelerated elements were only a fraction of the complete set of thylacine accelerated regions (2.7%) and wolf accelerated regions (15.3%) defined by (Feigin et al. 2019). As suggested by our finding of parallel changes near EBF3, a broader look at nonconvergent, species-specific regulatory elements with these massively parallel approaches could perhaps be more fruitful in understanding the molecular origins of their convergent biology.
Methods
Library design
Sequence preparation
We extracted all 339 previously identified TWARs from a 61-way whole genome alignment based on the mouse GRCm38 coordinates from (Feigin et al. 2019) using maf_parse (Hubisz et al. 2011). We obtained corresponding sequences for the thylacine, gray wolf, panda and Tasmanian devil with GNU grep for the species name and excluded elements if they were shorter than 90 bp in any taxa, as elements greater than this shared >80% of their sequence length between taxa. Furthermore, having a large range of sequence lengths in our oligosynthesis pool could skew reaction kinetics and artificially favor shorter sequences (Neumayr et al. 2019). This left a total of 295 TWARs to be tested.
Ancestral reconstruction
We used tree files for Carnivora and Dasyuromorphia from vertlife (http://vertlife.org/phylosubsets) to generate independent tree models for each TWAR using the phyloFit utility from PHAST (Hubisz et al. 2011). We then applied PREQUEL (Hubisz et al. 2011) (prequel i FASTA n s anc) with the output FASTA parameter to generate the ancestral sequences for each TWAR for Carnivora and Dasyuromorphia. Species included in the ancestral reconstructions are listed in Supplemental Tables S12 and S13. For each reconstruction, we built a BLAST (Kent 2002) database using the reconstructed sequences to compare sequence identity relative to the focal species. Fewer marsupial species (4) than placental taxa (11) were available as input for these reconstructions; consequently higher sequence sharing is observed between the Dasyuromorphia and the marsupial taxa (pairwise sequence identity 96% with thylacine and 94% with Tasmanian devil) than between Carnivora and the placental taxa (94.2% with the wolf and 85.4% with the panda).
MPRA controls
We added mouse orthologs for each TWARs as controls for the murine cell lines used in our analysis, the MC3T3-E1 preosteoblasts (Wang et al. 1999) and O9-1 cranial neural crest cells (Ishii et al. 2012). To obtain a set of preosteoblast-specific positive controls, we first downloaded a data set of ChIP peaks for H3K27ac in mouse craniofacial (nose, maxillary and mandibular) tissue at E13.5 and E15.5 (Brinkley et al. 2016). This was intersected with ChIP-seq peaks for Runx2, a master regulator of osteoblast formation in MC3T3-E1 preosteoblasts cells to obtain 194 overlapping regions (100–260 bp) (Wu et al. 2014). We further intersected the craniofacial H3K27ac ChIP-seq peaks with a DNase I hypersensitive site (DHS) sequencing data set, also in MC3T3-E1 preosteoblasts cells, to get an additional 196 sequences (148–1844 bp) (Tai et al. 2017). Lastly, we added 6 enhancer sequences (98–215 bp) found to be highly active in human primary fetal osteoblasts in a previous MPRA (Weiss et al. 2021). For our cranial neural crest-specific positive controls, we extracted elements from the VISTA enhancer database known to be active in the branchial arch, cranial nerves and or the facial mesenchyme at E11.5 (Visel et al. 2007). These were intersected with ChIP-seq peaks for KDM6A, involved in maintaining neural crest viability (Shpargel et al. 2017), as well as peaks for EP300 in O91 mouse neural crest cells (Attanasio et al. 2013). A set of 74 regions (196–3785 bp in length) were found to be both strongly expressed in the craniofacial regions and intersecting with one or both of the ChIP-seq data sets. 170 bp scrambled sequences were generated as negative controls, and we used BLAT (Kent 2002) and MEME FIMO (Grant et al. 2011) to confirm these sequences were not found in the mouse genome or predicted to have a transcription factor binding motif.
Tiling
Given oligosynthesis constraints, we could only test 170 bp of sequence at a time. When TWAR sequences were longer, we tiled across elements using a 10 bp sliding window, for a total of 22,110 tiles. Tiles can be identical when a TWAR is highly homologous across taxa; considering this redundancy, the library consisted of 21,798 unique tiles, of which 301 were shared between two species and 11 across three. This was carefully accounted for in our analysis.
Library amplification and plasmid assembly
PCR amplification
The full sequence library of 21,798 unique sequences flanked by shared 15 bp adapter sequences at either end (5′ ACTGGCCGCTTGACG| CACTGCGGCTCCTGC 3′) was synthesized by Twist Bioscience. We followed a 2-step amplification protocol, as recommended in Gordon et al. (2020). An initial 8-cycle PCR was first performed on the single-stranded oligo pool with the F_adapter and R_adapter primers, with the NEBNext Ultra II Q5 Master Mix (M0544, NEB) and the double-stranded library was cleaned up with 1.8× AMPure XP beads (A63881, Beckman Coulter). We subsequently performed parallel 8-cycle PCR reactions with F_oligo_PCR and the degenerate R_oligo_PCR, to add a random 15 bp barcode to each oligo, as well as SfiI and BsiWI restriction sites and HiFi assembly sites for plasmid assembly. All primers used have been listed in Supplemental Table S14.
First cloning step
The purified barcoded library and the pMPRA1 plasmid (https://www.addgene.org/49349/, gifted by Tarjei Mikkelsen) (Melnikov et al. 2014) were both digested with the SfiI restriction enzyme (R0123S, NEB) for 2 hours at 50°C. The pMPRA1 backbone was gel-extracted (T1020, NEB) while the oligo library was purified with a QIAquick PCR Purification Kit (28104, Qiagen) to minimize loss of library sequences. We then ligated the plasmid backbone and library overnight at 16°C with T4 DNA ligase (M020S, NEB), using a molar insert:vector ratio of 1:3.
The cloned library was transformed into competent bacterial E. coli cells (JM109, Promega) with heat-shock (42°C for 2 minutes). The transformed bacteria were plated on Luria-Bertani (LB) agar plates containing 100 μg/mL of ampicillin (BP1760-5, Thermo Fisher Scientific) and cultured overnight. Bacterial dilutions (1:10, 1:100 and 1:1000) were also plated and used to estimate the library complexity. Bacterial colonies were collected from plates and the plasmids were extracted with the ZymoPure Plasmid Maxi-Prep Kit (D4202, Zymo Research). The oligo and tag region were amplified from the competent plasmid library in 12-cycle PCR reactions (NEBNext Ultra II Q5 Master Mix), purified (QIAquick PCR Purification Kit) and sent for NGS library preparation followed by amplicon sequencing (Illumina 2 × 150 bp) with Azenta Life Sciences. We performed this cloning step 3×, and sequenced each resulting library to a minimum depth of 100 million reads. The three cloned plasmid libraries were then combined for the following procedures.
Second cloning step
We digested the oligo-pMPRA1 cloned plasmid with the BsiWI-HF restriction enzyme (R3553S, NEB) overnight at 37°C, resulting in a linearized library with overhanging HiFi assembly sites. The reporter construct was synthesized as a gBlockTM (Integrated DNA Technologies). This construct consisted of a minimal promoter in front of the open reading frame for the enhanced green fluorescent protein, with HiFi assembly overhangs flanking the sequence. We used the NEB HiFi DNA Assembly Master Mix (E2621S, NEB) to assemble the final plasmid, with a 1:2 ratio of vector to insert.
The reporter gene cloned plasmid was electroporated into 10-beta electrocompetent E. coli cells (C3020K, NEB) with the recommended settings (2.0 kV, 200 Ω and 25 μF) and plated in LB agar plates containing 100 μg/mL of ampicillin. They were then cultured overnight, along with a dilution plate (1:10, 1:100 and 1:1000). We used our oligo-tag sequencing results and Poisson modeling to estimate the number of individual bacterial colonies required to capture the oligo library with a sufficient number of barcodes (approximately 20−25 × 106 colonies). Bacterial cells were lifted from the cultured plates with LB, and the plasmid library was extracted with ZymoPure Plasmid GigaPrep Kit (D4202, Zymo Research).
Cell culture, transfection and harvesting
Preosteoblasts
We cultured MC3T3-E1 Subclone 4 preosteoblasts (CRL-2593, ATCC) in MEM α (no ascorbic acid) (A1049001, Gibco) with 10% Fetal Bovine Serum (FBS) (FBSFR-S00JF, Scientifix). Prior to transfection, cells were seeded in 7 × 150 mm plates. Cells were disassociated with TrypLE (12605010, Thermo Fisher Scientific) for passaging and harvesting.
Cranial neural crest cells
O9-1 cranial neural crest cells (SCC049, Merck) were cultured in Complete Embryonic Cell Media (15% FBS and LIF) (ES-101, Sigma-Aldrich) supplemented with 100 μg/mL of recombinant human bFGF (100-18B, PeproTech). Prior to transfection, cells were seeded in 4 × 150 mm plates coated with 5 mg/mL of Matrigel base membrane matrix (354234, Corning). Cells were disassociated with 0.25% Trypsin EDTA (25200072, Thermo Fisher Scientific) for passaging and harvesting.
Transfection
At 60%–70% confluence, we transfected 17.5 μg of the competent plasmid library into each dish (total ≈70–90 million per replicate, per cell line) with the jetOptimus transfection reagent (101000006, Polyplus). A jetOptimus reagent to DNA ratio of 1.5 was used. The media was replaced 4 hours post-transfection.
Harvest
For each replicate, we disassociated cells 24 hours post-transfection, re-suspended them in dPBS (14190136, Thermo Fisher Scientific), and centrifuged them for 5 minutes (100×g MC3T3-E1; 300×g O9-1). The resulting pellets were re-suspended again in media and all the cell suspensions were combined. 10% of the total cell suspension was split equally into 2 microcentrifuge tubes, pelleted and stored at −80°C, for use in DNA extraction. The remainder of the cell suspension was centrifuged and stored at −80°C, for use in RNA extraction.
DNA and RNA extraction and library preparation
DNA extraction
We extracted DNA with the Qiagen DNeasy Blood and Tissue Kit (69504, Qiagen), following the spin-column protocol for purification from animal cells, including the optional treatment with RNase A (19101, Qiagen) to obtain RNA-free genomic DNA.
RNA extraction and cDNA synthesis
We extracted RNA with the Qiagen RNeasy Midi Kit (75144, Qiagen), following the protocol for the isolation of total RNA from animal cells, including the on-column DNase digestion. The eluted RNA was then treated again with Turbo DNase (AM1907, Thermo Fisher Scientific). We used an input of between 25–50 μg of RNA per replicate library for first-strand synthesis with Superscript IV (18090200, Thermo Fisher Scientific), with the reverse transcription primer (Reverse_transcription_primer_R). We additionally treated the first-strand synthesis product with 1 uL of RNase A (7000 units) (Qiagen, 19101) to remove excess leftover RNA.
Library amplification
We performed qPCR reactions in triplicate per RNA and DNA library with SYBR Green 1 (628014, Thermo Fisher Scientific) to determine the number of cycles required for efficient amplification of the barcode sequence (15–17 cycles for gDNA libraries and 22–24 for cDNA libraries). The barcode region was then amplified in each gDNA and cDNA library with NEBNext Q5 Ultra II Master Mix and GFP_F and Multipurpose_Buffer_R primers. The amplicons were purified with the Qiagen PCR Minelute Kit (Qiagen, 28004) and sent for amplicon sequencing (Illumina 2 × 150 bp, >200 M reads/library) with Azenta Life Sciences. All libraries were sequenced to a minimum depth of 200 million reads.
MPRA data analysis
Oligo-barcode association
We used cutadapt (version 4.2) to trim sequencing adapters and filter the plasmid sequencing reads, keeping read pairs with Q > 20 and length > 75 bp. The MPRAmatch pipeline developed by Ryan Tewhey (https://github.com/tewhey-lab/MPRA_oligo_barcode_pipeline/MPRAmatch.wdl) (Tewhey et al. 2016; Mouri et al. 2023) was used to associate barcodes with the oligos in our library. A custom Python script was used in place of pull_barcodes.pl to accommodate our library design.
Barcode counting
cutadapt (version 4.2) was used to trim Illumina adapters from the barcode sequencing reads from the cDNA and pDNA (plasmid DNA) libraries. Merged reads were then processed with the MPRAcount workflow from Ryan Tewhey (https://github.com/tewhey-lab/MPRA_oligo_barcode_pipeline/blob/master/MPRAcount.wdl (Tewhey et al. 2016; Mouri et al. 2023). The pipeline maps the reads to the created oligo-barcode dictionary in the previous step, generating a table of raw barcode counts for each cDNA and pDNA library. A custom Python script was used in place of make_counts.py, to accommodate our library design. The number and percentage of reads that were successfully filtered and mapped is in Supplemental Table S15. We retained a lower read depth for the cDNA libraries of two of our cranial neural crest replicates; upon closer observation, sequences filtered out mapped to the mouse genome (GRCm38), and suggested the presence of excess residual endogenous RNA in these sequenced libraries.
Normalization, filtering and QC
All analyses were in performed R (version 4.2.1) (R Core Team 2022) unless otherwise stated. We normalized the raw count data by library size to get counts per million (CPM), followed by a log2 transformation. We removed barcode observations with extremely low pDNA counts across replicates in each cell line, using the density distribution of the log2 normalized pDNA to determine the cutoff at which read counts stabilized (preosteoblasts: −5.50; CNCCs: −5.75) (Supplemental Fig. S18), as in Uebbing et al. (2021). We further filtered out oligos with fewer than 10 barcodes in each cell line. Number of barcodes per oligo (per fragment, for tiled oligos) for every TWAR highlighted here have been provided in Supplemental Tables S16 and S17. We mapped oligos passing all filters to the collapsed TWAR library with minimap2 (version 2.17) (Li 2018), and used SAMtools (version 1.16) (Li et al. 2009) to calculate the percentage coverage of our TWAR elements (Supplemental Tables S18 and S19). Of the 2635 captured in the MC3T3-E1 cells (with at least 1 tile associated with 10 or more barcodes in the original library sequencing step) 2569 TWARs had greater than 80% sequence coverage in the final data set, 2502 greater than 90% coverage and 2135 had 100% coverage. Of the 2629 captured TWARs in the O91-cells, 2563 had greater than 80% coverage in the final data set, 2499 greater than 90% coverage and 2130 100% coverage.
Activity calculation and testing
We calculated activity across all barcode observations as the ratio of normalized log2 cDNA CPM to normalized log2 pDNA CPM. We tested for statistically significant activity individually in each replicate. To do so, we applied a one-sided t-test per oligo (as in Uebbing et al. 2021), comparing the distribution of activity across barcodes to the overall mean activity observed in a replicate. Per replicate, we applied a Benjamini–Hochberg multiple testing correction. For each cell line, we defined active oligos as those that passed a false discovery rate (FDR) of 5% in at least one of three replicates and 10% in at least two (Supplemental Tables S20 and S21). To summarize activity values for a library sequence we took the median activity across barcodes and averaged activity across the three replicates.
Activity analysis
To compare activity distributions between TWARs, cell-line specific positive controls and negative controls, we first obtained the median log2 activity of the most active tile in each TWAR and control. We defined “active” TWARs and controls as having at least 1 active tile. In defining regions with marsupial- or placental-active TWARs, we required sequences to display good coverage (80% or higher) in at least 2 out of 3 species in the clade that was not active. GC content for each TWAR sequence was calculated with the seqinr package (version 4.2-36) in R. For each TWAR we determined the proportion of sites that differed between each pair of sequences (the pairwise sequence distance) with the ape package (version 5.8-1) in R (function dist.dna(), model = ‘‘raw’’). Distance to nearest TSS in the mouse had been previously determined with GREAT in Feigin et al. (2019) (Supplemental Table S22). We classified TWARs within 1 kb of the a TSS as promoters, and the rest as enhancers.
Differential activity testing
We used mpralm (Myint et al. 2019), which is based on the voom framework (Law et al. 2014) to test TWARs for regulatory activity. Aggregating DNA and RNA barcode counts across tiles for each TWAR, we then used the mpralm() command to model this count data and compute log2 activity ratios per TWAR. For the cranial neural crest cells replicates, because of the associated technical challenges, there were individual barcode sequences that displayed exceptionally high counts. Thus prior to aggregation of our raw counts, we performed an additional filtering step for these replicates, removing any outlier barcodes for an oligo if (1) it is the only barcode that has >10,000 counts for that oligo and if (2) the oligo is not determined to be active by our initial activity t-test.
We extracted contrasts for each pair of marsupial and placental taxa. Taking only the subset of TWARs that were active in at least one of the three taxa and present in two of the three taxa—in the preosteoblasts, 110 and 134 TWARs for marsupials and placentals respectively; in the CNCCs, 50 and 103 TWARs for marsupials and placentals respectively—we re-computed the adjusted p-values using Benjamini–Hochberg correction. Differentially active TWARs were required to have an adjusted p-value < 0.05 and a pairwise log2 fold-change > 0.1 in either the focal-outgroup or the focal-ancestor comparison. We also required that differentially TWARs have >80% coverage in the focal species (thylacine or wolf) and >90% coverage in at least one of the other two taxa.
We also performed a second approach to differential activity testing, applying mpralm to the most active tile from each TWAR and applying the same filtering criteria as above. Supplemental Tables S23–S26 contain results of differential activity testing from this approach, and Supplemental Table S27 summarizes the intersection of results between the two methods. As both approaches have merits—aggregating tiles will capture activity across the entire sequence context, however the activity of regulatory elements is known to be driven by a few clusters of short transcription factor binding motifs—we decided to report overall numbers from mpralm on aggregated counts across tiles but only describe examples found to be differentially active with both approaches.
Nearest gene analysis
Feigin et al. (2018) had previously identified genes nearest to each TWAR in the mouse genome (GRCm38) with GREAT (McLean et al. 2010). Here we designated TWARs within 1000 bp of a TSS promoters and the remainder as enhancers. Per cell line, we applied a t-test comparing the absolute distance to a TSS for inactive and active TWARs (MC3T3: p-value = 0.451; O91: p-value = 0.020) A caveat of this test however was that we only had information for the mouse genome; as such each orthologous TWAR was assigned the same absolute distance to a TSS. We thus also applied a linear modeling approach, with absolute distance to a TSS as our explanatory variable and proportion of active orthologs for a TWAR as our response variable (MC3T3: p-value = 0.629; O91: p-value = 0.128).
Transcription Factor Motif Scan and Analysis
We used FIMO (Grant et al. 2011) to scan our oligo library for nonredundant vertebrate transcription factor binding motifs from the HOCOMOCO Core Mouse Collection (v11) (Kulakovskiy et al. 2018) (Supplemental File S4). A q-value threshold of 0.10 was applied. When a single oligo was associated with multiple binding motifs for the same TF, we retained the motif with highest binding score. We then counted the number of unique transcription factor motifs discovered in each oligo, as well as the mean binding score across these motifs. Multiplying the TFBM counts and the mean binding score, we obtained a summary FIMO score. To compare FIMO scores for a TWAR across taxa (all six or within a clade), we divided its summary score by the maximum possible score for an ortholog of that TWAR.
Marsupial craniofacial ChIP-seq
We used BLAST (Camacho et al. 2009) to identify orthologous regions in the dunnart genome (Cook et al. 2025) using the Tasmanian devil sequence for each TWAR. Uniquely mapped regions from Tasmanian devil to dunnart were then blasted back to the dunnart genome to ensure reciprocal mapping. The dunnart coordinates for each mapped TWAR were extracted and intersected with existing dunnart craniofacial ChIP-seq peaks (Cook et al. 2025) using BEDTools intersect (Quinlan and Hall 2010).
Data access
Raw sequencing reads generated in this study have been submitted to the European Nucleotide Archive (ENA; https://www.ebi.ac.uk/ena) under accession number PRJEB90363. All analysis scripts are available at GitLab (https://gitlab.unimelb.edu.au/igr-lab/tycnmpra) and as Supplemental Code.
Competing interest statement
A.J.P. is funded in part by Colossal Biosciences, a company engaged in de-extinction and genetic restoration projects, including work on the thylacine. However, Colossal Biosciences had no direct influence on this project design, data collection, analysis, interpretation, or conclusions presented in this paper.
Acknowledgements
The work was partly funded by Australian Research Council Discovery Project DP210100505 to A.J.P. A.J.P. is also funded in part by Colossal Biosciences. St Vincent’s Institute acknowledges the infrastructure support it receives from the National Health and Medical Research Council Independent Research Institutes Infrastructure Support Program and from the Victorian Government through its Operational Infrastructure Support Program. N.S. received the Faculty of Science Postgraduate Writing-up Award from the University of Melbourne. The funders had no role in study design, data collection and analysis, decision to publish, or preparation of the manuscript. The authors thank Chengyu Deng and Severin Uebbing for advice on experimental protocols. We also thank members of the Gallego Romero laboratory for valuable comments on the manuscript.
Author contributions: L.E.C., I.G.R., and A.J.P. conceived the study. A.J.P. and I.G.R. acquired funding and resources. L.E.C., N.S., and D.M.V. contributed to the methodology. N.S. performed the formal investigation, analysis, and visualization. L.E.C. performed analysis of the dunnart ChIP-seq data. N.S., I.G.R., and L.E.C. prepared the original draft of the manuscript and D.M.V. and A.J.P. provided feedback.
Footnotes
[1] Supplementary material [Supplemental material is available for this article.]
[2] Article published online before print. Article, supplemental material, and publication date are at https://www.genome.org/cgi/doi/10.1101/gr.281284.125.
[3] Freely available online through the Genome Research Open Access option.
References
- ↵Antón Z, Betin VM, Simonetti B, Traer CJ, Attar N, Cullen PJ, Lane JD. 2020. A heterodimeric SNX4–SNX7 SNX-BAR autophagy complex coordinates ATG9A trafficking for efficient autophagosome assembly. J Cell Sci 133: jcs246306. 10.1242/jcs.246306
- ↵Arnold CD, Gerlach D, Spies D, Matts JA, Sytnikova YA, Pagani M, Lau NC, Stark A. 2014. Quantitative genome-wide enhancer activity maps for five drosophila species show functional enhancer conservation and turnover during cis-regulatory evolution. Nat Genet 46: 685–692. 10.1038/ng.3009
- ↵Attanasio C, Nord AS, Zhu Y, Blow MJ, Li Z, Liberton DK, Morrison H, Plajzer-Frick I, Holt A, Hosseini R, 2013. Fine tuning of craniofacial morphology by distant-acting enhancers. Science 342: 1241006. 10.1126/science.1241006
- ↵Bennett CV, Goswami A. 2013. Statistical support for the hypothesis of developmental constraint in marsupial skull evolution. BMC Biol 11: 52. 10.1186/1741-7007-11-52
- ↵Bininda-Emonds ORP, Cardillo M, Jones KE, MacPhee RDE, Beck RMD, Grenyer R, Price SA, Vos RA, Gittleman JL, Purvis A. 2007. The delayed rise of present-day mammals. Nature 446: 507–512. 10.1038/nature05634
- ↵Brinkley JF, Fisher S, Harris MP, Holmes G, Hooper JE, Wang Jabs E, Jones KL, Kesselman C, Klein OD, Maas RL, 2016. The FaceBase Consortium: a comprehensive resource for craniofacial researchers. Development 143: 2677–2688. 10.1242/dev.135434
- ↵Camacho C, Coulouris G, Avagyan V, Ma N, Papadopoulos J, Bealer K, Madden TL. 2009. BLAST+: architecture and applications. BMC Bioinform 10: 421. 10.1186/1471-2105-10-421
- ↵Chen F, Jiao XF, Zhang JY, Wu D, Ding ZM, Wang YS, Miao YL, Huo LJ. 2018. Nucleoporin35 is a novel microtubule associated protein functioning in oocyte meiotic spindle architecture. Exp Cell Res 371: 435–443. 10.1016/j.yexcr.2018.09.004
- ↵Choi CH. 2011. Prestin and motility of the cochlear outer hair cell. J Audiol Otol 15: 101–106.
- ↵Cioffi K, Wang J, Williams L, Cyprych L, Venner P, Sklirou E. 2025. P410: expanding the phenotype of ebf3-related disorders: a case of pierre robin sequence with cleft palate. Genet Med Open 3: 103277. 10.1016/j.gimo.2025.103277
- ↵Colbran LL, Chen L, Capra JA. 2017. Short DNA sequence patterns accurately identify broadly active human enhancers. BMC Genom 18: 536. 10.1186/s12864-017-3934-9
- ↵Cook LE, Newton AH, Hipsley CA, Pask AJ. 2021. Postnatal development in a marsupial model, the fat-tailed dunnart (sminthopsis crassicaudata; dasyuromorphia: dasyuridae). Commun Biol 4: 1028. 10.1038/s42003-021-02506-2
- ↵Cook LE, Feigin CY, Hills J, Vespasiani DM, Pask AJ, Romero IG. 2025. Gene regulatory dynamics during craniofacial development in a carnivorous marsupial. eLife 14: RP103592. 10.7554/eLife.103592
- ↵Duchêne DA, Bragg JG, Duchêne S, Neaves LE, Potter S, Moritz C, Johnson RN, Ho SY, Eldridge MD. 2018. Analysis of phylogenomic tree space resolves relationships among marsupial families. Syst Biol 67: 400–412. 10.1093/sysbio/syx076
- ↵The ENCODE Project Consortium. 2012. An integrated encyclopedia of DNA elements in the human genome. Nature 489: 57. 10.1038/nature11247
- ↵Fan X, Masamsetti VP, Sun JQ, Engholm-Keller K, Osteil P, Studdert J, Graham ME, Fossat N, Tam PP. 2021. TWIST1 and chromatin regulatory proteins interact to guide neural crest cell differentiation. eLife 10: e62873. 10.7554/eLife.62873
- ↵Feigin CY, Newton AH, Doronina L, Schmitz J, Hipsley CA, Mitchell KJ, Gower G, Llamas B, Soubrier J, Heider TN, 2018. Genome of the tasmanian tiger provides insights into the evolution and demography of an extinct marsupial carnivore. Nat Ecol Evol 2: 182–192. 10.1038/s41559-017-0417-y
- ↵Feigin CY, Newton AH, Pask AJ. 2019. Widespread cis-regulatory convergence between the extinct tasmanian tiger and gray wolf. Genome Res 29: 1648–1658. 10.1101/gr.244251.118
- ↵Fenouil R, Cauchy P, Koch F, Descostes N, Cabeza JZ, Innocenti C, Ferrier P, Spicuglia S, Gut M, Gut I, 2012. CPG islands and GC content dictate nucleosome depletion in a transcription-independent manner at mammalian promoters. Genome Res 22: 2399–2408. 10.1101/gr.138776.112
- ↵Fisher S, Grice EA, Vinton RM, Bessling SL, McCallion AS. 2006. Conservation of ret regulatory function from human to zebrafish without sequence similarity. Science 312: 276–279. 10.1126/science.1124070
- ↵Gallego Romero I, Lea AJ. 2023. Leveraging massively parallel reporter assays for evolutionary questions. Genome Biol 24: 26. 10.1186/s13059-023-02856-6
- ↵Gordon MG, Fumitaka I, Beth M, Max S, Vikram A, Sean W, Shiyun F, Jingjing Z, Tal A, Ryan Z, 2020. lentiMPRA and MPRAflow for high-throughput functional characterization of gene regulatory elements. Nat Protoc 15: 2387–2412. 10.1038/s41596-020-0333-5
- ↵Goswami A, Milne N, Wroe S. 2011. Biting through constraints: cranial morphology, disparity and convergence across living and fossil carnivorous mammals. Proc Biol Sci 278: 1831–1839. 10.1098/rspb.2010.2031
- ↵Goswami A, Randau M, Polly PD, Weisbecker V, Bennett CV, Hautier L, Sánchez-Villagra MR. 2016. Do developmental constraints and high integration limit the evolution of the marsupial oral apparatus? Integr Comp Biol 56: 404–415. 10.1093/icb/icw039
- ↵Grant CE, Bailey TL, Noble WS. 2011. Fimo: scanning for occurrences of a given motif. Bioinformatics 27: 1017–1018. 10.1093/bioinformatics/btr064
- ↵Harms FL, Girisha KM, Hardigan AA, Kortüm F, Shukla A, Alawi M, Dalal A, Brady L, Tarnopolsky M, Bird LM, 2017. Mutations in EBF3 disturb transcriptional profiles and cause intellectual disability, ataxia, and facial dysmorphism. Am J Human Genet 100: 117–127. 10.1016/j.ajhg.2016.11.012
- ↵Harris GP. 1808. XI. Description of two new species of didelphis from van Diemen’s land. Trans Linn Soc Lond 9: 174–178. 10.1111/j.1096-3642.1818.tb00336.x
- ↵Hassanin A, Veron G, Ropiquet A, Jansen van Vuuren B, Lécu A, Goodman SM, Haider J, Nguyen TT. 2021. Evolutionary history of carnivora (mammalia, laurasiatheria) inferred from mitochondrial genomes. PLoS One 16: e0240770. 10.1371/journal.pone.0240770
- ↵Hu G, Shi X, Qu X, Han C, Hu A, Jia Z, Yang J, Liu H, Wu Y. 2023. Atf7ip inhibits osteoblast differentiation via negative regulation of the Sp7 transcription factor. Int J Mol Sci 24: 4305. 10.3390/ijms24054305
- ↵Hubisz MJ, Pollard KS, Siepel A. 2011. Phast and rphast: phylogenetic analysis with space/time models. Brief Bioinform 12: 41–51. 10.1093/bib/bbq072
- ↵Inoue F, Ahituv N. 2015. Decoding enhancers using massively parallel reporter assays. Genomics 106: 159–164. 10.1016/j.ygeno.2015.06.005
- ↵Ishii M, Arias AC, Liu L, Chen YB, Bronner ME, Maxson RE. 2012. A stable cranial neural crest cell line from mouse. Stem Cells Dev 21: 3069–3080. 10.1089/scd.2012.0155
- ↵Jindal GA, Farley EK. 2021. Enhancer grammar in development, evolution, and disease: dependencies and interplay. Dev Cell 56: 575–587. 10.1016/j.devcel.2021.02.016
- ↵Jones ME, Stoddart DM. 1998. Reconstruction of the predatory behaviour of the extinct marsupial thylacine (thylacinus cynocephalus). J Zool 246: 239–246. 10.1111/jzo.1998.246.issue-2
- ↵Kasah S, Oddy C, Basson MA. 2018. Autism-linked CHD gene expression patterns during development predict multi-organ disease phenotypes. J Anat 233: 755–769. 10.1111/joa.2018.233.issue-6
- ↵Kenny DA, Jurata LW, Saga Y, Gill GN. 1998. Identification and characterization of lmo 4, an lmo gene with a novel pattern of expression during embryogenesis. Proc Natl Acad Sci 95: 11257–11262. 10.1073/pnas.95.19.11257
- ↵Kent WJ. 2002. Blat—the blast-like alignment tool. Genome Res 12: 656–664.
- ↵Khan A, Zhang X. 2016. dbsuper: a database of super-enhancers in mouse and human genome. Nucleic Acids Res 44: D164–D171. 10.1093/nar/gkv1002
- ↵Kulakovskiy IV, Vorontsov IE, Yevshin IS, Sharipov RN, Fedorova AD, Rumynskiy EI, Medvedeva YA, Magana-Mora A, Bajic VB, Papatsenko DA, 2018. Hocomoco: towards a complete collection of transcription factor binding models for human and mouse via large-scale chip-seq analysis. Nucleic Acids Res 46: D252–D259. 10.1093/nar/gkx1106
- ↵Law CW, Chen Y, Shi W, Smyth GK. 2014. voom: precision weights unlock linear model analysis tools for rna-seq read counts. Genome Biol 15: R29. 10.1186/gb-2014-15-2-r29
- ↵Li H. 2018. Minimap2: pairwise alignment for nucleotide sequences. Bioinformatics 34: 3094–3100. 10.1093/bioinformatics/bty191
- ↵Li G, Wang J, Rossiter SJ, Jones G, Cotton JA, Zhang S. 2008. The hearing gene prestin reunites echolocating bats. Proc Natl Acad Sci 105: 13959–13964. 10.1073/pnas.0802097105
- ↵Li H, Handsaker B, Wysoker A, Fennell T, Ruan J, Homer N, Marth G, Abecasis G, Durbin R, 1000 Genome Project Data Processing Subgroup. 2009. The Sequence Alignment/Map format and SAMtools. Bioinformatics 25: 2078–2079. 10.1093/bioinformatics/btp352
- ↵Liu Y, Rossiter SJ, Han X, Cotton JA, Zhang S. 2010. Cetaceans on a molecular fast track to ultrasonic hearing. Curr Biol 20: 1834–1839. 10.1016/j.cub.2010.09.008
- ↵Ludwig MZ, Bergman C, Patel NH, Kreitman M. 2000. Evidence for stabilizing selection in a eukaryotic enhancer element. Nature 403: 564–567. 10.1038/35000615
- ↵McLean CY, Bristor D, Hiller M, Clarke SL, Schaar BT, Lowe CB, Wenger AM, Bejerano G. 2010. Great improves functional interpretation of cis-regulatory regions. Nat Biotechnol 28: 495–501. 10.1038/nbt.1630
- ↵Melnikov A, Zhang X, Rogov P, Wang L, Mikkelsen TS. 2014. Massively parallel reporter assays in cultured mammalian cells. J Vis Exp (90): 51719. 10.3791/51719
- ↵Mishina Y, Snider TN. 2014. Neural crest cell signaling pathways critical to cranial bone development and pathology. Exp Cell Res 325: 138–147. 10.1016/j.yexcr.2014.01.019
- ↵Mouri K, Dewey HB, Castro R, Berenzy D, Kales S, Tewhey R. 2023. Whole-genome functional characterization of RE1 silencers using a modified massively parallel reporter assay. Cell Genom 3: 100234. 10.1016/j.xgen.2022.100234
- ↵Myint L, Avramopoulos DG, Goff LA, Hansen KD. 2019. Linear models enable powerful differential activity analysis in massively parallel reporter assays. BMC Genom 20: 209. 10.1186/s12864-019-5556-x
- ↵Neumayr C, Pagani M, Stark A, Arnold CD. 2019. STARR-seq and UMI-STARR-seq: assessing enhancer activities for genome-wide-, high-, and low-complexity candidate libraries. Curr Prot Mol Biol 128: e105. 10.1002/cpmb.v128.1
- ↵Newton AH, Weisbecker V, Pask AJ, Hipsley CA. 2021. Ontogenetic origins of cranial convergence between the extinct marsupial thylacine and placental gray wolf. Commun Biol 4: 51. 10.1038/s42003-020-01569-x
- ↵Ochoa SD, Salvador S, LaBonne C. 2012. The lim adaptor protein LMO4 is an essential regulator of neural crest development. Dev Biol 361: 313–325. 10.1016/j.ydbio.2011.10.034
- ↵Orkney A, Boerma DB, Hedrick BP. 2025. Evolutionary integration of forelimb and hindlimb proportions within the bat wing membrane inhibits ecological adaptation. Nat Ecol Evol 9: 111–123. 10.1038/s41559-024-02572-9
- ↵Osterwalder M, Barozzi I, Tissières V, Fukuda-Yuzawa Y, Mannion BJ, Afzal SY, Lee EA, Zhu Y, Plajzer-Frick I, Pickle CS, 2018. Enhancer redundancy provides phenotypic robustness in mammalian development. Nature 554: 239–243. 10.1038/nature25461
- ↵Parker J, Tsagkogeorga G, Cotton JA, Liu Y, Provero P, Stupka E, Rossiter SJ. 2013. Genome-wide signatures of convergent evolution in echolocating mammals. Nature 502: 228–231. 10.1038/nature12511
- ↵Pevsner SK, Grossnickle DM, Luo ZX. 2022. The functional diversity of marsupial limbs is influenced by both ecology and developmental constraint. Biol J Linn Soc 135: 569–585. 10.1093/biolinnean/blab168
- ↵Quinlan AR, Hall IM. 2010. Bedtools: a flexible suite of utilities for comparing genomic features. Bioinformatics 26: 841–842. 10.1093/bioinformatics/btq033
- ↵R Core Team. 2022. R: a language and environment for statistical computing (version 4.2.1). R Foundation for Statistical Computing, Vienna. https://www.R-project.org/.
- ↵Reiter F, de Almeida BP, Stark A. 2023. Enhancers display constrained sequence flexibility and context-specific modulation of motif function. Genome Res 33: 346–358. 10.1101/gr.277246.122
- ↵Rovinsky DS, Evans AR, Adams JW. 2021. Functional ecological convergence between the thylacine and small prey-focused canids. BMC Ecol Evol 21: 58. 10.1186/s12862-021-01788-8
- ↵Sears KE. 2004. Constraints on the morphological evolution of marsupial houlder girdles. Evolution 58: 2353–2370. 10.1111/j.0014-3820.2004.tb01609.x
- ↵Shpargel KB, Starmer J, Wang C, Ge K, Magnuson T. 2017. UTX-guided neural crest function underlies craniofacial features of kabuki syndrome. Proc Natl Acad Sci 114: E9046–E9055. 10.1073/pnas.1705011114
- ↵Shukla N, Gallego Romero I. 2026. Lift&add—rapid and robust addition of new species to alignments of conserved non-coding sequences. Bioinformatics 42: btag315. 10.1093/bioinformatics/btag315
- ↵Smith KK. 1997. Comparative patterns of craniofacial development in eutherian and metatherian mammals. Evolution 51: 1663–1678. 10.1111/evo.1997.51.issue-5
- ↵Smith KK. 2006. Craniofacial development in marsupial mammals: developmental origins of evolutionary change. Dev Dyn 235: 1181–1193. 10.1002/dvdy.v235:5
- ↵Snetkova V, Ypsilanti AR, Akiyama JA, Mannion BJ, Plajzer-Frick I, Novak CS, Harrington AN, Pham QT, Kato M, Zhu Y, 2021. Ultraconserved enhancer function does not require perfect sequence conservation. Nat Genet 53: 521–528. 10.1038/s41588-021-00812-3
- ↵Spiekman SN, Werneburg I. 2017. Patterns in the bony skull development of marsupials: high variation in onset of ossification and conserved regions of bone contact. Sci Rep 7: 43197. 10.1038/srep43197
- ↵Spitz F, Furlong EE. 2012. Transcription factors: from enhancer binding to developmental control. Nat Rev Genet 13: 613–626. 10.1038/nrg3207
- ↵Tai PWL, Wu H, van Wijnen AJ, Stein GS, Stein JL, Lian JB. 2017. Genome-wide DNase hypersensitivity, and occupancy of RUNX2 and CTCF reveal a highly dynamic gene regulome during MC3t3 pre-osteoblast differentiation. PLoS One 12: e0188056. 10.1371/journal.pone.0188056
- ↵Tewhey R, Kotliar D, Park DS, Liu B, Winnicki S, Reilly SK, Andersen KG, Mikkelsen TS, Lander ES, Schaffner SF, 2016. Direct identification of hundreds of expression-modulating variants using a multiplexed reporter assay. Cell 165: 1519–1529. 10.1016/j.cell.2016.04.027
- ↵Tsusaka T, Fukuda K, Shimura C, Kato M, Shinkai Y. 2020. The fibronectin type-III (FNIII) domain of ATF7IP contributes to efficient transcriptional silencing mediated by the SETDB1 complex. Epigenetics Chromatin 13: 52. 10.1186/s13072-020-00374-4
- ↵Uebbing S, Gockley J, Reilly SK, Kocher AA, Geller E, Gandotra N, Scharfe C, Cotney J, Noonan JP. 2021. Massively parallel discovery of human-specific substitutions that alter enhancer activity. Proc Natl Acad Sci 118: e2007049118. 10.1073/pnas.2007049118
- ↵Visel A, Minovitsky S, Dubchak I, Pennacchio LA. 2007. VISTA enhancer browser–a database of tissue-specific human enhancers. Nucleic Acids Res 35: D88–D92. 10.1093/nar/gkl822
- ↵Wang D, Christensen K, Chawla K, Xiao G, Krebsbach PH, Franceschi RT. 1999. Isolation and characterization of MC3T3-E1 preosteoblast subclones with distinct in vitro and in vivo differentiation/mineralization potential. J Bone Miner Res 14: 893–903. 10.1359/jbmr.1999.14.6.893
- ↵Wang SS, Lewcock JW, Feinstein P, Mombaerts P, Reed RR. 2004. Genetic disruptions of O/E2 and O/E3 genes reveal involvement in olfactory receptor neuron projection. Development 131: 1377–1388. 10.1242/dev.01009
- ↵Weiss CV, Harshman L, Inoue F, Fraser HB, Petrov DA, Ahituv N, Gokhman D. 2021. The cis-regulatory effects of modern human-specific variants. eLife 10: e63713. 10.7554/eLife.63713
- ↵Whalen S, Pollard KS. 2022. Enhancer function and evolutionary roles of human accelerated regions. Annu Rev Genet 56: 423–439. 10.1146/genet.2022.56.issue-1
- ↵Wroe S, Milne N. 2007. Convergence and remarkably consistent constraint in the evolution of carnivore skull shape. Evolution 61: 1251–1260. 10.1111/j.1558-5646.2007.00101.x
- ↵Wroe S, Clausen P, McHenry C, Moreno K, Cunningham E. 2007. Computer simulation of feeding behaviour in the thylacine and dingo as a novel test for convergence and niche overlap. Proc R Soc B Biol Sci 274: 2819–2828. 10.1098/rspb.2007.0906
- ↵Wu H, Whitfield TW, Gordon JA, Dobson JR, Tai PW, van Wijnen AJ, Stein JL, Stein GS, Lian JB. 2014. Genomic occupancy of Runx2 with global expression profiling identifies a novel dimension to control of osteoblastogenesis. Genome Biol 15: R52. 10.1186/gb-2014-15-3-r52
- ↵Wu J, Li J, Chen K, Liu G, Zhou Y, Chen W, Zhu X, Ni TT, Zhang B, Jin D, 2023. Atf7ip and Setdb1 interaction orchestrates the hematopoietic stem and progenitor cell state with diverse lineage differentiation. Proc Natl Acad Sci 120: e2209062120. 10.1073/pnas.2209062120
- ↵Yankee TN, Oh S, Winchester EW, Wilderman A, Robinson K, Gordon T, Rosenfeld JA, VanOudenhove J, Scott DA, Leslie EJ, 2023. Integrative analysis of transcriptome dynamics during human craniofacial development identifies candidate disease genes. Nat Commun 14: 4623. 10.1038/s41467-023-40363-1