
Abstract
Endurance exercise induces multisystem adaptations that improve performance and benefit health. Gene regulatory circuit responses within individual skeletal muscle cell types, which are key mediators of exercise effects, have not been studied. Here, we map transcriptome, chromatin, and regulatory circuit responses to acute endurance exercise in muscle using same-cell RNA-seq/ATAC-seq multiome assays. High-quality data were obtained from 37,154 nuclei comprising 14 cell types in vastus lateralis samples collected before and 3.5 h after either 40 min cycling exercise at 70% VO2max or 40 min supine rest. Both shared and cell-type-specific regulatory programs were identified. Differential gene expression and accessibility sites are largely distinct within nuclei for each cell type and muscle fiber, with the largest numbers of regulatory events observed in the three muscle fiber types (slow, fast, and intermediate) and lumican (LUM)-expressing fibro-adipogenic progenitor cells. Single-cell regulatory circuit triad reconstruction (transcription factor, chromatin interaction site, regulated gene) also identifies largely distinct gene regulatory circuits modulated by exercise in the three muscle fiber types and LUM-expressing fibro-adipogenic progenitor cells, involving a total of 328 transcription factors acting at chromatin sites regulating 2025 genes. This web-accessible single-cell data set and regulatory circuitry map serve as a resource for understanding the molecular underpinnings of the metabolic and physiological effects of exercise and for guiding interpretation of the exercise response literature in bulk tissue.
Physical activity enhances performance and provides diverse health benefits, including improvements in metabolism, immunity, cancer suppression, cardiac health, and brain function (Hawley et al. 2014; Chow et al. 2022). Skeletal muscle, a primary mediator of these effects, is directly perturbed by physical activity. Acute endurance exercise induces numerous physiological changes in skeletal muscle that initiate a complex regulatory program modulated at epigenetic and transcriptional levels (Egan and Sharples 2023; Smith et al. 2023). The molecular responses stimulated during each endurance exercise bout lead, over time, to functional and structural adaptations (i.e., improvements in aerobic fitness, exercise performance, and increase in lipid oxidation) as well as improved overall health (Williams and Neufer 1996; Egan and Zierath 2013; MoTrPAC Study Group et al. 2024). Because of the importance of the cross talk between skeletal muscle and diverse organs in modifying health and influencing performance, the molecular responses to exercise have been extensively studied (Amar et al. 2021; Egan and Sharples 2023).
An ongoing National Institutes of Health Molecular Transducers of Physical Activity Consortium (MoTrPAC) program is developing a comprehensive multiomic whole-tissue-level molecular map of the responses to exercise in rat models and humans (Sanford et al. 2020). These tissue-level multiomic data sets support integrated analysis at the transcriptome and epigenome levels to provide mechanistic insight (MoTrPAC Study Group et al. 2024; Nair et al. 2024). A limitation of this type of resource is that bulk tissue transcriptome and chromatin accessibility assays provide only an assessment of the average response across the diverse cell types in a complex tissue, thus obfuscating the molecular processes regulated within each individual cell type. Skeletal muscle, a key mediator of exercise responses, is a heterogeneous tissue composed of multiple multinucleated fibers and mononuclear cell types, including myogenic, immune, mesenchymal, and endothelial cells. Human skeletal muscle fibers include slow-twitch (slow) fibers, fast-twitch (fast) fibers, and intermediate fibers (i.e., fibers with both slow and fast characteristics). Each fiber type has differing contraction capabilities, mechanical properties, aerobic capacity, and metabolic responses to exercise, including glucose metabolism, lipid metabolism, and lactate production (Hultman et al. 1991; Romijn et al. 1993, 2000; Greenhaff et al. 1994; Bottinelli et al. 1999; Trappe et al. 2003, 2006; Kosek et al. 2006; Luden et al. 2008; Raue et al. 2009; Dickinson et al. 2010; Jensen et al. 2020; Hokken et al. 2021; Egan and Sharples 2023). Insight into the coordinated transcriptomic and epigenomic molecular responses to exercise within each of the diverse muscle cell types is lacking; single-cell (sc) assays enable the characterization of the exercise response within individual cell types rather than averaged over the entire tissue.
The next frontier in exercise research is to map multiomic responses to exercise within individual cells. New sc technology that allows the simultaneous profiling of the transcriptome and epigenome landscapes within thousands of individual cells or nuclei and bioinformatic platforms that leverage the power of these data to elucidate regulatory processes have only recently been developed (Reyes et al. 2019; Eisenstein 2020; Chen et al. 2023; Lee et al. 2023; Zhang et al. 2024). Gene expression dynamics, which mediate the biosynthetic tissue adaptations to exercise, are controlled through the interaction of proximal and distal regulatory domains on DNA that interact in 3D space (Schoenfelder and Fraser 2019). Gene regulatory circuits, comprising chromatin regulatory domains, transcription factors (TFs), and their target genes, represent the fundamental logic system directing gene expression in a cell. It is crucial that the process of identifying regulatory circuits occurs within each cell type, because attempting to identify circuits at bulk tissue can generate spurious mechanistic linkages in the case of different circuit components changing within different cell types (e.g., increases in gene expression in one cell type, whereas chromatin accessibility increases in a different cell type). The use of integrated same-cell multiome assays and new bioinformatic techniques allows the more accurate inference of the entire gene regulatory circuit within each individual cell nucleus; sc multiome data allow these gene regulatory circuit mechanisms that transduce exercise into gene expression changes within each muscle cell type to be identified (Kim et al. 2009).
Although the sc multiome assay can only be applied to a relatively small number of samples owing to expense and throughput considerations (Orchard et al. 2021; Wang et al. 2022b; Zhang et al. 2022; Chapman et al. 2023; Travisano et al. 2023; Zhu et al. 2023), the ability to model the regulatory circuits within each of thousands of cells nonetheless provides high statistical power to elucidate coordinated regulatory processes (Chen et al. 2023; Travisano et al. 2023; Zhang et al. 2024). A high-resolution study in a limited number of subjects using these assay and bioinformatic methods can thus provide insight into the transcriptome/epigenome landscape and regulatory circuit modulations induced within each cell type, including both fiber nuclei and mononuclear cell nuclei. Such results also help the interpretation of the extensive previous and ongoing human exercise research into the average molecular responses to exercise in bulk muscle tissue across diverse cohorts (Sanford et al. 2020).
To provide better insight into exercise responses within muscle cell types, we generated same-cell multiome data before and after an acute bout of endurance exercise in four untrained physically active participants and, at the same sampling times, in two untrained physically active resting control participants. We leverage the power of simultaneous gene expression and chromatin accessibility measured within each nucleus using recently developed bioinformatic platforms (Chen et al. 2023; Zhang et al. 2024) to generate a high-resolution sc integrated skeletal muscle atlas of epigenomic and transcriptomic exercise responses and their underlying molecular circuitry that enables new insight into the responses of muscle to exercise and the programmatic regulatory mechanisms involved.
Results
Same-cell single-nuclei multiome sequencing provides a cell-type resolution map of exercise response
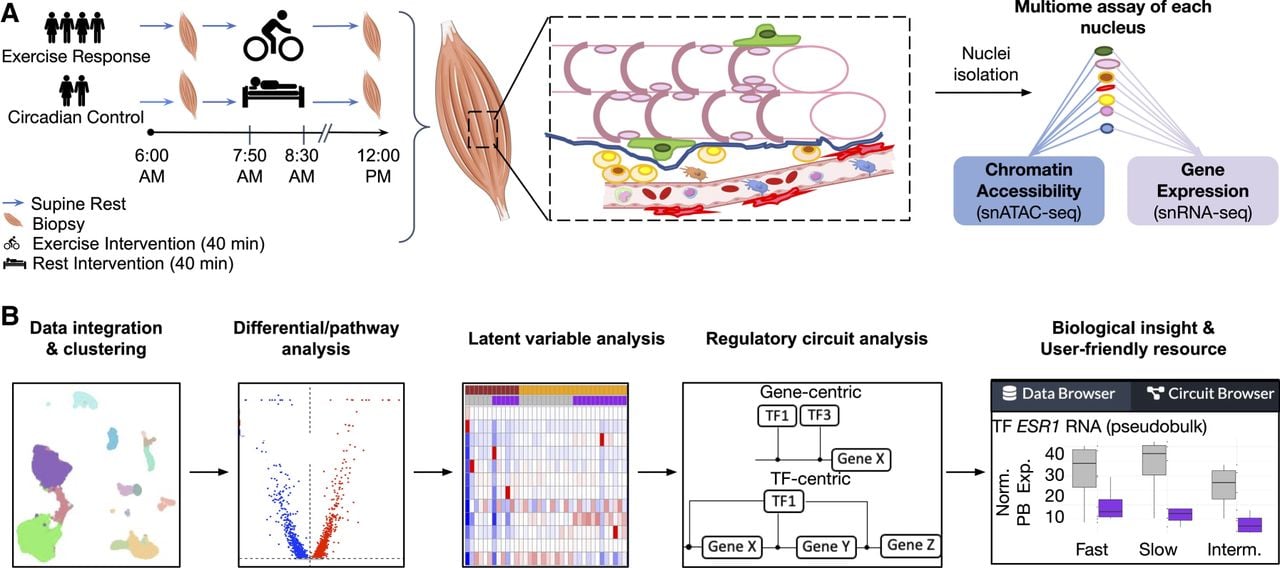
To generate a multiome muscle exercise data set, vastus lateralis skeletal muscle biopsies were obtained from four healthy, physically active participants (two males, two females) before and 3.5 h after an acute endurance exercise bout. To control for circadian effects, one male and one female physically active, healthy, resting control participants were sampled and analyzed at the same two times of day as the exercised participants (Fig. 1A; Supplemental Table S1). Nuclei isolated from the 12 skeletal muscle samples underwent single-nuclei (sn) multiome library construction and sequencing to generate same-nucleus RNA-seq and ATAC-seq data sets; sc bioinformatic analyses, including clustering, cell-type annotation, and identification of differentially expressed genes (DEGs) and differentially accessible regions (DARs), as well as further downstream analyses, were performed to characterize exercise response (Fig. 1B). The 37,154 cells from all samples passing quality control (QC) for both RNA-seq and ATAC-seq were integrated, clustered, and annotated into 14 cell types (Fig. 2A; Supplemental Fig. S1A). The clustering distinguished nuclei of different cell types by their global pattern of gene expression (for the full list of distinguishing cluster genes, see Supplemental Table S2). The cell-type annotation of each cluster is then determined using previously identified canonical cell-type markers (Rubenstein et al. 2020). Although multiple markers are used to identify each cell type, one representative marker is shown in Supplemental Figure S1B per cell type.
Schematic of study design. (A) Experimental design. Human vastus lateralis biopsies were collected before and 3.5 h after 40 min of endurance exercise at 70% VO2max in four participants. Biopsies were also collected at the same time points from two supine resting circadian controls. Nuclei were isolated and underwent same-cell single-nuclei multiome assay to assess gene expression and chromatin accessibility simultaneously. (B) Computational design. High-quality single-nuclei assay data were integrated and clustered. Single-cell bioinformatic analyses (identification of differentially expressed genes and differentially accessible regions, pathway analysis, and characterization of coordinated expression and chromatin changes using latent variable analysis) were performed for each cell type followed by both gene-centric and TF-centric regulatory circuit analyses. Regulatory circuit analyses were used to infer biological insight and compiled in a user-friendly web resource.
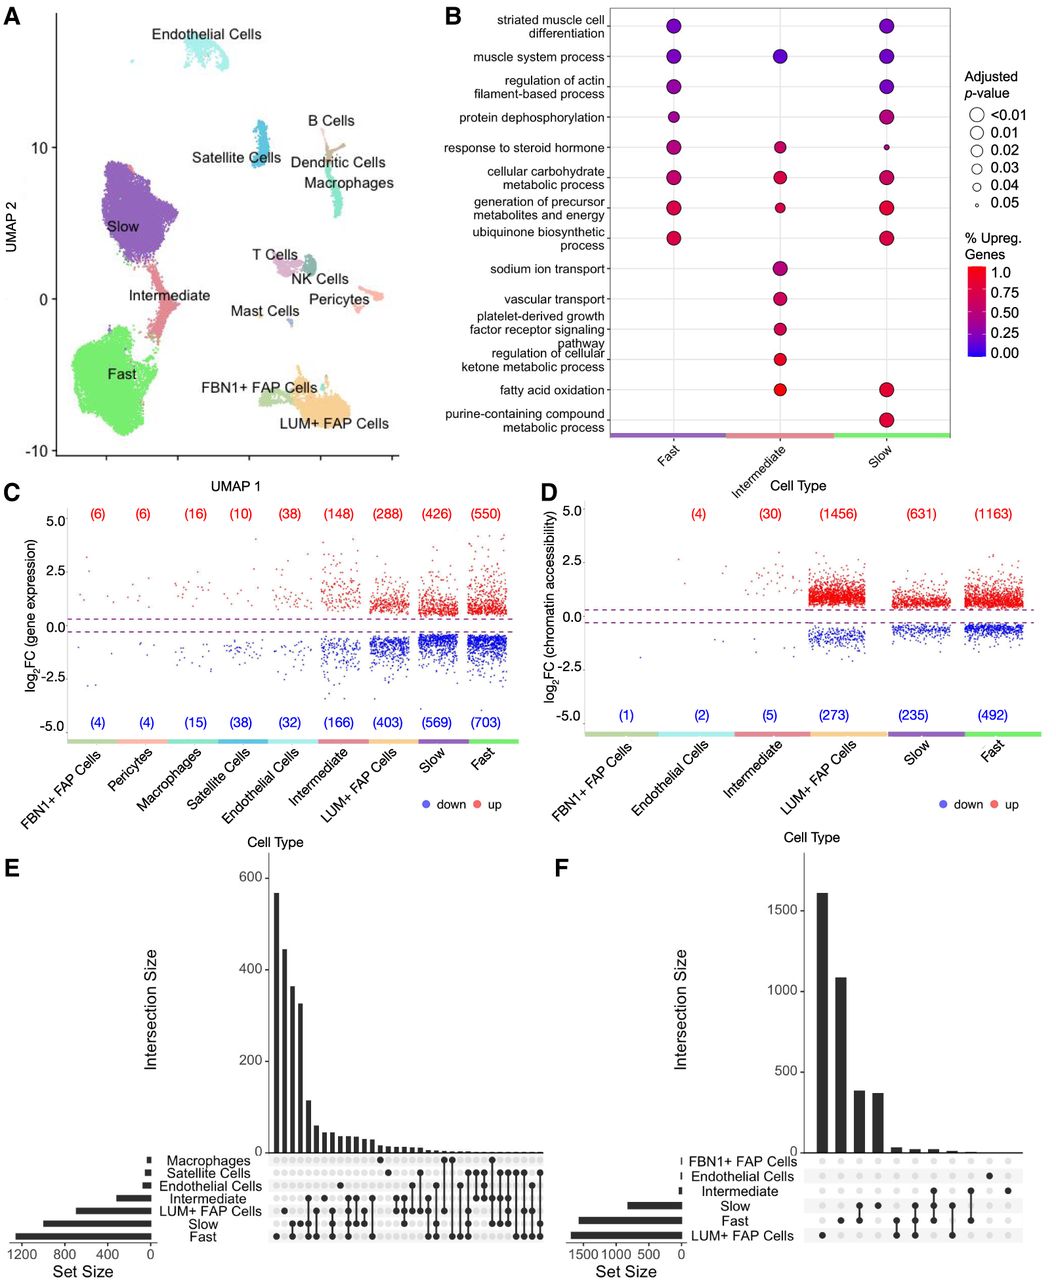
Cell-type resolution map of exercise response enables differential analysis that reveals high differential expression and accessibility for fiber types and LUM+ FAP cells. (A) High-quality single-nuclei assay data were integrated and clustered with 14 cell types identified. For cell-type markers used for annotation, see Supplemental Figure S1B, and for cell-type proportion changes, see Supplemental Figure S2. (B) Enrichment analysis of biological processes in fiber types shows functionally different transcriptome profiles for each cell type. Color represents the percentage of upregulated genes in a given pathway, and larger dot radius denotes more significant biological function. For enrichment analysis for all cell types, see Supplemental Figure S4. For detailed description of differential analysis including statistical tests used, see Methods. (C,D) Volcano plots show the distributions of upregulated and downregulated genes (C) and chromatin regions (D) for each cell type. Each point denotes a differentially expressed gene (C) or differentially accessible region (D) for a given cell type. Cell types with no significant differential features are not shown. Circadian-regulated features are excluded and shown in Supplemental Figure S3A. (E,F) UpSet plots of differentially expressed genes (E) and differentially accessible regions (F). Cell types with fewer than 10 differential features are not included, and sets with one differential feature are not shown.
Cell-type proportions in sc analyses of skeletal muscle are influenced by both inter-individual variation and differences dependent on the biopsy site. In our study, no significant differences were observed in cell-type proportions for each cell type when comparing pre- and postexercise samples (Supplemental Fig. S2). Any variation in cell-type proportion between samples does not constitute a source of confounding as it would in whole-tissue analyses, because downstream analyses in sc data are performed within each individual cell type.
To investigate molecular changes within cell types caused by exercise, we first identified the pre- to postexercise DEGs and DARs. Over all cell types, changes observed in 1210 unique genes and 1068 unique chromatin regions were attributed to circadian regulation effects (Supplemental Fig. S3) and were excluded from further analysis of exercise-related DEGs and DARs (see Methods).
Fast fibers, slow fibers, and LUM+ fibro-adipogenic progenitor (FAP) cells had the greatest numbers of exercise-regulated DEGs (1253, 995, and 691, respectively) and DARs (1655, 866, and 1729, respectively) (Fig. 2C–F; Supplemental Fig. S3). Although the slow and fast fibers showed a much larger number of DEGs than LUM+ FAP cells, the LUM+ FAP cells showed relatively more DARs (see Discussion). Fast and slow fibers showed both overlapping and fiber-type-specific regulated genes and chromatin regions (Fig. 2C–F). Intermediate fibers also had a high number of DEGs but had a comparatively lower number of DARs. Although the reason for this apparent discrepancy is uncertain, it could be related to the heterogeneous nature of intermediate fibers that typically transition to a pure fast or slow fiber with exercise training (Klitgaard et al. 1990; Williamson et al. 2001; Harber and Trappe 2008). ATAC-seq data are distributed differently than RNA-seq data, and loci are more abundant, making DARs more sensitive to false-discovery rate constraints. Therefore, DAR identification shows more sensitivity to heterogeneity within the cell type, which may reduce the number of DARs detected in intermediate cells. The mononuclear cell types (excluding LUM+ FAP cells) had the lowest numbers of DEGs and DARs both in the exercise group and in the control group.
We performed enrichment analysis for the exercise-response genes to identify pathways that are most regulated for each cell type (Fig. 2B; Supplemental Fig. S4). Slow, fast, and intermediate fiber types shared energy production/cellular respiration, steroid hormone response, and muscle function processes. Additionally, several molecular transport pathways were uniquely regulated in intermediate fibers, and a purine nucleotide metabolic pathway was uniquely regulated in slow fibers.
Exercise training stimulates remodeling of the muscle structure; therefore, presumably each exercise bout should modulate genes involved in tissue remodeling. Supporting this view, both satellite cells and slow fibers had upregulated pathways for axon guidance (Supplemental Fig. S4A). Satellite cells, LUM+ FAP cells, fast fibers, and slow muscle fibers were enriched in muscle remodeling and morphogenesis-related pathways. Endothelial cells showed exercise-stimulated activation of wound healing pathways. In addition, exercise downregulated circadian rhythm pathways in FBN1+ FAP cells and in satellite cells, including regulation of PER1 and PER3 genes that could not be accounted for only by circadian effects.
Correlated gene expression and chromatin accessibility modulated by exercise within muscle fiber types
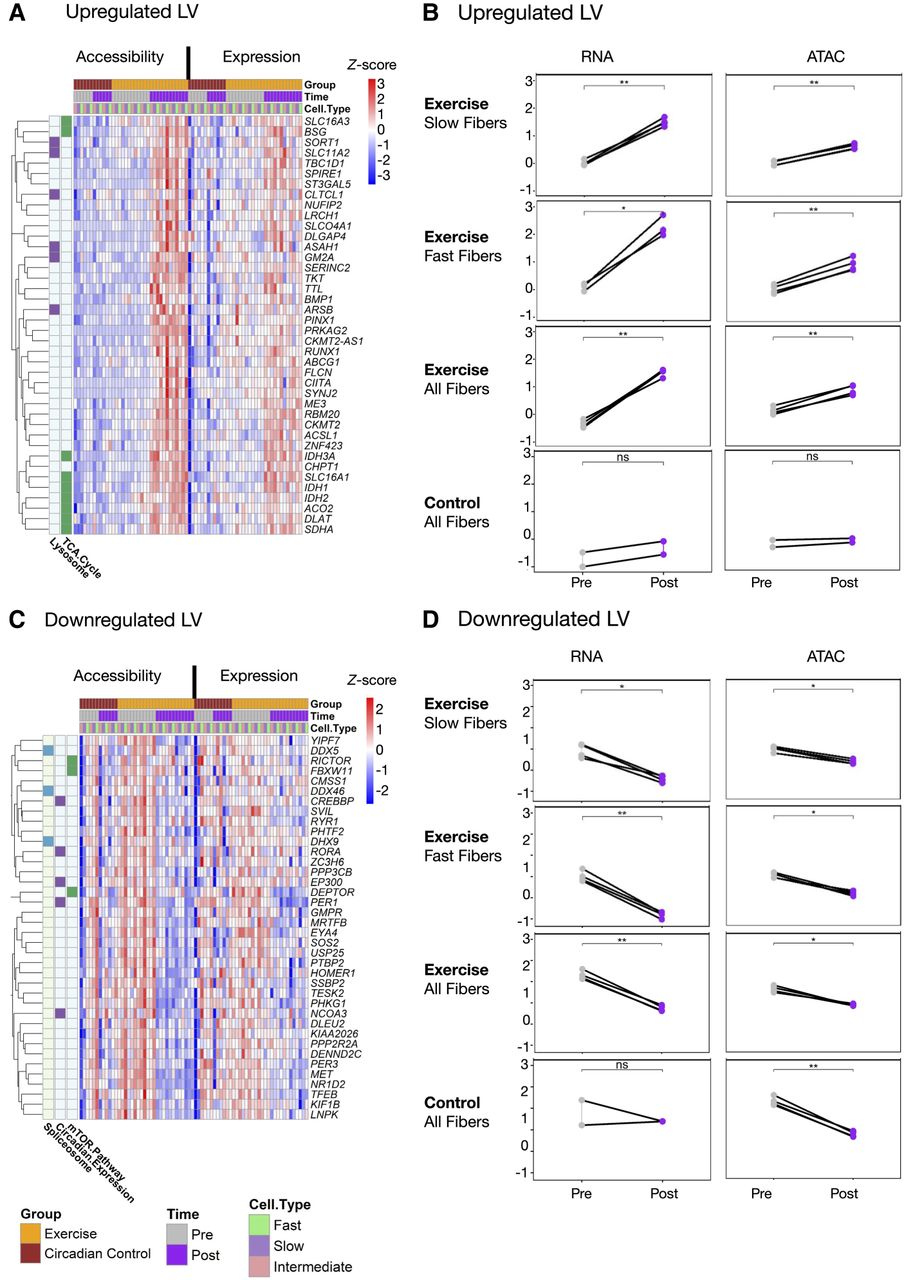
We used the pathway level information extractor framework (PLIER) (Mao et al. 2019) to identify latent variables (LVs), which can provide single-value estimates for groups of genes and chromatin loci showing correlated patterns of activity within cell types across samples (see Methods) (Supplemental Fig. S5A). These analyses are used to identify common multiomic (gene and associated chromatin change) programs that are consistently either upregulated or downregulated in multiple muscle fiber types. Multiomic regulatory programs include sets of genes and chromatin accessibility elements at the promoters of those genes. Two exercise-regulated gene-chromatin LVs were identified in the three muscle fiber cell types (Fig. 3). One showed increases with exercise at the gene expression level and the corresponding promoter accessibility (Fig. 3A). These changes were significant in all three fiber types for gene expression and in fast and slow fibers for chromatin accessibility (Fig. 3B). The features of this upregulated LV were annotated to TCA cycle, pyruvate metabolism, and lysosome pathways (Supplemental Fig. S5B). In contrast, an LV associated with mTOR, spliceosome, and circadian expression pathways showed significant decreases with exercise in gene expression and chromatin accessibility in all three fiber types (Fig. 3C,D; Supplemental Fig. S5B).
PLIER latent variable (LV) analysis identifies conserved acute exercise responses across both RNA-seq and ATAC-seq data in slow, fast, and intermediate fiber types. Two LVs representing patterns of upregulation, LV9 (A,B), and downregulation, LV12 (C,D), conserved across both gene expression and promoter chromatin accessibility are shown. For complete PLIER LV analysis, see Supplemental Figure S5. (A,C) Heatmaps represent chromatin accessibility and gene expression z-scored pseudobulk values for the top 30 genes that are associated with each LV. Each column represents one fiber-type sample; columns are ordered by -ome type, exercise group, and time point. Annotation bars on the left side of heatmap show whether genes belong to the delineated pathway. (B,D) Scatterplots represent the summary values for exercise-regulated LVs. Plots are faceted by -ome type (RNA vs. ATAC), exercise group (exercise vs. circadian control), and fiber type. Change between pre- and post-LV summary values is assessed via Holm–Bonferroni adjusted paired t-test with (ns) P > 0.05, (*) P ≤ 0.05, (**) P ≤ 0.01, (***) P ≤ 0.001, and (****) P ≤ 0.0001.
Regulatory circuitry of exercise reveals molecular mechanisms underlying exercise adaptation
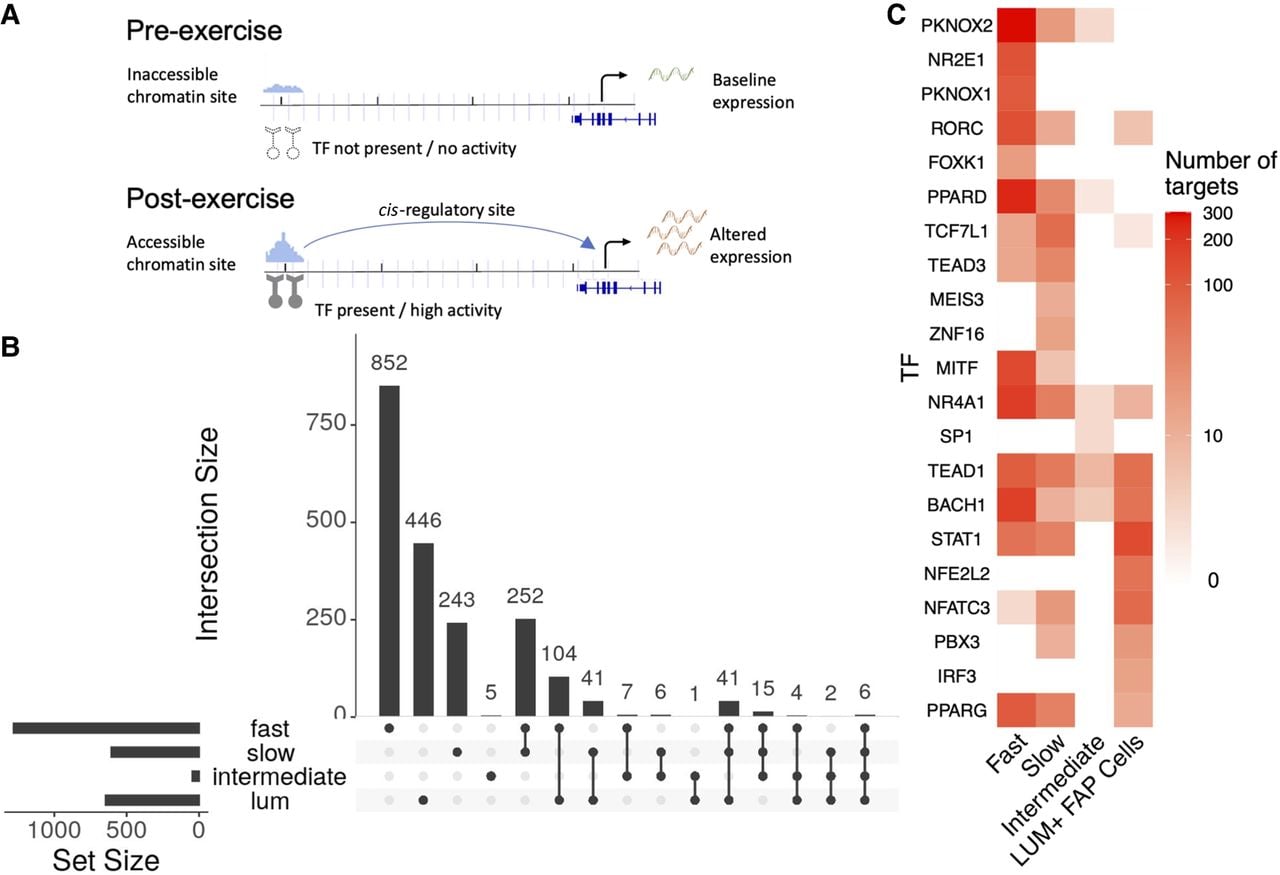
Cis-gene regulatory circuits, comprising genes, TFs, and their specific cis-regulatory sites within the chromatin, serve a major role in determining gene expression. The sc multiome data sets, by profiling the regulatory circuit components within each nucleus, make it possible to reconstruct the cell-type-specific gene control circuitry mediating the transcriptional response to exercise at sc resolution (Fig. 4A). Exercise-regulated circuits were identified for each cell type with concordant changes in estimated TF activity, target gene expression, and chromatin accessibility of regulatory sites between pre- and postexercise samples (see Methods). For these analyses, we focused on fast, intermediate, and slow fibers, as well as LUM+ FAP cells, as these cell types had adequate cell numbers and robust responses to exercise for regulatory circuit inference. Applying recently developed complementary bioinformatic methods (Chen et al. 2023; Zhang et al. 2024), a total of 2025 exercise-regulated circuit genes were identified among the four cell types, with the highest number found in the fast fibers (Fig. 4B). Although some circuits were shared among cell types, the slow- and fast-fiber types each displayed distinct regulatory programs regulating hundreds of unique genes, reflecting fiber and cell-type-specific transcriptional remodeling programs activated by acute endurance exercise (Fig. 4B). The regulatory programs showed a higher level of overlap among fiber types when comparing the driving TFs as opposed to when comparing the regulated circuit genes (Fig. 4C).
Regulatory circuitry of exercise reveals molecular mechanisms underlying exercise response. (A) Schematic figure showing the components of regulatory circuits underlying exercise-related gene expression changes. (B) UpSet plot displays the sizes of overlapping and unique sets of exercise-related circuit genes identified in each cell type. (C) Heatmap reveals the numbers of identified targets of selected TFs (rows) in each cell type (columns).
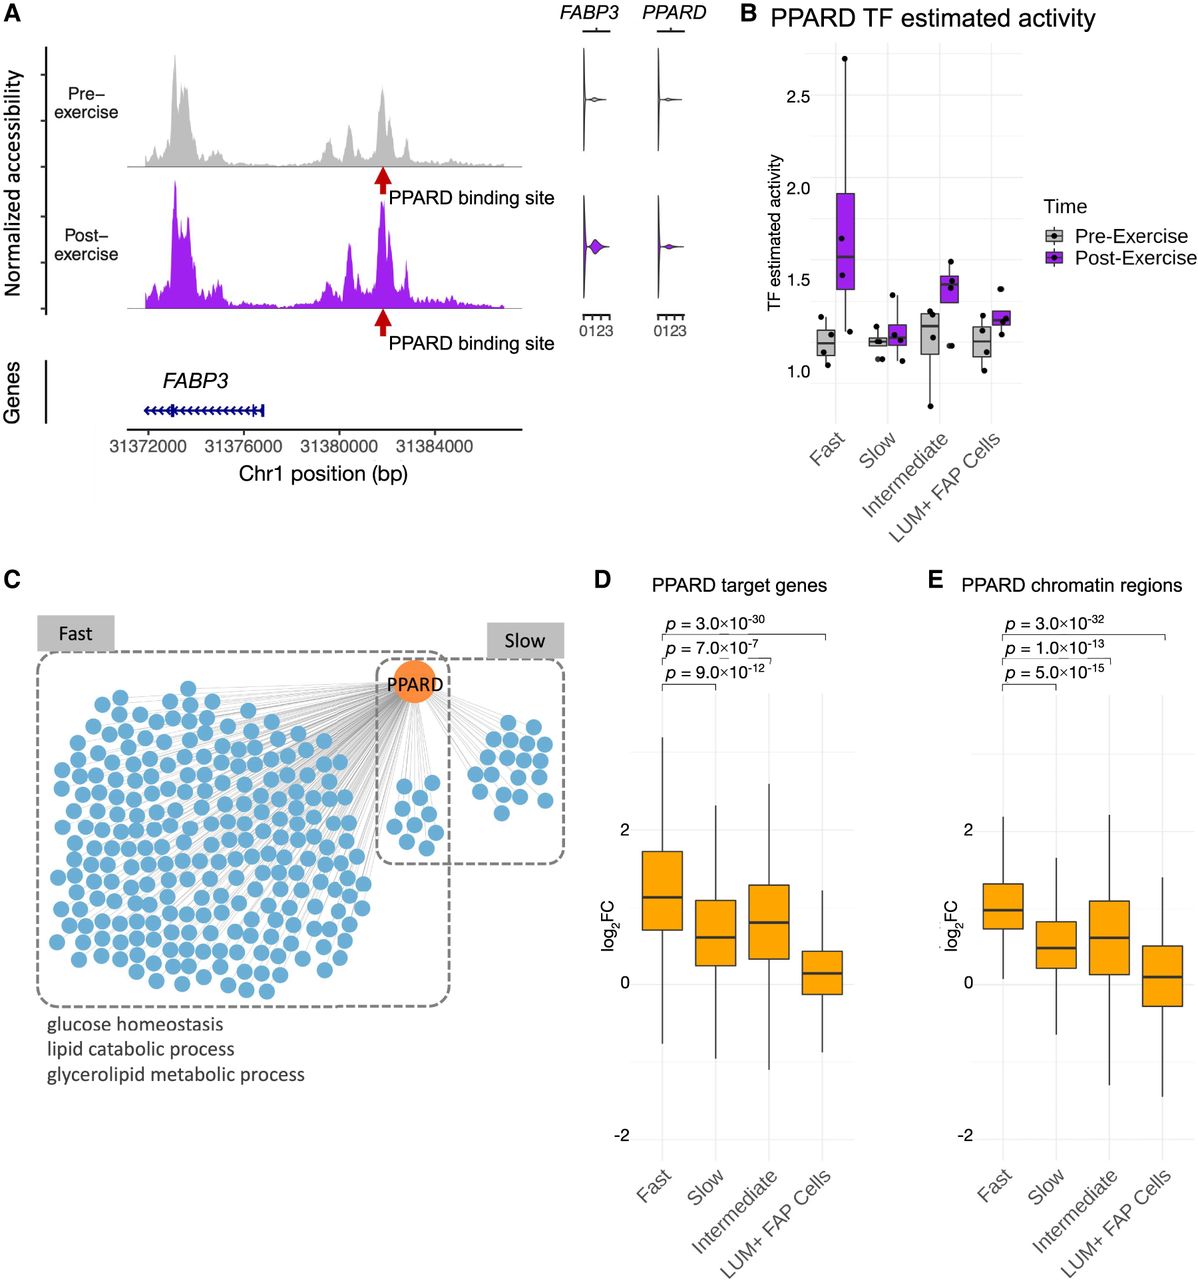
To illustrate the utility of the exercise sc multiome and inferred regulatory circuitry resource for revealing processes showing differential activity in skeletal muscle fiber types, we analyzed the TF PPARD, which has been implicated in regulation of glucose uptake, lipid oxidation, and muscle fiber type switching (Tanaka et al. 2003; Wang et al. 2004; Lee et al. 2006). An example of a PPARD regulatory circuit, in which a target gene FABP3 was found to be regulated with exercise in fast fibers, is shown in Figure 5A. In this circuit, estimated TF activity (PPARD) and its target gene (FABP3) were both upregulated in response to exercise, whereas the PPARD binding site upstream of FABP3 also showed higher accessibility after exercise. We investigated the broader PPARD regulatory network in multiple cell types, examining the three aspects of PPARD circuits: PPARD itself, circuit target genes, and associated chromatin regions. The estimated activity of PPARD showed upregulation specifically in the fast-fiber type in response to exercise (Fig. 5B). PPARD was also found to be a regulator of 242 circuit genes in fast fibers and only 29 circuit genes in slow fibers (Fig. 5C; Supplemental Table S3). To explore the extent of the PPARD circuits’ specificity to fast fibers, we examined the differential signal of the fast-fiber PPARD circuit components across cell types. These 242 PPARD circuit genes and 198 associated chromatin regions containing the PPARD binding sites showed significantly higher upregulation in the fast fibers compared with other cell types (Fig. 5D). Enrichment analysis of fast-fiber PPARD circuit genes revealed that metabolic pathways such as glucose homeostasis and lipid catabolic process were upregulated in the PPARD network (Fig. 5C), which is consistent with previous reports of PPARD's function in muscle fibers (Tanaka et al. 2003; Lee et al. 2006). These results reveal that PPARD predominantly regulates a fast-fiber-specific network in response to endurance exercise. In contrast to its activity in fast fibers, PPARD is activated in slow fibers in response to exercise to a much smaller extent, with lower gene expression and fewer regulated target genes. Our user-friendly web-accessible interface, the Muscle Multiome Browser, facilitates interrogating gene, chromatin, TFs, and regulatory circuits of interest to any investigator (https://rstudio-connect.hpc.mssm.edu/muscle-multiome/).
Regulatory circuitry of a fast-fiber-specific exercise-related TF: PPARD. (A) Example of a regulatory circuit (PPARD-FABP3) in which TF PPARD interacts with a cis-regulatory region upstream of the target gene FABP3 and regulates its expression after exercise. (Left) The normalized chromatin accessibility of the genomic regions around the transcription start site (TSS) of FABP3 in fast fibers pre-exercise (gray) and postexercise (purple). Red arrow indicates the location of the PPARD binding site. (Right) Violin plots showing the expression of FABP3 and PPARD pre-exercise (gray) and postexercise (purple). (B) Estimated TF activity as normalized pseudobulk RNA expression of PPARD in each group, time point, and cell type is depicted as a boxplot with one point per sample. For each group and cell type, both the pre-exercise and postexercise RNA expressions of each sample were normalized by the mean of the pre-exercise samples. (C) Network plot reveals the cell-type-specific target genes (blue) of PPARD (orange) identified by the integrated regulatory circuit analysis. Selected GO terms enriched in the target genes are annotated below. (D,E) Log2 fold-change (log2FC) between postexercise and pre-exercise of the target genes (D) and chromatin regions (E) in the fast-fiber-specific PPARD circuitry in each cell type. P-values are calculated using a one-sided Wilcoxon test comparing the log2FC between fast fibers and other cell types.
Discussion
Muscle is a key tissue in mediating the metabolic changes occurring with endurance exercise that underlie many of its systemic effects on performance and health (Chow et al. 2022). Despite interest in cell-type-specific responses to exercise in muscle (Cho and Doles 2017; Ramachandran et al. 2019; Barruet et al. 2020; De Micheli et al. 2020a,b; Dong et al. 2020; Rubenstein et al. 2020; McKellar et al. 2021; Orchard et al. 2021; Yue et al. 2021; Zhang et al. 2021; Lovrić et al. 2022; Sahinyan et al. 2022; Raue et al. 2024), tissue-wide cell-type-specific gene and chromatin responses in human skeletal muscle have not been characterized. To address this gap, we profiled the regulatory landscape of the response to endurance exercise in skeletal muscle using same-cell sc multiome data to generate a resource for interrogating the fine-grained molecular response to exercise. The application of recently developed bioinformatic frameworks generated high-resolution reconstruction of the exercise-response gene regulatory circuitry at a cell-type-specific level. Our analyses identified a total of 2025 exercise-regulated circuit genes, as well as the TFs and chromatin interaction sites mediating the regulation of each gene. Our data and analyses provide insight into the gene regulatory mechanisms controlling any specific gene response within muscle cell types within this small sample of healthy individuals 3.5 h after endurance cycling exercise.
The data, analyses, and results of our study also demonstrate how the resource we have generated provides detailed exercise-response cell and circuit level resolution for any TF or gene of interest and serves as a source of insight for exercise physiology researchers. The transcriptome and chromatin responses to acute endurance exercise in human muscle at 3.5 h postexercise bout is largely distinct among the 14 different cell types within the same tissue. We find that the relative number of DEGs in fast and slow muscle fibers compared with LUM+ FAP cells is higher, whereas the relative number of DARs is higher in the LUM+ FAP cells (see Fig. 2C,D). One possible explanation for this difference is that the individuals studied were recreationally active, and their chromatin may already show some changes in accessibility that prime them for differential expression in the muscle fibers relative to the LUM+ FAP cells. Another potential explanation is that gene expression and chromatin accessibility changes may occur at different time points in different cell types. Although studies of DNA methylation have reported that training induces epigenetic memory in muscle (Seaborne et al. 2018; Furrer et al. 2023; Pilotto et al. 2025), a study of promoter methylation and gene expression of selected genes during acute exercise reported that the dynamics of hypomethylation and increased gene expression may be temporally discordant (Barrès et al. 2012). If the relative dynamics of gene and chromatin changes in contracting fibers differ from those in LUM+ FAP cells, apparent cell-type DEG/DAR discordance may result from comparing changes seen simultaneously in both data types in assays performed at only a single time point post exercise. Resolving these questions will require time course studies.
For many cell types, we see an apparent tendency to call more down- than upregulated genes (Fig. 2C). We note, however, that because the fold-change distributions of up- and downregulated genes are not identical, the relative numbers of upregulated genes and downregulated genes are sensitive to the precise thresholding parameters utilized and are therefore unlikely to be of biological significance. Supplemental Figure S6, a volcano plot of DEGs as determined from sc data alone with a LFC of 0.3 and an FDR of 0.05, has a higher number of upregulated than downregulated genes, thus illustrating this sensitivity. Among muscle fiber cell types, the fast fibers show the broadest and most robust activation of transcriptional and chromatin remodeling programs. Fast and slow fibers had a high degree of overlap in circuit TFs and a lower degree of overlap in circuit genes, suggesting that a major mechanism contributing to fiber-type-specific responses to endurance exercise at 3.5 h may be the capacity of genes to respond in each tissue owing to their baseline epigenetic state.
Our results provide data-driven hypotheses for some mechanisms of acute endurance exercise-mediated metabolic changes at the cell-type level. Pathway enrichment analysis of fiber-type differential genes revealed that several pathways involving energy production and cellular respiration were upregulated in all fibers with greater regulatory changes seen in fast fibers. The coordinated upregulation of genes and chromatin sites annotated to metabolic pathways was present in all muscle fibers but to a greater degree in fast fibers. This was detected by both functional enrichment analyses and by integrated gene-chromatin LV decomposition (Fig. 3). Previous research has shown that fast muscle fibers are highly responsive to exercise at both the molecular level and the phenotypic level. Young endurance athletes (swimmers, runners, cyclists) have a high degree of plasticity (size and contractile function) in response to various exercise programs (Fitts et al. 1989; Trappe et al. 2001; Neary et al. 2003; Luden et al. 2010). Furthermore, fast muscle fibers display a robust molecular response to a single bout of exercise (Koopman et al. 2006; Raue et al. 2012, 2024; Murach et al. 2014; Trappe et al. 2015) and are easily recruited during submaximal cycle exercise and resistance exercise (Yang et al. 2006; Altenburg et al. 2007).
Slow fiber–specific enrichment pathways revealed upregulation of purine metabolism. Although the generic purine nucleotide metabolism GO biological process contains aerobic metabolism genes (e.g., OXPHOS subunits, PPARGC1A, and PPARA), few of those genes are included in the enriched purine metabolism pathway genes in our study, suggesting that the enriched purine metabolic pathway is not caused by aerobic metabolic demands and appears to be caused by purine nucleotide metabolism instead. Purine metabolism is commonly considered to be increased with higher intensity anaerobic exercise or exercising in an energy depleted state (Lowenstein 1972; Arabadjis et al. 1993; Ipata and Pesi 2018), and neither of those factors apply to our study protocol. Moreover, our results indicate that the purine transcriptional pathway is activated in slow fibers several hours following this acute aerobic exercise. Therefore, this biosynthetic response does not appear to reflect the specific metabolic needs of the exercise bout that stimulated these transcriptional changes. Overall, these findings suggest a potential novel role of altered biosynthetic activity implicated in human skeletal muscle purine pathway energy production initiated by endurance exercise in a muscle fiber-type-specific manner that warrants further study (Sutton et al. 1980).
PPARD is an important factor in glucose homeostasis and muscle substrate regulation. Our analyses provide new insight into the relative role of distinct fiber types in this process and the specific PPARD regulatory circuits responding to endurance exercise at 3.5 h after exercise within each fiber type. Although PPARD regulatory circuit effects have recently been studied in human cardiac stem cells (Wickramasinghe et al. 2022), studies in human muscle tissue in vivo have been limited. We find that PPARD primarily regulates a fast-fiber-specific network in response to endurance exercise. This is interesting given the proposed role of PPARD in the shift in substrate utilization from glucose toward fat, associated with endurance exercise training (Fan et al. 2017).
Though our study provides a transcriptome and chromatin landscape of muscle remodeling initiated by a single exercise bout at a resolution that has only recently become addressable experimentally and bioinformatically, the cutting-edge sn simultaneous multiome assay we utilized limits the number of participants that can be feasibly studied. Our participants are all young healthy adults; however, there is a wide range of BMI and relative VO2max values (Supplemental Table S1), with up to ∼25% differences between individual circadian control subjects and exercise subjects. Although our study is adequately powered for robust results given the large number of nuclei that are simultaneously quantified for both transcriptome levels and chromatin accessibility, our results may not reflect a more diverse population, and we cannot characterize molecular responses of subgroups. Although we see consistent circadian effects in all our exercise and control participants, allowing us to distinguish exercise-stimulated responses, the study of only two circadian control participants limits the power to detect smaller circadian effects. Further study is needed to avoid any possible biases in discriminating exercise and circadian effects. Exercised muscle in this study is exposed to both muscle contraction and to changes in circulating factors that occur during exercise. Our study design cannot distinguish these two causes of regulatory responses in muscle cells (Heidorn et al. 2023). Our study differs in the power to detect regulatory changes in different cell types. For example, relatively few DEGs and no significant DARs are identified in satellite cells, but the ability to detect regulatory changes is limited in these cells owing to their low abundance. A larger study is needed to investigate exercise effects that vary with age, health, sex, exercise modality, intensity, and repeated training bouts or other factors that potentially influence exercise responses, as well as to capture the full temporal trajectory and cellular distribution of these changes.
The epigenetic focus of our study is limited to changes in chromatin accessibility and does not reflect the spectrum of possible epigenetic mechanisms regulated by exercise. Bulk muscle tissue exercise studies of epigenetic change in human and animal models have focused on DNA methylation. Multiple studies have characterized the DNA methylome response to both acute and chronic modes of resistance, high intensity, and endurance exercise in humans (Barrès et al. 2012; Nitert et al. 2012; Rowlands et al. 2014; Seaborne et al. 2018; Turner et al. 2019; Maasar et al. 2021; Gorski et al. 2023a,b; Jacques et al. 2023; Sexton et al. 2023; Edman et al. 2024; Pilotto et al. 2025). Additionally, multiple studies have investigated DNA methylation in rodents after synergist ablation (Von Walden et al. 2020), chronic progressive weighted-wheel running training (Wen et al. 2021; Chambers et al. 2025), and acute and chronic endurance exercise (Furrer et al. 2023); sc methods for measurement of other epigenetic features including DNA methylation (Lee et al. 2019; Liu et al. 2023) and histone modification (Bartosovic and Castelo-Branco 2023) have been developed. Recently, bulk studies have begun to investigate the response to exercise across tissues and multiple -omes (Egan and Sharples 2023; MoTrPAC Study Group et al. 2024; Nair et al. 2024). It will be important in future studies to extend the range of sc multiomic features that are measured and use these data to develop a comprehensive, mechanistic model of the molecular responses to exercise.
Our resource of within-sc gene expression and chromatin accessibility of the effects of endurance exercise and cell-type resolution map of the gene regulatory circuitry underlying the effects of exercise is made available to the community in a web-accessible interface, the Muscle Multiome Browser (https://rstudio-connect.hpc.mssm.edu/muscle-multiome/). Given the prominent role skeletal muscle plays in locomotion, overall metabolic health, and organ cross talk, these results provide a framework for future studies into the mechanisms through which the exercise effects on muscle modulate health and disease.
Methods
Ethics approval and consent to participate
The study complied with all ethical regulations and institutional protocols for studying human samples. All procedures associated with the research were approved by the institutional review board at Ball State University and performed in accordance with relevant guidelines and regulations (IRB protocol 123578). Participants provided written informed consent prior to participation. Donor anonymity was preserved, and guidelines were followed regarding consent, protection of human participants, and donor confidentiality.
Experimental model and participant details
Six participants were enrolled in the study, of which four participants (two males, two females) were in the endurance exercise group and two participants (one male, one female) were in the circadian control group. Supplemental Table S1 includes information on participant sex, age, height, weight, BMI, body fat percentage, VO2max (absolute and relative), and group (circadian control vs. endurance exercise). All participants were physically active (i.e., regular endurance and/or resistance exercise 3–5 days per week), were nonsmokers, and were apparently healthy. BMI and relative VO2max for the circadian control participants were within or close to the range of these measures for the exercise group participants. None of the participants chronically consumed prescription or nonprescription analgesics, anti-inflammatory drugs, or dietary supplements.
Method details
Exercise procedure and sample collection
Participants were instructed to refrain from COX-inhibitor (e.g., aspirin, acetaminophen, ibuprofen) consumption for 7 days before their acute exercise or control trial. For 48 h leading into the trial, participants were instructed to refrain from alcohol consumption and exercise training and to maintain normal dietary habits. For 24 h leading into the trial, participants were instructed to refrain from caffeine consumption. The evening before the trial, participants were instructed to consume their evening meal no later than 19:00. In addition, participants were provided a liquid nutritional supplement 158 (Ensure Plus, Abbott Laboratories; 8 oz, 350 kcal, 57% carbohydrate, 15% protein, and 28% fat) to consume 10 h before the scheduled baseline biospecimen collection the following morning. This supplement provided standardization for final nutrient intake and fast duration across all participants. Only water was allowed after the supplement until the completion of the trial the next day. All females completed the acute exercise or resting control trial between days 3 and 7 of their menstrual cycle (self-reported).
Participants arrived at about 06:00 to the laboratory after an ∼10 h overnight fast on the morning of their trial and rested in the supine position for at least 30 min prior to sample collection. The average oxygen uptake during the trial was 2.41 ± 0.26 L/min, which was 71 ± 1% of VO2max. Blood lactate was 0.71 ± 0.04 mM before exercise and 2.94 ± 0.78 mM at the end of exercise. Borg rating of perceived exertion was 14 ± 1 during the trial. Skeletal muscle biopsies were obtained from the vastus lateralis following local anesthetic (1% lidocaine HCl) with a 6 mm Bergström needle with suction both at baseline and 3.5 h after intervention (i.e., exercise bout or rest) (Bergström 1962; Raue et al. 2012; Gries et al. 2018) in alternating legs. The 3.5 h postexercise biopsy time point was chosen based on previous investigations showing that robust changes in gene expression occur several hours after acute endurance exercise (Yang et al. 2005; Louis et al. 2007; Raue et al. 2015, 2024; Rubenstein et al. 2022). Biopsy tissue was frozen and kept at −80°C until processing.
Nuclei isolation from muscle samples
Frozen human skeletal muscle samples were pulverized on dry-ice and the powder used for nuclei isolation. The protocol followed was previously described (Mendelev et al. 2022; Zhang et al. 2022). Briefly, and all on ice, RNase inhibitor (NEB MO314L) was added to the homogenization buffer (0.32 m sucrose, 1 mM EDTA, 10 mM Tris-HCl at pH 7.4, 5 mM CaCl2, 3 mM Mg(Ac)2, 0.1% IGEPAL CA-630), 50% OptiPrep (stock is 60% media from StemCell 07820), 35% OptiPrep, and 30% OptiPrep right before isolation. Each sample was homogenized in a Dounce glass homogenizer (1 mL, VWR 71000-514), and the homogenate was filtered through a 40 µm cell strainer. An equal volume of 50% OptiPrep was added, and the gradient was centrifuged (SW41 rotor at 17,792g, 25 min, 4°C). Nuclei were collected from the interphase, washed, resuspended in 1× nuclei dilution buffer for the sn multiome (10x Genomics), and counted (Cellometer) before proceeding for the sn multiome assay.
Sn multiome assay
The sn multiome was performed following the chromium single-cell multiome ATAC and gene expression reagent kits V1 user guide (10x Genomics). Nuclei were counted (Cellometer K2 counter); transposition was performed in 10 µL for 60 min at 37°C targeting up to 10,000 nuclei, before loading of the Chromium chip J (PN-2000264) for GEM generation and barcoding. Samples that did not meet a minimum of 2000 nuclei per macroliter at counting prior to transposition were processed in technical duplicates from the same initial pool of nuclei to obtain enough nuclei for analysis. A minimum of 1000 total nuclei per sample was run through transposition. Following post-GEM cleanup, libraries were preamplified by PCR, after which the sample was split into three parts: one part generated the snRNA-seq library, one part generated the snATAC-seq library, and the rest was kept at −20°C. SnATAC and snRNA libraries were indexed for multiplexing (Chromium i7 sample index N, set A kit PN-3000262, and Chromium i7 sample index TT, set A kit PN-3000431, respectively). All libraries were individually checked by Bioanalyzer (Agilent) and measured by Qubit (Thermo Fisher Scientific). Then, libraries were pooled by -ome type (snRNA or snATAC), and their quality was assessed by MiSeq sequencing for adjustment prior to deep sequencing using an Illumina NovaSeq.
Quantification and statistical analysis
sn multiome primary processing and QC
The CellRanger ARC 2.0.0 pipeline was run on the samples following the guidelines of 10x Genomics. Technical replicates of the same sample were aggregated. Seurat version 4 (Butler et al. 2018; Stuart et al. 2019; Hao et al. 2021) and Signac version 1 (Stuart et al. 2021) were used to perform QC on the data (Supplemental Tables S4, S5). Apoptotic, low-count cells, and doublets were identified and excluded from downstream analysis. Both apoptotic and low-count cells were identified as having lower transcript counts (500 or fewer) or low number of fragments overlapping ATAC peaks (1000 or fewer). In addition, apoptotic cells had a large proportion of mitochondrial gene transcripts (≥5%). Doublets, on the other hand, were identified as having higher counts in either RNA (5000–7000 or more depending on sample) and ATAC (20,000 or more). Cells with low-quality ATAC reads—defined as a low percentage of reads in peaks (≤5%), a high blacklist ratio (≥0.05), a high nucleosome signal (zero or more), or low TSS enrichment (two or less)—were also excluded.
The clustering analysis was performed using Seurat's weighted shared nearest-neighbor graph approach (Hao et al. 2021). This method identifies, for each cell, its nearest neighbors based on a weighted combination of the two modalities (gene expression and chromatin accessibility). The weighted nearest-neighbor graph was then used to obtain the UMAP projection of the data. The gene expression modality was used to identify cluster cell types after determination of top markers for each cluster (Supplemental Fig. S1B). Lymphocytes were further subclustered into T cells and NK cells, whereas phagocytes were subclustered into macrophages and dendritic cells.
Differential analysis
Differential analysis was performed at both the sc and pseudobulk levels, and DARs and DEGs were identified in a multistep approach. Seurat (logistic regression) was used for sc differential analysis (Butler et al. 2018; Stuart et al. 2019; Hao et al. 2021), while controlling for sequencing depth on the ATAC side using the peak region fragment metric. Pseudobulk count matrices were generated for both RNA and ATAC by summing gene expression and chromatin accessibility across each sample for a given cell type. DESeq2 (Wald test) was used for pseudobulk differential analysis (Love et al. 2014). All RNA analyses also included the participant ID as a covariate. The following steps were carried out:
SC differential analysis identified features that differed between pre- versus postintervention samples in the exercise group with FDR-corrected P-value ≤ 0.05 and percentage expression ≥0.1 in at least one time point.
Pseudobulk differential analysis identified features that differed between pre- versus postintervention samples in the exercise group with FDR-corrected P-value ≤ 0.05 and |log2FoldChange| > 0.3.
SC differential analysis identified features that differed between pre- versus postintervention samples in the circadian control group with FDR-corrected P-value ≤ 0.05 and percentage expression ≥0.1 in at least one time point.
Pseudobulk differential analysis identified features that differed between pre- versus postintervention samples in the circadian control group. Because of the small sample size of the circadian control group, P-values were not used to select features as circadian-regulated. Instead, features with a difference between pseudobulk exercise |log2FoldChange| and pseudobulk control |log2FoldChange| of less than 0.1 were identified as circadian control differential features.
The purpose of the circadian control differential feature identification is not to find a set of features that are definitively identified as being circadian regulated; rather, it is to subtract differential features that may be circadian regulated from the set of features that are putatively regulated in response to exercise. Therefore, we chose definitions of circadian control differential features that are more lenient because our goal is to create a more stringent set of exercise response features.
To ensure that these circadian effects were consistent between control and exercise participants, we computed the pairwise Spearman's correlation between all participants (both exercise and circadian controls) of the LFC of the set of circadian control features. This correlation was highly significant for each of the 30 pairwise comparisons (P < 1.0 × 10⁻¹⁴).
To further support the generalizability and reproducibility of our results, we compared the DEGs that were determined in pseudobulk (using method 2 above) to a recent meta-analysis of genes regulated by acute exercise based on 18 cohorts (Amar et al. 2021). We found over one third of the genes identified as regulated in our pseudobulk DEG analysis were reported in the meta-analysis as well (Supplemental Fig. S7). To provide a comparison, we performed a similar analysis of data from a published study of bulk muscle tissue transcriptome pre- and postacute exercise performed in eight subjects (Ely et al. 2017). The percentage of up- and downregulated genes that overlap with the compendium results are similar for our pseudobulk data and the bulk transcriptome study. These results indicate that the molecular responses obtained in our study subjects are consonant with those seen in other exercise studies.
Pathway enrichment
ClusterProfiler version 4 was used to find enriched pathways for differential genes, as defined above (Yu et al. 2012; Wu et al. 2021). The biological process ontology is used for enrichment and the background genes are the sc cell-type markers. Figure 2B and Supplemental Figure S4A show the consolidated top 10 terms per cell type for fiber types and all cell types, respectively. For Figure 2B, when pathways share overlapping genes (>75% overlapping), a representative pathway has been chosen for visualization purposes; the full plot of enriched pathways in fibers is shown in Supplemental Figure S4B.
PLIER LV analysis
A pseudobulk count matrix was generated for RNA-seq by averaging normalized gene expression across each sample for a given cell type. To generate a pseudobulk matrix for ATAC-seq, each chromatin region was first annotated as a promoter region (Wang et al. 2022a) for a gene if it was located within 3 kb upstream of or downstream from the gene transcription start site (TSS). A cumulative accessibility value was computed for each gene in each cell by summing the region accessibilities for all promoter regions. Finally, a pseudobulk count matrix for the ATAC-seq was calculated by averaging the total promoter region accessibility for each gene across each sample for a given cell type.
The fiber-type RNA-seq and ATAC-seq pseudobulk profiles (fast, slow, and intermediate) were z-scored by feature for RNA-seq and ATAC-seq separately. Z-scores were computed for each gene or peak feature such that the mean of the transformed feature became zero and the standard deviation of the transformed feature became one. Z-score computation was done across fiber types only and did not include other cell types. Pathway-Level Information ExtractoR (PLIER) (Mao et al. 2019) was applied to the concatenated gene-indexed RNA-seq and ATAC-seq matrices, identifying 12 LVs of shared measurement patterns across samples, cell types, and -omes. The statistical significance of the response to exercise (LV value) was measured within each -ome separately by a paired t-test and adjusted for multiple hypotheses by the Holm–Bonferroni method. Associated pathways were identified for the LVs as positive U-matrix values in PLIER.
MAGICAL analysis
Multiome Accessibility Gene Integration Calling And Looping (MAGICAL) was applied to the sc multiome data to identify regulatory circuits that include TFs, associated chromatin sites, and target genes (Chen et al. 2023). MAGICAL is a Bayesian framework that iteratively models chromatin accessibility and gene expression variation across cells and samples in each cell type. It estimates the confidence of TF binding at open chromatin regions and their linkages to target genes as regulatory circuits. MAGICAL also estimates the activity or protein level per TF per cell by iteratively learning its activity distribution (Liao et al. 2003). MAGICAL built candidate exercise-associated circuits by mapping TFs to DARs within each cell type using motif sequences from the chromVARmotifs library (Schep et al. 2017). Then, it linked the binding sites to DEGs in that cell type by genomic localization within ±500 kb. Here, DAR and DEG were selected if they were differential at either sc or pseudobulk level per cell type (see the section “Differential analysis”).
CREMA analysis
Control of Regulation Extracted from Multiomics Assays (CREMA) is a method for regulatory circuit inference in multiome data that scans for potential TF binding sites by motif analysis in the ±100 kb region around the TSS in a peak-agnostic manner and uses a linear model to find regulatory circuits supported by the coincidence of the RNA-level expression of the target gene, the RNA-level expression of the TF, and the local chromatin accessibility of the TF's binding site (Zhang et al. 2024). RNA-level expression is used as a proxy for estimating TF activity. Samples for each participant (both before and after time points) were pooled, and CREMA was applied to extract regulatory circuits specific to each participant and cell type. Circuits were selected if they were replicated in at least two of the four participants in the exercise group and satisfied at least one of the following two criteria: (1) the target gene and the TF both showed significant differential expression between pre- and postexercise, or (2) the target gene and the cis-regulatory site both showed significant differential expression and differential accessibility, respectively, between pre- and postexercise. Here, differential expression and accessibility were defined as being differential at either sc or pseudobulk level per cell type (see the section “Differential analysis”). Because this analysis focused on regulatory circuits with positive regulation, the fold-change was required to be in the same direction.
Integrative analysis to define regulatory circuits
The regulatory circuits extracted by MAGICAL and CREMA were integrated by taking the union of regulatory circuits as defined by the two methods. Specifically, for each target gene, all the TFs and cis-regulatory regions found by the two methods were aggregated as the regulatory circuits for this target gene.
Data access
All raw and processed sequencing data generated in this study have been submitted to the NCBI Gene Expression Omnibus (GEO; https://www.ncbi.nlm.nih.gov/geo/) under accession number GSE240061. In addition, within-sc gene expression and chromatin accessibility of the effects of endurance exercise, as well as a cell-type resolution map of the gene regulatory circuitry underlying the effects of exercise, are available in a web-accessible interface, the Muscle Multiome Browser (https://rstudio-connect.hpc.mssm.edu/muscle-multiome/).
Competing interest statement
S.C.S. is an interim chief scientific officer, consultant, and equity owner of GNOMX. E.Z. is a director of bioinformatics, consultant, and equity owner of GNOMX. The authors declare no other competing interests.
Acknowledgments
This work was supported by funding from National Institutes of Health grants R01MH125244 and R01GM071966, as well as funding via institutional Icahn School of Medicine at Mount Sinai funds and the Human Bioenergetics Program at Ball State University. We acknowledge the New York Genome Center for sequencing. This work was supported in part through the computational resources and staff expertise provided by Scientific Computing at the Icahn School of Medicine at Mount Sinai and was supported by the Clinical and Translational Science Awards (CTSA) grant UL1TR004419 from the National Center for Advancing Translational Sciences.
Author contributions: Conceptualization was by T.T., S.T., and S.C.S. Resources were provided by T.T., S.T., and T.L.C. Investigation was by T.T., S.T., T.L.C., F.R.-Z., N.M., V.D.N., and M.S.A. Data curation was by A.B.R., W.S.C., and M.Z. Formal analysis was by A.B.R., X.C., Z.Z., G.R.S., E.Z., W.S.C., O.G.T., A.R.M., and S.B.M. Visualization was by A.B.R., G.R.S., X.C., Z.Z., F.R.-Z., S.C.S., E.Z., and O.G.T. Writing of the original draft was by A.B.R., E.Z., S.C.S., X.C., Z.Z., G.R.S., F.R.-Z., and T.L.C. Review and editing were by all the authors.
Notes
[1] Supplementary material [Supplemental material is available for this article.]
[2] Article published online before print. Article, supplemental material, and publication date are at https://www.genome.org/cgi/doi/10.1101/gr.280051.124.
References
- ↵Altenburg TM, Degens H, van Mechelen W, Sargeant AJ, de Haan A. 2007. Recruitment of single muscle fibers during submaximal cycling exercise. J Appl Physiol 103: 1752–1756. 10.1152/japplphysiol.00496.2007
- ↵Amar D, Lindholm ME, Norrbom J, Wheeler MT, Rivas MA, Ashley EA. 2021. Time trajectories in the transcriptomic response to exercise: a meta-analysis. Nat Commun 12: 3471. 10.1038/s41467-021-23579-x
- ↵Arabadjis PG, Tullson PC, Terjung RL. 1993. Purine nucleoside formation in rat skeletal muscle fiber types. Am J Physiol 264: C1246–C1251. 10.1152/ajpcell.1993.264.5.C1246
- ↵Barrès R, Yan J, Egan B, Treebak JT, Rasmussen M, Fritz T, Caidahl K, Krook A, O'Gorman DJ, Zierath JR. 2012. Acute exercise remodels promoter methylation in human skeletal muscle. Cell Metab 15: 405–411. 10.1016/j.cmet.2012.01.001
- ↵Barruet E, Garcia SM, Striedinger K, Wu J, Lee S, Byrnes L, Wong A, Xuefeng S, Tamaki S, Brack AS, 2020. Functionally heterogeneous human satellite cells identified by single cell RNA sequencing. eLife 9: e51576. 10.7554/eLife.51576
- ↵Bartosovic M, Castelo-Branco G. 2023. Multimodal chromatin profiling using nanobody-based single-cell CUT&Tag. Nat Biotechnol 41: 794–805. 10.1038/s41587-022-01535-4
- ↵Bergström J. 1962. Muscle electrolytes in man. Scand J Clin Lab Invest 14: 511–513.
- ↵Bottinelli R, Pellegrino MA, Canepari M, Rossi R, Reggiani C. 1999. Specific contributions of various muscle fibre types to human muscle performance: an in vitro study. J Electromyogr Kinesiol 9: 87–95. 10.1016/S1050-6411(98)00040-6
- ↵Butler A, Hoffman P, Smibert P, Papalexi E, Satija R. 2018. Integrating single-cell transcriptomic data across different conditions, technologies, and species. Nat Biotechnol 36: 411–420. 10.1038/nbt.4096
- ↵Chambers TL, Dimet-Wiley A, Keeble AR, Haghani A, Lo W-J, Kang G, Brooke R, Horvath S, Fry CS, Watowich SJ, 2025. Methylome-proteome integration after late-life voluntary exercise training reveals regulation and target information for improved skeletal muscle health. J Physiol 603: 211–237. 10.1113/JP286681
- ↵Chapman OS, Luebeck J, Sridhar S, Wong IT-L, Dixit D, Wang S, Prasad G, Rajkumar U, Pagadala MS, Larson JD, 2023. Circular extrachromosomal DNA promotes tumor heterogeneity in high-risk medulloblastoma. Nat Genet 55: 2189–2199. 10.1038/s41588-023-01551-3
- ↵Chen X, Wang Y, Cappuccio A, Cheng W-S, Zamojski FR, Nair VD, Miller CM, Rubenstein AB, Nudelman G, Tadych A, 2023. Mapping disease regulatory circuits at cell-type resolution from single-cell multiomics data. Nat Comput Sci 3: 644–657. 10.1038/s43588-023-00476-5
- ↵Cho DS, Doles JD. 2017. Single cell transcriptome analysis of muscle satellite cells reveals widespread transcriptional heterogeneity. Gene 636: 54–63. 10.1016/j.gene.2017.09.014
- ↵Chow LS, Gerszten RE, Taylor JM, Pedersen BK, van Praag H, Trappe S, Febbraio MA, Galis ZS, Gao Y, Haus JM, 2022. Exerkines in health, resilience and disease. Nat Rev Endocrinol 18: 273–289. 10.1038/s41574-022-00641-2
- ↵De Micheli AJ, Laurilliard EJ, Heinke CL, Ravichandran H, Fraczek P, Soueid-Baumgarten S, De Vlaminck I, Elemento O, Cosgrove BD. 2020a. Single-cell analysis of the muscle stem cell hierarchy identifies heterotypic communication signals involved in skeletal muscle regeneration. Cell Rep 30: 3583–3595.e5. 10.1016/j.celrep.2020.02.067
- ↵De Micheli AJ, Spector JA, Elemento O, Cosgrove BD. 2020b. A reference single-cell transcriptomic atlas of human skeletal muscle tissue reveals bifurcated muscle stem cell populations. Skelet Muscle 10: 19. 10.1186/s13395-020-00236-3
- ↵Dickinson JM, Lee JD, Sullivan BE, Harber MP, Trappe SW, Trappe TA. 2010. A new method to study in vivo protein synthesis in slow- and fast-twitch muscle fibers and initial measurements in humans. J Appl Physiol 108: 1410–1416. 10.1152/japplphysiol.00905.2009
- ↵Dong A, Preusch CB, So W-K, Lin K, Luan S, Yi R, Wong JW, Wu Z, Cheung TH. 2020. A long noncoding RNA, LncMyoD, modulates chromatin accessibility to regulate muscle stem cell myogenic lineage progression. Proc Natl Acad Sci 117: 32464–32475. 10.1073/pnas.2005868117
- ↵Edman S, Jones RG, Jannig PR, Fernandez-Gonzalo R, Norrbom J, Thomas NT, Khadgi S, Koopmans PJ, Morena F, Chambers TL, 2024. The 24-hour molecular landscape after exercise in humans reveals MYC is sufficient for muscle growth. EMBO Rep 25: 5810–5837. 10.1038/s44319-024-00299-z
- ↵Egan B, Sharples AP. 2023. Molecular responses to acute exercise and their relevance for adaptations in skeletal muscle to exercise training. Physiol Rev 103: 2057–2170. 10.1152/physrev.00054.2021
- ↵Egan B, Zierath JR. 2013. Exercise metabolism and the molecular regulation of skeletal muscle adaptation. Cell Metab 17: 162–184. 10.1016/j.cmet.2012.12.012
- ↵Eisenstein M. 2020. The secret life of cells. Nat Methods 17: 7–10. 10.1038/s41592-019-0698-y
- ↵Ely MR, Romero SA, Sieck DC, Mangum JE, Luttrell MJ, Halliwill JR. 2017. A single dose of histamine-receptor antagonists before downhill running alters markers of muscle damage and delayed-onset muscle soreness. J Appl Physiol 122: 631–641. 10.1152/japplphysiol.00518.2016
- ↵Fan W, Waizenegger W, Lin CS, Sorrentino V, He M-X, Wall CE, Li H, Liddle C, Yu RT, Atkins AR, 2017. PPARδ promotes running endurance by preserving glucose. Cell Metab 25: 1186–1193.e4. 10.1016/j.cmet.2017.04.006
- ↵Fitts RH, Costill DL, Gardetto PR. 1989. Effect of swim exercise training on human muscle fiber function. J Appl Physiol 66: 465–475. 10.1152/jappl.1989.66.1.465
- ↵Furrer R, Heim B, Schmid S, Dilbaz S, Adak V, Nordström KJV, Ritz D, Steurer SA, Walter J, Handschin C. 2023. Molecular control of endurance training adaptation in male mouse skeletal muscle. Nat Metab 5: 2020–2035. 10.1038/s42255-023-00891-y
- ↵Gorski PP, Raastad T, Ullrich M, Turner DC, Hallén J, Savari SI, Nilsen TS, Sharples AP. 2023a. Aerobic exercise training resets the human skeletal muscle methylome 10 years after breast cancer treatment and survival. FASEB J 37: e22720. 10.1096/fj.202201510RR
- ↵Gorski PP, Turner DC, Iraki J, Morton JP, Sharples AP, Areta JL. 2023b. Human skeletal muscle methylome after low-carbohydrate energy-balanced exercise. Am J Physiol Endocrinol Metab 324: E437–E448. 10.1152/ajpendo.00029.2023
- ↵Greenhaff PL, Nevill ME, Soderlund K, Bodin K, Boobis LH, Williams C, Hultman E. 1994. The metabolic responses of human type I and II muscle fibres during maximal treadmill sprinting. J Physiol 478(Pt 1): 149–155. 10.1113/jphysiol.1994.sp020238
- ↵Gries KJ, Raue U, Perkins RK, Lavin KM, Overstreet BS, D'Acquisto LJ, Graham B, Finch WH, Kaminsky LA, Trappe TA, 2018. Cardiovascular and skeletal muscle health with lifelong exercise. J Appl Physiol 125: 1636–1645. 10.1152/japplphysiol.00174.2018
- ↵Hao Y, Hao S, Andersen-Nissen E, Mauck WM, Zheng S, Butler A, Lee MJ, Wilk AJ, Darby C, Zager M, 2021. Integrated analysis of multimodal single-cell data. Cell 184: 3573–3587.e29. 10.1016/j.cell.2021.04.048
- ↵Harber M, Trappe S. 2008. Single muscle fiber contractile properties of young competitive distance runners. J Appl Physiol 105: 629–636. 10.1152/japplphysiol.00995.2007
- ↵Hawley JA, Hargreaves M, Joyner MJ, Zierath JR. 2014. Integrative biology of exercise. Cell 159: 738–749. 10.1016/j.cell.2014.10.029
- ↵Heidorn CE, Elmer SJ, Wehmanen KW, Martin JC, McDaniel J. 2023. Single-leg cycling to maintain and improve function in healthy and clinical populations. Front Physiol 14: 1105772. 10.3389/fphys.2023.1105772
- ↵Hokken R, Laugesen S, Aagaard P, Suetta C, Frandsen U, Ørtenblad N, Nielsen J. 2021. Subcellular localization- and fibre type-dependent utilization of muscle glycogen during heavy resistance exercise in elite power and Olympic weightlifters. Acta Physiol (Oxf) 231: e13561. 10.1111/apha.13561
- ↵Hultman E, Greenhaff PL, Ren JM, Söderlund K. 1991. Energy metabolism and fatigue during intense muscle contraction. Biochem Soc Trans 19: 347–353. 10.1042/bst0190347
- ↵Ipata PL, Pesi R. 2018. Metabolic interaction between purine nucleotide cycle and oxypurine cycle during skeletal muscle contraction of different intensities: a biochemical reappraisal. Metabolomics 14: 42. 10.1007/s11306-018-1341-0
- ↵Jacques M, Landen S, Romero JA, Hiam D, Schittenhelm RB, Hanchapola I, Shah AD, Voisin S, Eynon N. 2023. Methylome and proteome integration in human skeletal muscle uncover group and individual responses to high-intensity interval training. FASEB J 37: e23184. 10.1096/fj.202300840RR
- ↵Jensen R, Ørtenblad N, Stausholm M-LH, Skjaerbaek MC, Larsen DN, Hansen M, Holmberg H-C, Plomgaard P, Nielsen J. 2020. Heterogeneity in subcellular muscle glycogen utilisation during exercise impacts endurance capacity in men. J Physiol 598: 4271–4292. 10.1113/JP280247
- ↵Kim HD, Shay T, O'Shea EK, Regev A. 2009. Transcriptional regulatory circuits: predicting numbers from alphabets. Science 325: 429–432. 10.1126/science.1171347
- ↵Klitgaard H, Mantoni M, Schiaffino S, Ausoni S, Gorza L, Laurent-Winter C, Schnohr P, Saltin B. 1990. Function, morphology and protein expression of ageing skeletal muscle: a cross-sectional study of elderly men with different training backgrounds. Acta Physiol Scand 140: 41–54. 10.1111/j.1748-1716.1990.tb08974.x
- ↵Koopman R, Zorenc AHG, Gransier RJJ, Cameron-Smith D, van Loon LJC. 2006. Increase in S6K1 phosphorylation in human skeletal muscle following resistance exercise occurs mainly in type II muscle fibers. Am J Physiol Endocrinol Metab 290: E1245–E1252. 10.1152/ajpendo.00530.2005
- ↵Kosek DJ, Kim J-S, Petrella JK, Cross JM, Bamman MM. 2006. Efficacy of 3 days/wk resistance training on myofiber hypertrophy and myogenic mechanisms in young vs. older adults. J Appl Physiol 101: 531–544. 10.1152/japplphysiol.01474.2005
- ↵Lee C-H, Olson P, Hevener A, Mehl I, Chong L-W, Olefsky JM, Gonzalez FJ, Ham J, Kang H, Peters JM, 2006. PPARdelta regulates glucose metabolism and insulin sensitivity. Proc Natl Acad Sci 103: 3444–3449. 10.1073/pnas.0511253103
- ↵Lee D-S, Luo C, Zhou J, Chandran S, Rivkin A, Bartlett A, Nery JR, Fitzpatrick C, O'Connor C, Dixon JR, 2019. Simultaneous profiling of 3D genome structure and DNA methylation in single human cells. Nat Methods 16: 999–1006. 10.1038/s41592-019-0547-z
- ↵Lee MYY, Kaestner KH, Li M. 2023. Benchmarking algorithms for joint integration of unpaired and paired single-cell RNA-seq and ATAC-seq data. Genome Biol 24: 244. 10.1186/s13059-023-03073-x
- ↵Liao JC, Boscolo R, Yang Y-L, Tran LM, Sabatti C, Roychowdhury VP. 2003. Network component analysis: reconstruction of regulatory signals in biological systems. Proc Natl Acad Sci 100: 15522–15527. 10.1073/pnas.2136632100
- ↵Liu H, Zeng Q, Zhou J, Bartlett A, Wang B-A, Berube P, Tian W, Kenworthy M, Altshul J, Nery JR, 2023. Single-cell DNA methylome and 3D multi-omic atlas of the adult mouse brain. Nature 624: 366–377. 10.1038/s41586-023-06805-y
- ↵Louis E, Raue U, Yang Y, Jemiolo B, Trappe S. 2007. Time course of proteolytic, cytokine, and myostatin gene expression after acute exercise in human skeletal muscle. J Appl Physiol 103: 1744–1751. 10.1152/japplphysiol.00679.2007
- ↵Love MI, Huber W, Anders S. 2014. Moderated estimation of fold change and dispersion for RNA-seq data with DESeq2. Genome Biol 15: 550. 10.1186/s13059-014-0550-8
- ↵Lovrić A, Rassolie A, Alam S, Mandić M, Saini A, Altun M, Fernandez-Gonzalo R, Gustafsson T, Rullman E. 2022. Single-cell sequencing deconvolutes cellular responses to exercise in human skeletal muscle. Commun Biol 5: 1121. 10.1038/s42003-022-04088-z
- ↵Lowenstein JM. 1972. Ammonia production in muscle and other tissues: the purine nucleotide cycle. Physiol Rev 52: 382–414. 10.1152/physrev.1972.52.2.382
- ↵Luden N, Minchev K, Hayes E, Louis E, Trappe T, Trappe S. 2008. Human vastus lateralis and soleus muscles display divergent cellular contractile properties. Am J Physiol Regul Integr Comp Physiol 295: R1593–8. 10.1152/ajpregu.90564.2008
- ↵Luden N, Hayes E, Galpin A, Minchev K, Jemiolo B, Raue U, Trappe TA, Harber MP, Bowers T, Trappe S. 2010. Myocellular basis for tapering in competitive distance runners. J Appl Physiol 108: 1501–1509. 10.1152/japplphysiol.00045.2010
- ↵Maasar M-F, Turner DC, Gorski PP, Seaborne RA, Strauss JA, Shepherd SO, Cocks M, Pillon NJ, Zierath JR, Hulton AT, 2021. The comparative methylome and transcriptome after change of direction compared to straight line running exercise in human skeletal muscle. Front Physiol 12: 619447. 10.3389/fphys.2021.619447
- ↵Mao W, Zaslavsky E, Hartmann BM, Sealfon SC, Chikina M. 2019. Pathway-level information extractor (PLIER) for gene expression data. Nat Methods 16: 607–610. 10.1038/s41592-019-0456-1
- ↵McKellar DW, Walter LD, Song LT, Mantri M, Wang MFZ, De Vlaminck I, Cosgrove BD. 2021. Large-scale integration of single-cell transcriptomic data captures transitional progenitor states in mouse skeletal muscle regeneration. Commun Biol 4: 1280. 10.1038/s42003-021-02810-x
- ↵Mendelev N, Zamojski M, Amper MAS, Cheng WS, Pincas H, Nair VD, Zaslavsky E, Sealfon SC, Ruf-Zamojski F. 2022. Multi-omics profiling of single nuclei from frozen archived postmortem human pituitary tissue. STAR Protoc 3: 101446. 10.1016/j.xpro.2022.101446
- ↵MoTrPAC Study Group, Lead Analysts, MoTrPAC Study Group. 2024. Temporal dynamics of the multi-omic response to endurance exercise training. Nature 629: 174–183. 10.1038/s41586-023-06877-w
- ↵Murach K, Raue U, Wilkerson B, Minchev K, Jemiolo B, Bagley J, Luden N, Trappe S. 2014. Single muscle fiber gene expression with run taper. PLoS One 9: e108547. 10.1371/journal.pone.0108547
- ↵Nair VD, Pincas H, Smith GR, Zaslavsky E, Ge Y, Amper MAS, Vasoya M, Chikina M, Sun Y, Raja AN, 2024. Molecular adaptations in response to exercise training are associated with tissue-specific transcriptomic and epigenomic signatures. Cell Genomics 4: 100421. 10.1016/j.xgen.2023.100421
- ↵Neary JP, Martin TP, Quinney HA. 2003. Effects of taper on endurance cycling capacity and single muscle fiber properties. Med Sci Sports Exerc 35: 1875–1881. 10.1249/01.MSS.0000093617.28237.20
- ↵Nitert MD, Dayeh T, Volkov P, Elgzyri T, Hall E, Nilsson E, Yang BT, Lang S, Parikh H, Wessman Y, 2012. Impact of an exercise intervention on DNA methylation in skeletal muscle from first-degree relatives of patients with type 2 diabetes. Diabetes 61: 3322–3332. 10.2337/db11-1653
- ↵Orchard P, Manickam N, Ventresca C, Vadlamudi S, Varshney A, Rai V, Kaplan J, Lalancette C, Mohlke KL, Gallagher K, 2021. Human and rat skeletal muscle single-nuclei multi-omic integrative analyses nominate causal cell types, regulatory elements, and SNPs for complex traits. Genome Res 31: 2258–2275. 10.1101/gr.268482.120
- ↵Pilotto AM, Turner DC, Mazzolari R, Crea E, Brocca L, Pellegrino MA, Miotti D, Bottinelli R, Sharples AP, Porcelli S. 2025. Human skeletal muscle possesses an epigenetic memory of high-intensity interval training. Am J Physiol Cell Physiol 328: C258–C272. 10.1152/ajpcell.00423.2024
- ↵Ramachandran K, Senagolage MD, Sommars MA, Futtner CR, Omura Y, Allred AL, Barish GD. 2019. Dynamic enhancers control skeletal muscle identity and reprogramming. PLoS Biol 17: e3000467. 10.1371/journal.pbio.3000467
- ↵Raue U, Slivka D, Minchev K, Trappe S. 2009. Improvements in whole muscle and myocellular function are limited with high-intensity resistance training in octogenarian women. J Appl Physiol 106: 1611–1617. 10.1152/japplphysiol.91587.2008
- ↵Raue U, Trappe TA, Estrem ST, Qian H-R, Helvering LM, Smith RC, Trappe S. 2012. Transcriptome signature of resistance exercise adaptations: mixed muscle and fiber type specific profiles in young and old adults. J Appl Physiol 112: 1625–1636. 10.1152/japplphysiol.00435.2011
- ↵Raue U, Jemiolo B, Yang Y, Trappe S. 2015. TWEAK-Fn14 pathway activation after exercise in human skeletal muscle: insights from two exercise modes and a time course investigation. J Appl Physiol 118: 569–578. 10.1152/japplphysiol.00759.2014
- ↵Raue U, Begue G, Minchev K, Jemiolo B, Gries KJ, Chambers T, Rubenstein A, Zaslavsky E, Sealfon SC, Trappe T, 2024. Fast and slow muscle fiber transcriptome dynamics with lifelong endurance exercise. J Appl Physiol 136: 244–261. 10.1152/japplphysiol.00442.2023
- ↵Reyes M, Billman K, Hacohen N, Blainey PC. 2019. Simultaneous profiling of gene expression and chromatin accessibility in single cells. Adv Biosys 3: 1900065. 10.1002/adbi.201900065
- ↵Romijn JA, Coyle EF, Sidossis LS, Gastaldelli A, Horowitz JF, Endert E, Wolfe RR. 1993. Regulation of endogenous fat and carbohydrate metabolism in relation to exercise intensity and duration. Am J Physiol 265: E380–E391. 10.1152/ajpendo.1993.265.3.E380
- ↵Romijn JA, Coyle EF, Sidossis LS, Rosenblatt J, Wolfe RR. 2000. Substrate metabolism during different exercise intensities in endurance-trained women. J Appl Physiol 88: 1707–1714. 10.1152/jappl.2000.88.5.1707
- ↵Rowlands DS, Page RA, Sukala WR, Giri M, Ghimbovschi SD, Hayat I, Cheema BS, Lys I, Leikis M, Sheard PW, 2014. Multi-omic integrated networks connect DNA methylation and miRNA with skeletal muscle plasticity to chronic exercise in type 2 diabetic obesity. Physiol Genomics 46: 747–765. 10.1152/physiolgenomics.00024.2014
- ↵Rubenstein AB, Smith GR, Raue U, Begue G, Minchev K, Ruf-Zamojski F, Nair VD, Wang X, Zhou L, Zaslavsky E, 2020. Single-cell transcriptional profiles in human skeletal muscle. Sci Rep 10: 229. 10.1038/s41598-019-57110-6
- ↵Rubenstein AB, Hinkley JM, Nair VD, Nudelman G, Standley RA, Yi F, Yu G, Trappe TA, Bamman MM, Trappe SW, 2022. Skeletal muscle transcriptome response to a bout of endurance exercise in physically active and sedentary older adults. Am J Physiol Endocrinol Metab 322: E260–E277. 10.1152/ajpendo.00378.2021
- ↵Sahinyan K, Blackburn DM, Simon M-M, Lazure F, Kwan T, Bourque G, Soleimani VD. 2022. Application of ATAC-seq for genome-wide analysis of the chromatin state at single myofiber resolution. eLife 11: e72792. 10.7554/eLife.72792
- ↵Sanford JA, Nogiec CD, Lindholm ME, Adkins JN, Amar D, Dasari S, Drugan JK, Fernández FM, Radom-Aizik S, Schenk S, 2020. Molecular Transducers of Physical Activity Consortium (MoTrPAC): mapping the dynamic responses to exercise. Cell 181: 1464–1474. 10.1016/j.cell.2020.06.004
- ↵Schep AN, Wu B, Buenrostro JD, Greenleaf WJ. 2017. chromVAR: inferring transcription-factor-associated accessibility from single-cell epigenomic data. Nat Methods 14: 975–978. 10.1038/nmeth.4401
- ↵Schoenfelder S, Fraser P. 2019. Long-range enhancer–promoter contacts in gene expression control. Nat Rev Genet 20: 437–455. 10.1038/s41576-019-0128-0
- ↵Seaborne RA, Strauss J, Cocks M, Shepherd S, O'Brien TD, van Someren KA, Bell PG, Murgatroyd C, Morton JP, Stewart CE, 2018. Human skeletal muscle possesses an epigenetic memory of hypertrophy. Sci Rep 8: 1898. 10.1038/s41598-018-20287-3
- ↵Sexton CL, Godwin JS, McIntosh MC, Ruple BA, Osburn SC, Hollingsworth BR, Kontos NJ, Agostinelli PJ, Kavazis AN, Ziegenfuss TN, 2023. Skeletal muscle DNA methylation and mRNA responses to a bout of higher versus lower load resistance exercise in previously trained men. Cells 12: 263. 10.3390/cells12020263
- ↵Smith JAB, Murach KA, Dyar KA, Zierath JR. 2023. Exercise metabolism and adaptation in skeletal muscle. Nat Rev Mol Cell Biol 24: 607–632. 10.1038/s41580-023-00606-x
- ↵Stuart T, Butler A, Hoffman P, Hafemeister C, Papalexi E, Mauck WM, Hao Y, Stoeckius M, Smibert P, Satija R. 2019. Comprehensive integration of single-cell data. Cell 177: 1888–1902.e21. 10.1016/j.cell.2019.05.031
- ↵Stuart T, Srivastava A, Madad S, Lareau CA, Satija R. 2021. Single-cell chromatin state analysis with Signac. Nat Methods 18: 1333–1341. 10.1038/s41592-021-01282-5
- ↵Sutton JR, Toews CJ, Ward GR, Fox IH. 1980. Purine metabolism during strenuous muscular exercise in man. Metab Clin Exp 29: 254–260. 10.1016/0026-0495(80)90067-0
- ↵Tanaka T, Yamamoto J, Iwasaki S, Asaba H, Hamura H, Ikeda Y, Watanabe M, Magoori K, Ioka RX, Tachibana K, 2003. Activation of peroxisome proliferator-activated receptor delta induces fatty acid beta-oxidation in skeletal muscle and attenuates metabolic syndrome. Proc Natl Acad Sci 100: 15924–15929. 10.1073/pnas.0306981100
- ↵Trappe S, Costill D, Thomas R. 2001. Effect of swim taper on whole muscle and single muscle fiber contractile properties. Med Sci Sports Exerc 33: 48–56. 10.1097/00005768-200101000-00009
- ↵Trappe S, Gallagher P, Harber M, Carrithers J, Fluckey J, Trappe T. 2003. Single muscle fibre contractile properties in young and old men and women. J Physiol (Lond) 552: 47–58. 10.1113/jphysiol.2003.044966
- ↵Trappe S, Harber M, Creer A, Gallagher P, Slivka D, Minchev K, Whitsett D. 2006. Single muscle fiber adaptations with marathon training. J Appl Physiol 101: 721–727. 10.1152/japplphysiol.01595.2005
- ↵Trappe S, Luden N, Minchev K, Raue U, Jemiolo B, Trappe TA. 2015. Skeletal muscle signature of a champion sprint runner. J Appl Physiol 118: 1460–1466. 10.1152/japplphysiol.00037.2015
- ↵Travisano SI, Harrison MRM, Thornton ME, Grubbs BH, Quertermous T, Lien C-L. 2023. Single-nuclei multiomic analyses identify human cardiac lymphatic endothelial cells associated with coronary arteries in the epicardium. Cell Rep 42: 113106. 10.1016/j.celrep.2023.113106
- ↵Turner DC, Seaborne RA, Sharples AP. 2019. Comparative transcriptome and methylome analysis in human skeletal muscle anabolism, hypertrophy and epigenetic memory. Sci Rep 9: 4251. 10.1038/s41598-019-40787-0
- ↵Von Walden F, Rea M, Mobley CB, Fondufe-Mittendorf Y, McCarthy JJ, Peterson CA, Murach KA. 2020. The myonuclear DNA methylome in response to an acute hypertrophic stimulus. Epigenetics 15: 1151–1162. 10.1080/15592294.2020.1755581
- ↵Wang Y-X, Zhang C-L, Yu RT, Cho HK, Nelson MC, Bayuga-Ocampo CR, Ham J, Kang H, Evans RM. 2004. Regulation of muscle fiber type and running endurance by PPARdelta. PLoS Biol 2: e294. 10.1371/journal.pbio.0020294
- ↵Wang Q, Li M, Wu T, Zhan L, Li L, Chen M, Xie W, Xie Z, Hu E, Xu S, 2022a. Exploring epigenomic datasets by ChIPseeker. Curr Protoc 2: e585. 10.1002/cpz1.585
- ↵Wang SK, Nair S, Li R, Kraft K, Pampari A, Patel A, Kang JB, Luong C, Kundaje A, Chang HY. 2022b. Single-cell multiome of the human retina and deep learning nominate causal variants in complex eye diseases. Cell Genomics 2: 100164. 10.1016/j.xgen.2022.100164
- ↵Wen Y, Dungan CM, Mobley CB, Valentino T, von Walden F, Murach KA. 2021. Nucleus type-specific DNA methylomics reveals epigenetic “memory” of prior adaptation in skeletal muscle. Function (Oxf) 2: zqab038. 10.1093/function/zqab038
- ↵Wickramasinghe NM, Sachs D, Shewale B, Gonzalez DM, Dhanan-Krishnan P, Torre D, LaMarca E, Raimo S, Dariolli R, Serasinghe MN, 2022. PPARdelta activation induces metabolic and contractile maturation of human pluripotent stem cell-derived cardiomyocytes. Cell Stem Cell 29: 559–576.e7. 10.1016/j.stem.2022.02.011
- ↵Williams RS, Neufer PD. 1996. Regulation of gene expression in skeletal muscle by contractile activity. In Handbook of physiology (ed. Rowell LB, Shepherd JT), pp. 1124–1150. Oxford University Press, New York.
- ↵Williamson DL, Gallagher PM, Carroll CC, Raue U, Trappe SW. 2001. Reduction in hybrid single muscle fiber proportions with resistance training in humans. J Appl Physiol 91: 1955–1961. 10.1152/jappl.2001.91.5.1955
- ↵Wu T, Hu E, Xu S, Chen M, Guo P, Dai Z, Feng T, Zhou L, Tang W, Zhan L, 2021. clusterProfiler 4.0: a universal enrichment tool for interpreting omics data. Innovation (Camb) 2: 100141. 10.1016/j.xinn.2021.100141
- ↵Yang Y, Creer A, Jemiolo B, Trappe S. 2005. Time course of myogenic and metabolic gene expression in response to acute exercise in human skeletal muscle. J Appl Physiol 98: 1745–1752. 10.1152/japplphysiol.01185.2004
- ↵Yang Y, Jemiolo B, Trappe S. 2006. Proteolytic mRNA expression in response to acute resistance exercise in human single skeletal muscle fibers. J Appl Physiol 101: 1442–1450. 10.1152/japplphysiol.00438.2006
- ↵Yu G, Wang L-G, Han Y, He Q-Y. 2012. clusterProfiler: an R package for comparing biological themes among gene clusters. OMICS 16: 284–287. 10.1089/omi.2011.0118
- ↵Yue J, Hou X, Liu X, Wang L, Gao H, Zhao F, Shi L, Shi L, Yan H, Deng T, 2021. The landscape of chromatin accessibility in skeletal muscle during embryonic development in pigs. J Anim Sci Biotechnol 12: 56. 10.1186/s40104-021-00577-z
- ↵Zhang K, Hocker JD, Miller M, Hou X, Chiou J, Poirion OB, Qiu Y, Li YE, Gaulton KJ, Wang A, 2021. A single-cell atlas of chromatin accessibility in the human genome. Cell 184: 5985–6001.e19. 10.1016/j.cell.2021.10.024
- ↵Zhang Z, Zamojski M, Smith GR, Willis TL, Yianni V, Mendelev N, Pincas H, Seenarine N, Amper MAS, Vasoya M, 2022. Single nucleus transcriptome and chromatin accessibility of postmortem human pituitaries reveal diverse stem cell regulatory mechanisms. Cell Rep 38: 110467. 10.1016/j.celrep.2022.110467
- ↵Zhang Z, Ruf-Zamojski F, Zamojski M, Bernard DJ, Chen X, Troyanskaya OG, Sealfon SC. 2024. Peak-agnostic high-resolution cis-regulatory circuitry mapping using single cell multiome data. Nucleic Acids Res 52: 572–582. 10.1093/nar/gkad1166
- ↵Zhu K, Bendl J, Rahman S, Vicari JM, Coleman C, Clarence T, Latouche O, Tsankova NM, Li A, Brennand KJ, 2023. Multi-omic profiling of the developing human cerebral cortex at the single-cell level. Sci Adv 9: eadg3754. 10.1126/sciadv.adg3754