
Abstract
Enhancer–promoter communication is fundamental to gene regulation in metazoans, yet the mechanisms underlying these interactions remain debated. Two primary models have been proposed: the structural bridge model, in which enhancers and promoters come into close proximity through stable, protein-mediated interactions, and the hub model, in which dynamic clusters of transcription-associated proteins facilitate communication over variable distances. Emerging evidence suggests that although enhancer–promoter pairs do come into close proximity during transcriptional activation, these interactions are highly transient, and the precise distances remain challenging to measure. Moving forward, resolving the distinctions between these models will require novel techniques to more precisely measure the spatial and temporal dynamics of enhancer–promoter interactions. Understanding how enhancers interact with promoters will deepen our understanding of the regulation of gene expression and the molecular underpinnings of transcriptional control.
Gene expression programs are encoded by cis-regulatory elements, specialized DNA sequences that control the timing of transcriptional activation. Two primary types of cis-regulatory element impact transcription in Metazoan species: promoters, which facilitate transcription initiation from an embedded transcription start site, and enhancers, which regulate the rate of mRNA production from distal promoters. The discovery of the SV40 viral enhancer was a landmark event more than 40 years ago. The 72 bp DNA sequence encoding the SV40 enhancer increased the expression of a reporter gene by more than two orders of magnitude in a manner that was largely independent of its position and orientation (Banerji et al. 1981; Benoist and Chambon 1981; Gruss et al. 1981). Today we know of numerous examples in which enhancers regulate gene expression from long genomic distances (∼10–100 kb) and are occasionally found >1 Mb away from the target promoter (Lettice et al. 2003; Spitz et al. 2003; Antonellis et al. 2006; Ghiasvand et al. 2011; Hay et al. 2016; Gasperini et al. 2019). These examples raise numerous questions about how enhancers reliably find their target promoter within a crowded nucleus, the structure of interacting enhancer–promoter pairs, and the mechanistic basis by which they communicate.
Enhancers: functional elements characterized by a stereotyped chromatin architecture
Enhancers are one variety of cis-regulatory element encoded in Metazoan genomes. They are characterized by a stereotyped pattern of transcription factor binding, transcription initiation, and chromatin organization (Fig. 1). Enhancers are often bound by one or more of the approximately 1800 transcription factors (Lambert et al. 2018). Transcription factors bind to short consensus DNA sequence motifs (∼4–12 bp) embedded in nucleosome-depleted regions ∼100–300 bp wide (He et al. 2010; Core et al. 2014; Scruggs et al. 2015; Grossman et al. 2018). Pioneer transcription factors, the first to recognize and bind to DNA even in the presence of nucleosomes, recruit histone remodeling complexes that move or displace nucleosomes, thereby creating nucleosome-free regions (Zaret and Carroll 2011). Transcriptional activators bind the nucleosome-free region and tag the flanking +1 and −1 nucleosomes with post-translational modifications, such as acetylation (H3K27ac) and methylation (H3K4me3 and H3K4me1) (Barski et al. 2007; Heintzman et al. 2007; Creyghton et al. 2010; Henriques et al. 2018).
Stereotypical features of chromatin organization at enhancers. Enhancers are units with a stereotypical organization composed of transcription factors, histones carrying characteristic post-translational modifications (PTMs), and Pol II (top) and DNA sequence codes (bottom). (Created in BioRender. Danko, C. [2025] https://www.biorender.com)
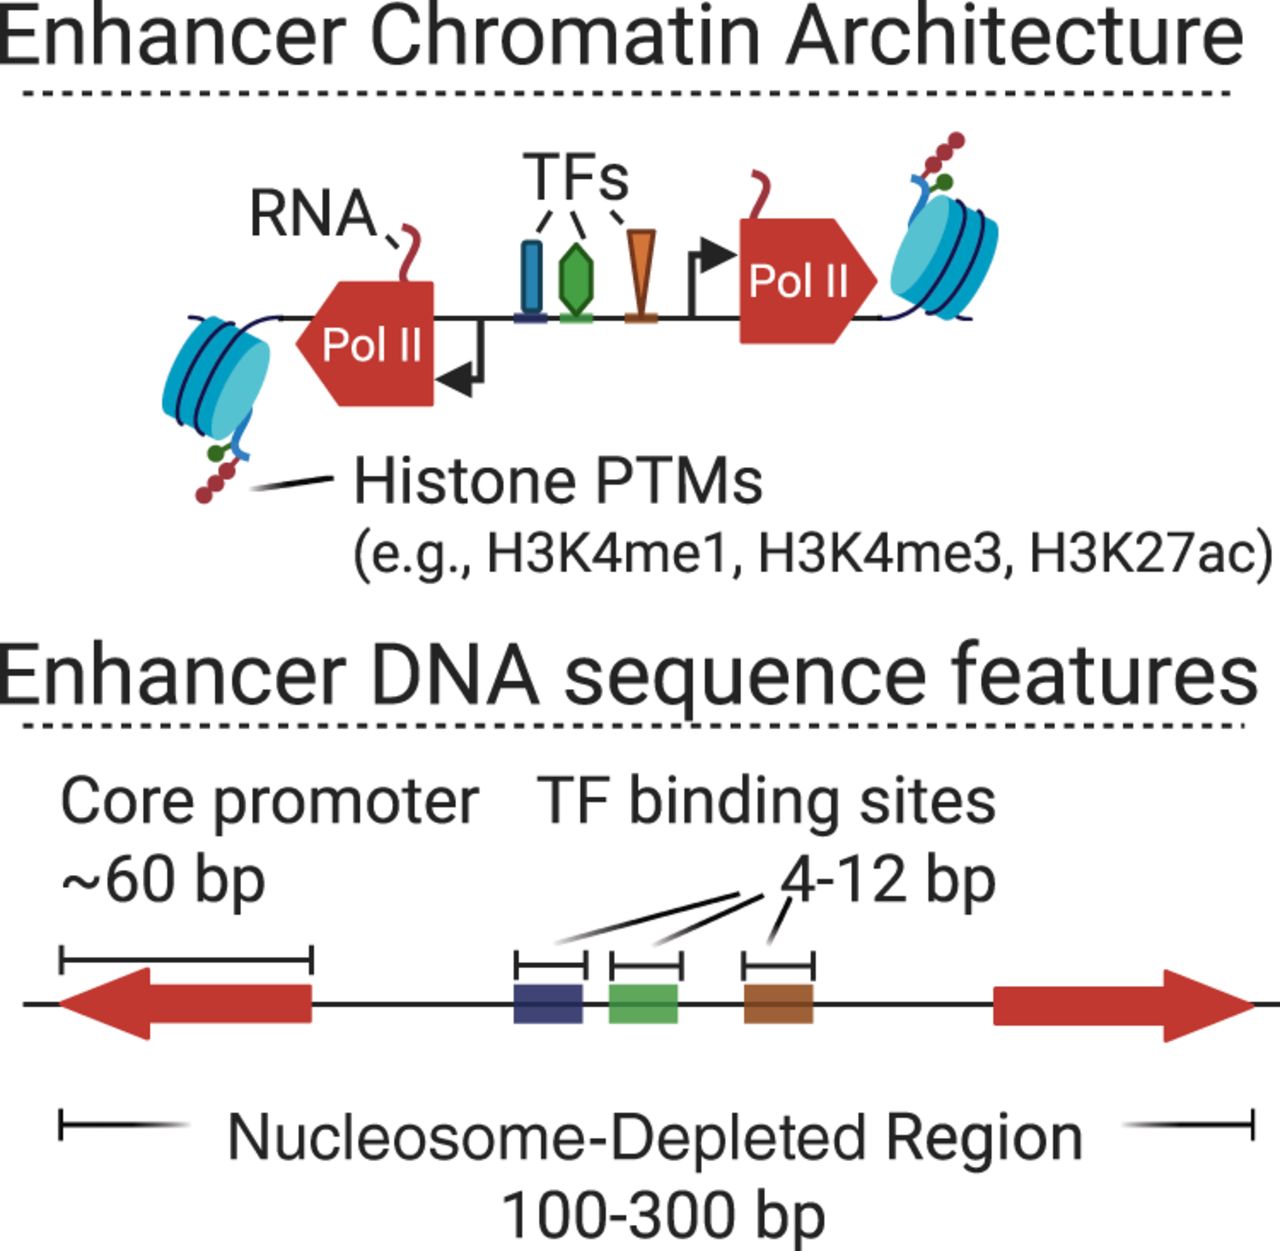
Transcription factors also promote the bidirectional initiation of RNA polymerase II (Pol II) at enhancers (De Santa et al. 2010; Kim et al. 2010; Hah et al. 2013; Andersson et al. 2014; Core et al. 2014). Pol II initiates bidirectionally, transcribes 20–60 bp, and enters a paused state, known as the promoter proximal pause (Fig. 1; Buckley et al. 2014; Jonkers et al. 2014; Henriques et al. 2018). At enhancers, these short and typically bidirectional transcription units encode enhancer-templated RNAs (eRNAs), which are terminated and rapidly degraded (De Santa et al. 2010; Kim et al. 2010).
Several lines of evidence indicate that either the act of transcription or the nascent eRNA has an important functional role. First, several studies have knocked down eRNAs, revealing a small but statistically measurable decrease in the expression of target genes (Lam et al. 2013; Melo et al. 2013; Schaukowitch et al. 2014). Second, depleting Pol II results in the immediate loss of chromatin marks indicative of enhancers, like H3K27ac (Martin et al. 2021; Wang et al. 2022), as well as enhancer–promoter loop interactions (Barshad et al. 2023; Zhang et al. 2023) (discussed in detail below). Third, removing core promoter elements, which control transcription initiation and pausing, from reporter constructs decreased enhancer activity (Tippens et al. 2020). Thus, although much work remains to be done in elucidating the role of eRNAs and other promoter and enhancer marks, existing data nevertheless support a model in which either the act of transcription or the sequence of the RNA is important for enhancer function.
The stereotyped chromatin and transcriptional environment at enhancers is similar to that observed at active promoters, raising questions about whether enhancers and promoters represent distinct classes of cis-regulatory element. In addition to evidence that enhancers initiate eRNA transcription from their own DNA sequence, thereby exhibiting promoter-like activity, several studies have shown that a subset of active promoters can function as enhancers to increase transcription at distant loci (Engreitz et al. 2016; Dao et al. 2017). These findings support a model in which cis-regulatory elements may encode both enhancer and promoter functions, depending on context (Andersson et al. 2015; Kim and Shiekhattar 2015; Andersson and Sandelin 2020).
Prevailing models of enhancer communication: structural bridge versus malleable hub
Because enhancer–promoter interactions are a critical feature of Metazoan gene regulation, much attention has been paid to the fundamental mechanisms that enable enhancer–promoter communication. Much of this discussion revolves around the architecture of enhancers’ interactions with their cognate promoters. For many years, the prevailing model proposed that enhancers and promoters come into close physical proximity in the nucleus, creating “loops” composed of the DNA polymer connecting them (Choi and Engel 1988; Robson et al. 2019; Schoenfelder and Fraser 2019). Classical looping models, which we collectively refer to as the structural bridge model, represent these enhancer–promoter interactions as a physical bridge consisting of highly stereotyped protein–protein interactions connecting the enhancer to its target promoter (Fig 2A; Yin and Wang 2014; Kim and Shiekhattar 2015; Petrenko et al. 2016).
Overview of the structural bridge and hub models. (A) The structural bridge model postulates a stereotyped bridge composed of protein–protein interactions between transcription-associated proteins (TAPs). (B) The hub model postulates a malleable hub filled with high local concentrations of TAPs. (Created in BioRender. Danko, C. [2025] https://www.biorender.com)
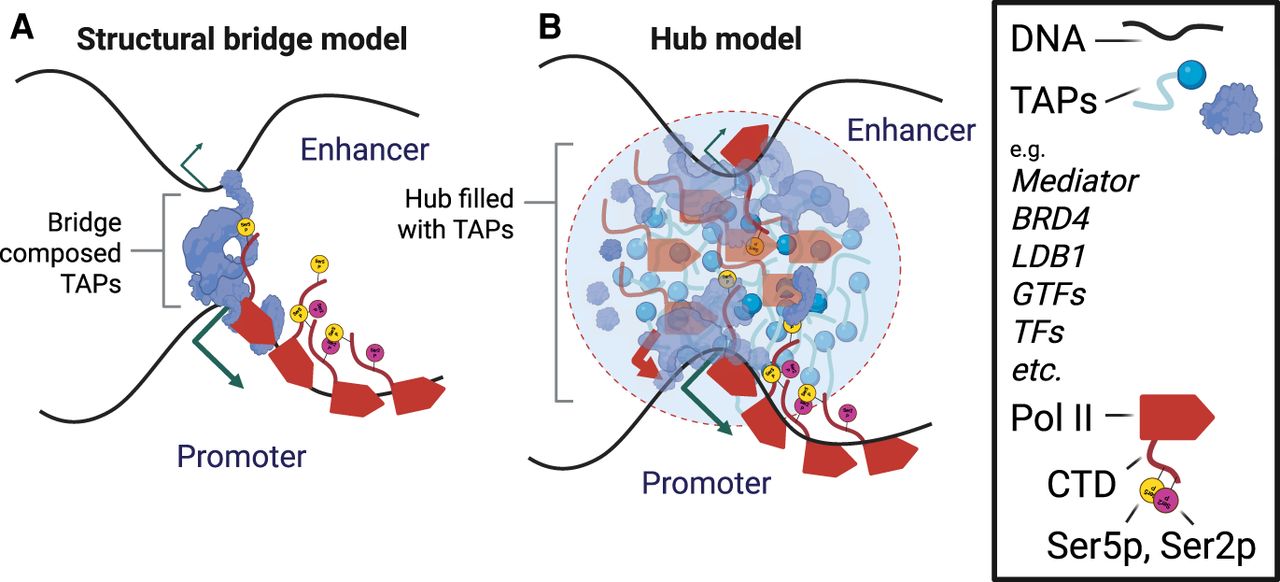
Despite some experimental support, however, several recent observations are not compatible with classical versions of the structural bridge model. An alternative model, which we refer to as the “hub” model, was proposed to address these limitations (Fig 2B; Di Giammartino et al. 2020; Bhat et al. 2021; Lim and Levine 2021; Hamamoto and Fukaya 2022). The hub model predicts that enhancer and promoter regions form malleable “hubs,” which consist of clusters of transcription-associated proteins (TAPs), such as Pol II, mediator, transcription factors, the candidate enhancer–promoter architectural protein YY1, and transcriptional coactivators and corepressors. Hubs are postulated to contain high local concentrations of TAPs; as a result, most TAPs are concentrated into specific nuclear subcompartments that comprise a relatively small portion of the nucleoplasm. The individual protein–protein or protein–nucleic acid interactions supporting the recruitment of TAPs to a hub are proposed to be relatively weak but numerous and supported by a high local concentration of a variety of interacting factors within the hub.
Variations on the hub model place different constraints on the relative physical position of the enhancer and promoter DNA. Some theoretical models postulate the transmission of regulatory information over large physical distances, including action-at-a-distance, which suggests allostery between transcriptional regulators within a liquid droplet space (Bialek et al. 2019), and the transcription factor activity gradient model, which suggests a gradient-directed flow of activated transcription factors from enhancers to their target promoters, which are spatially close (Karr et al. 2022). Notably, these models allow for fairly large distances, on the order of hundreds of nanometers, between enhancers and their target promoters. Readers interested in exploring these additional models are directed to a recent review by Yang and Hansen (2024) for additional discussion.
It is perhaps worth noting that the hub model has deep roots in transcription models that have been discussed in the literature for decades. The hub model is similar to the concept of transcription factories, which were first proposed after findings that nascent RNA production occurs in a few hundred focal sites within each nucleus (Jackson et al. 1993; Iborra et al. 1996; for review, see Sutherland and Bickmore 2009). In a sense, the hub concept advances these ideas by proposing that these transcription factories are the sites in which enhancer–promoter communication occurs. Finally, the hub model is also similar to the more recently proposed liquid–liquid phase separation models for transcriptional activation (Hnisz et al. 2017), but we note that a general hub model does not necessarily require the stringent biophysical definition of phase separation to be met precisely.
Transcriptional regulatory hubs may be just one of many distinct varieties of nuclear subcompartment (for reviews, see Bhat et al. 2021; Belmont 2022). Classic examples of nuclear subcompartments include the nucleolus (McClintock 1934), nuclear speckles (Swift 1959; Beck 1961), and dense heterochromatin located near the nuclear membrane (Pickersgill et al. 2006; Guelen et al. 2008; Kind and van Steensel 2010), each of which have unique physical and functional characteristics that facilitate their biological role. More recent work reports clusters of TAPs, including Pol II and mediator, that have been observed in living cells and may be direct observations of a transcriptional hub (Cho et al. 2018).
Throughout the remainder of this review, we will examine key findings about the dynamics, structural properties, and proteins involved in mediating enhancer–promoter communication. We will place these findings within the context of both the structural bridge and hub models. It is important to note that these two models are not mutually exclusive; we hope our review will outline the key evidence for each model and present a path toward understanding the fundamental biology of enhancer–promoter communication.
TAPs have properties that facilitate hub formation
Both the structural bridge and hub models postulate that interactions between TAPs, such as transcription factors, Pol II, mediator, cohesin, and a wide variety of transcriptional coactivator and corepressor proteins and protein complexes, have important roles in enhancer–promoter communication. Because these factors also regulate transcription, their roles in enhancer–promoter communication are closely intertwined with their functions in the Pol II transcription cycle.
Protein–protein interactions between TAPs are mediated through highly specialized protein domains. One of the most important protein domain classes for the formation of transcription hubs is intrinsically disordered regions (IDRs). IDRs contain amino acid motifs that facilitate protein–protein interactions and thereby facilitate membership in a transcription hub (Boija et al. 2018; Sabari et al. 2018). For instance, transcription factors often contain IDRs that facilitate interactions between the transcription factor and a variety of cofactors, chromatin remodelers, and other flavors of TAP (Frietze and Farnham 2011). These protein–protein interactions facilitate localization within a hub and are therefore critical for many aspects of transcription factor function. For instance, despite not having a direct role in DNA binding, IDRs in the Saccharomyces cerevisiae transcription factors Yap1 and Msn2 were nevertheless critical determinants of which of the various DNA sequence motifs each transcription factor bound in vivo (Brodsky et al. 2020). One attractive model to explain these observations is that the IDRs are required to localize transcription factors into a hub. By analogy, IDRs serve as a postal code that directs the transcription factor to one of the many nuclear subcompartments. Once in the transcriptional regulatory hub, the DNA-binding domains of the transcription factor identify the subset of high-affinity targets in DNA that are accessible to the hub (Bhat et al. 2021). This model is attractive because it explains how transcription factors identify their complement of DNA binding sites in organisms with large genomes more quickly than can be explained under more simplistic diffusion models (Jana et al. 2021).
Like transcription factors, core transcription proteins, including RNA Pol II, mediator, general transcription factors, and the coactivators and corepressors that reorganize chromatin, also have IDRs or other domains that facilitate hub membership. RNA Pol II has several domains and macromolecule associations that could be involved. First, the largest subunit of Pol II (RPB1) contains a C-terminal heptad repeat domain that is an IDR that contributes to macromolecular clustering (Banani et al. 2017; Boija et al. 2018; Cho et al. 2018; Chong et al. 2018; Sabari et al. 2018; Strom et al. 2018). Second, the nascent RNA emerging from the Pol II exit channel may also contribute to clustering. RNA can facilitate hub membership either through the m6A RNA modification (Barutcu et al. 2019; Nair et al. 2019) or by interactions between RNA and transcription factors, mediator, NELF, or other transcriptional coactivators (Sigova et al. 2015; Vos et al. 2016; Bose et al. 2017; Oksuz et al. 2023). Third, reports indicate that secondary structures like G-quadruplexes or R-loops can link eRNAs to a target promoter (Hegyi 2015; Akiki et al. 2024). Like Pol II, the mediator complex also forms clusters both on its own (Zamudio et al. 2019) and in conjunction with Pol II via networks of interactions between tyrosine and proline amino acids (Flores-Solis et al. 2023). Similar interactions underlie the recruitment of nucleosome remodelers, including the BAF complex (Patil et al. 2023), BRD4 (Sabari et al. 2018), and components of the Pol II preinitiation complex (PIC) (Wei et al. 2020).
Given the importance of TAPs in forming both hubs and/ or a structural bridge, it stands to reason that these proteins should play an important role in establishing enhancer–promoter interactions. Indeed, recent studies using high-resolution chromosome conformation capture (3C) methods have found that depletion of both Pol II (Barshad et al. 2023; Zhang et al. 2023) and mediator (Kagey et al. 2010; Ramasamy et al. 2023) impact enhancer–promoter contact frequency. Likewise, multiple lines of evidence indicate that transcription factors are also important for shaping enhancer–promoter interactions. Changes in transcription factor binding between different conditions are associated with changes in the contact frequency between enhancer–promoter pairs (Vakoc et al. 2005; Grubert et al. 2015; Rubin et al. 2017; Johanson et al. 2018; Ray et al. 2019; Portillo-Ledesma et al. 2023). Moreover, recently developed Micro-C variants that allow single-base resolution for loop discovery have found that loop ends are frequently adjacent to transcription factor binding sites (Hua et al. 2021). Others have found that chromatin is organized into smaller, localized microcompartments, which may be direct observations of transcriptional hubs (Rowley et al. 2017; Goel et al. 2023). As transcription factors have a key role in establishing the chromatin environment characteristic of an enhancer, these associations between transcription factors and enhancer–promoter contract are likely to be causal.
Collectively, these studies demonstrate the importance of TAPs in mediating enhancer–promoter contacts and communication.
CTCF and cohesin: indirect players in enhancer–promoter loop formation
CTCF and cohesin are two proteins that have long been postulated to be involved in a structural bridge connecting enhancer and promoter regions (Yin and Wang 2014; Kim and Shiekhattar 2015; Petrenko et al. 2016). However, emerging evidence indicates that the role both protein complexes play in transcription and enhancer–promoter loop formation is indirect.
CTCF and cohesin are key molecules in the formation of topological associated domains (TADs) through a molecular process called loop extrusion (Sanborn et al. 2015; Fudenberg et al. 2016). Cohesin is a protein complex that forms a ring structure around DNA (Merkenschlager and Nora 2016). Once the ring is formed, cohesin has an integrated motor that pulls DNA through the ring by consuming ATP for energy (Ganji et al. 2018; Vian et al. 2018). As DNA is pulled through the cohesin complex, two points of DNA are held by cohesin in very close proximity, forming a loop that can be resolved using both 3C and microscopy-based approaches. Because of these loops and the continual nature of the extrusion process, this model earned the name “loop extrusion.”
CTCF is a highly conserved protein with a zinc finger domain that binds DNA in a sequence-specific manner and changes the dynamics of loop extrusion near its binding site. Early models postulated that CTCF blocked loop extrusion through a steric mechanism by capturing the cohesin complex through protein–protein interactions, a bit like a cork fits into the neck of a bottle (Rao et al. 2014; Tang et al. 2015). More recent work has argued that CTCF blocks cohesin by causing tension in the DNA polymer that is incompatible with extrusion past the CTCF binding site (Davidson et al. 2023). Regardless of the mechanism, all authors agree that CTCF limits loop extrusion in a directional manner, such that the extruding complex is prevented from extending past the CTCF binding site only in one orientation.
Loop extrusion involves the dynamic activity of the cohesin complex over relatively long timescales. Once loaded onto DNA, cohesin can remain associated with a locus for extended periods while continuously extruding DNA to form loops. Direct estimates of residence time are available when cohesin is interacting with CTCF, where it remains stably bound for ∼30 min (Hansen et al. 2017). Halting the process of loop extrusion through the degradation of RAD21, a key protein in the cohesin complex, results in the near immediate loss of most TADs, based on in situ Hi-C data (Rao et al. 2017), as the loops held together by cohesin diffuse apart.
Loop extrusion has several indirect impacts on enhancer–promoter loop formation. First, cumulative evidence from both sides of a raging scientific debate indicate that TADs boundaries reduce, but do not completely eliminate, the effect of an enhancer on a target promoter (for a more detailed summary of literature on this topic, see Symmons et al. 2014; for review, see Cavalheiro et al. 2021; Zuin et al. 2022). Second, loop extrusion may also play a role in increasing the chances that distally located enhancer–promoter pairs will find one another in the crowded nucleus. Promoters are often located near the end of a TAD, and these TAD boundaries are often associated with an in situ Hi-C pattern known as a “stripe,” which represents the promoter forming high frequency interactions across the TAD (Vian et al. 2018). These frequent interactions effectively change the problem of enhancer–promoter discovery from a three-dimensional search in the nucleus to a guided one-dimensional search in which loop extrusion assists the promoter in interacting with enhancers within the stripe. Indeed, NIPBL cohesin loading factor (NIPBL), encoded by Nipbl, loads the cohesin complex onto DNA near promoters and enhancers (Kagey et al. 2010), facilitating this mechanism. Finally, even when promoters are not directly adjacent to the end of the TAD, the process of loop extrusion could nevertheless constrain the three-dimensional diffusion to a smaller space, by preventing diffusion further apart than the current constraints placed by the loop. Indeed, these mechanisms may explain why cohesin depletion has a larger impact on enhancer–promoter pairs located further from one another along the chromatin fiber (Guckelberger et al. 2024).
Despite indirect effects, however, the evidence suggests that loop extrusion does not play a direct role in enhancer–promoter loop formation. The primary evidence for this point is the development of degron systems that rapidly deplete RAD21 (Rao et al. 2017). Following 6 h of RAD21 depletion, both TADs and CTCF-cohesin-dependent loop domains were lost (Rao et al. 2017). Surprisingly, however, measurements of gene transcription using PRO-seq found that transcriptional changes were relatively small in magnitude (less than about 1.5-fold) at the same 6 h of RAD21 depletion (Rao et al. 2017). This suggests a surprisingly modest impact of cohesin on transcriptional regulation.
Transcription also feeds back to impact loop extrusion in several ways. First, cohesin loading is impacted by depletion of both Pol II and mediator (Zhang et al. 2021; Ramasamy et al. 2023), consistent with the aforementioned importance of enhancer–promoter DNA for NIPBL binding (Kagey et al. 2010). Additionally, RNA Pol II is a large protein complex that prevents cohesin's extrusion past an engaged Pol II (Banigan et al. 2023; Zhang et al. 2023). As Pol II takes ∼5–10 min to transcribe a median-length gene (assuming an elongation rate of ∼1.5–4 kb/min) (Danko et al. 2013; Jonkers et al. 2014), the active elongation complex can push the cohesin machinery across tens of thousands of bases of DNA for timescales that are on the same order of magnitude as the interaction between cohesin and CTCF.
These lines of evidence indicate that cohesin and CTCF are unlikely to form a stable structural bridge whose primary function is to facilitate enhancer–promoter interactions. Instead, both cohesin and CTCF play a primary role in loop extrusion, which exerts indirect effects on transcriptional hubs or loops.
Distances between enhancer–promoter DNA during interactions
A key difference between the structural bridge and hub models concerns the distance between enhancer and promoter DNA. The structural bridge model predicts that the enhancer and promoter come into close physical proximity, such that the distance between them can be spanned by a bridge formed through protein–protein interactions. However, recent work using imaging methods has called these relatively short distances between interacting DNA into question.
Several of the key observations that led the community to challenge the structural bridge model were imaging studies that measured the distance separating enhancer–promoter pairs in a variety of model systems. These studies revealed that enhancers and promoters are frequently on the order of hundreds of nanometers apart, even during transcriptional activation (Chen et al. 2018; Alexander et al. 2019; Benabdallah et al. 2019). In one particularly interesting example, the distance between the sonic hedgehog (Shh) promoter and a developmental enhancer increased following Shh gene activation (Benabdallah et al. 2019). These long distances, if estimated correctly, are almost certainly not compatible with the formation of a physical protein–protein bridge. However, numerous technical issues make it challenging to measure precise distances using imaging methods (as noted below).
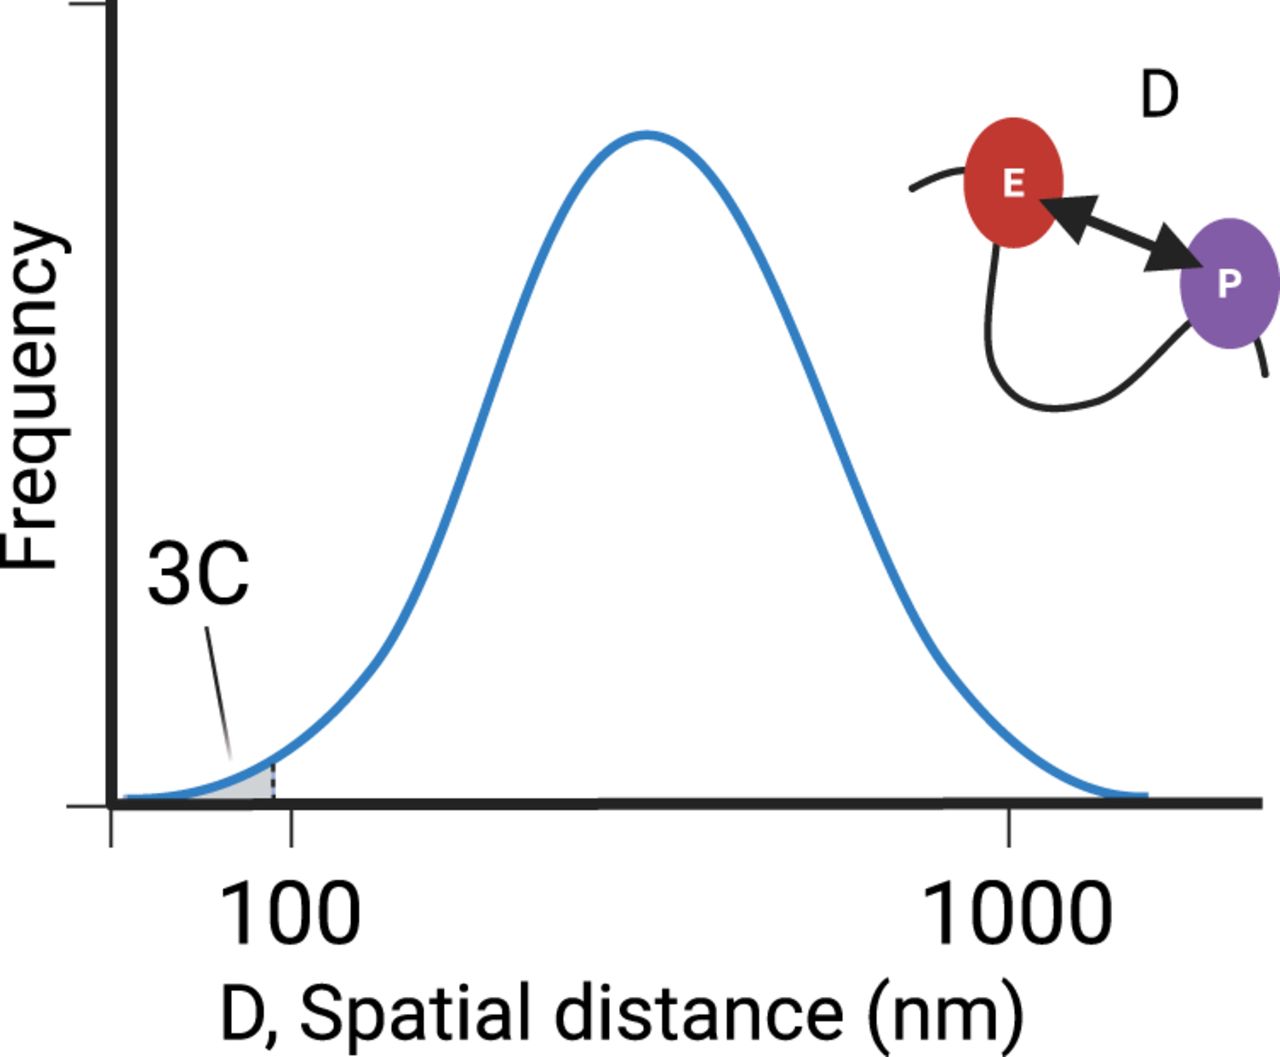
In contrast to the results of imaging studies, 3C-based genomic studies suggest that enhancers and promoters come into close proximity in the nucleus. 3C-based methods such as in situ Hi-C (Rao et al. 2014) and Micro-C (Hsieh et al. 2020; Krietenstein and Rando 2022) measure the frequency of ligation between DNA sequences that are close together in 3D space. These 3C methods are only sensitive to the tail of the distribution of molecular distances between two loci, because they only capture interactions that are close enough for the free ends of DNA to be cross-linked and ligated to one another (Fig. 3; Fudenberg and Imakaev 2017). The exact proximity between 3C-based ligation events remains unknown (see discussion below).
Enhancer promoter distance measurements. The probability density function (PDF) represents the distribution of distances between candidate promoter–enhancer pairs. Imaging methods can theoretically measure the entire distribution, whereas 3C-based methods only measure the lower tail. Distribution drawn based on data from Chen et al. (2018). (Created in BioRender. Danko, C. [2025] https://www.biorender.com)
Multiple studies demonstrate associations between 3C contact frequency and enhancer–promoter function that appear to indicate that DNA sequences come close together at some point during transcriptional activation. Many studies have now shown that 3C methods can predict the functional impact of enhancers on a target gene (Fulco et al. 2019; Ray et al. 2019; Zuin et al. 2022; Barshad et al. 2023). Likewise, changes in either the composition or frequency of enhancer–promoter loop interactions are associated with the activation or repression of target promoters (Rubin et al. 2017; Mateo et al. 2019; Beagan et al. 2020; Titus et al. 2024). One such study introduced an elegant system that ectopically creates an enhancer–promoter loop interaction in the presence of blue light, without obvious changes in activity of transcription factors or other proteins associated with the enhancer or promoter (Kim et al. 2019). This study noted a small but significant increase in the expression of a target gene after enhancer–promoter loop formation (Kim et al. 2019), indicating that loops likely cause increased target gene expression.
Such perturbation experiments, combined with newer and higher-resolution 3C variants, have shown that functionally active enhancer–promoter pairs have higher contact frequencies compared with nonfunctional pairs and that these differences are most prominent close to the enhancer and promoter. A recent study found that enhancers that elicit a functional impact on the expression of its target promoter had ∼30% higher contact frequency compared with enhancer–promoter pairs with no evidence of functional impact (Barshad et al. 2023). Moreover, by using nucleosome resolution Micro-C data, the authors showed that differences between functional and nonfunctional pairs were most prominent between the first two nucleosomes (+1 and +2) of the enhancer and promoter, adjacent to the transcription start site (Barshad et al. 2023). These results suggest that enhancers come very close to their target promoters during at least one point of enhancer activation.
It is important to note that relatively close enhancer–promoter distances do not necessarily require a structural bridge model. Although some proponents of the hub model have argued that enhancers and promoters may not be able to come close together owing to issues of molecular crowding within a hub (Lim and Levine 2021), we do not see any strong theoretical reasons to believe that enhancer–promoter DNA must remain far apart from one another. Rather, the results of 3C studies discussed above may reflect the formation of transcriptional hubs in which some functional enhancer–promoter pairs spend a small amount of time at shorter distances than measured by imaging studies.
There are several other factors that complicate distinguishing the hub and bridge models. First, imaging studies have observed considerable variability in the diameter of transcription factories across distinct loci (Iborra et al. 1996; Eskiw et al. 2008; Eskiw and Fraser 2011), potentially raising the prospect that the few loci measured in microscopy studies are uncharacteristically large. Second, microscopy studies capture the average interaction distances occurring within a larger hub but miss interactions occurring on a transient physical bridge, which may be more directly related to a transcriptional burst (see additional discussion of that matter below). Third, it is difficult to determine how large a structural bridge would have to be based on current data. Mediator is a remarkably large protein complex: CryoEM structures show the distance from DNA bound by the Pol II PIC to the most distant edge of the mediator complex is ∼20 nm, whereas the whole structure spans at least 30 nm at its widest point (Rengachari et al. 2021). Moreover, because enhancers are transcribed, it is plausible that separate Pol II and mediator complexes are present at enhancers and promoters, which could potentially increase the distance spanned by a structural bridge considerably further. Finally, although Pol II and mediator are outstanding candidates for a structural bridge owing to their importance for transcription, it is also possible that additional proteins may be involved in these interactions that extend a structural bridge further than anticipated.
Dynamics of enhancer–promoter interactions
Early versions of the structural bridge model envisioned a physical bridge that was stable for relatively long durations. In contrast, however, multiple lines of evidence indicate that enhancer–promoter interactions are extremely transient. One study used a piggyBac transposon system to place a single enhancer–promoter pair in hundreds of different relative positions and orientations. Kinetic models best matched these experimental observations when enhancer–promoter interactions occurred much faster than other regulatory steps, typically lasting for a timescale of seconds or less (Zuin et al. 2022). More recently, live-cell imaging systems simultaneously tracking the position of the Sox2 gene, its enhancer, and a Pol II hub showed that Sox2 burst size increased when all three units are transiently close together, relative to their typical distances, for as little as just a few imaging frames (Du et al. 2024). We note that although the absolute distances observed by Du et al. (2024) during transcriptional bursts are large, these distances could be influenced by the challenges designing and preparing probes for imaging studies that plague all imaging approaches (discussed below).
Live cell imaging measurements show considerable variation in how long-lived different transcription hubs are in the nucleus. Measurements of Pol II cluster residence times have found a mean of ∼5–12 sec (Cisse et al. 2013; Cho et al. 2016; Du et al. 2024); however, some clusters, including those located near stronger “super-enhancers,” persist for >2 min (Cho et al. 2016; Du et al. 2024). Studies using 3C-based measurements also find evidence for considerable variation in contact frequency across the genome. Loci located near highly active enhancers, like super-enhancers in the MYC locus, have much higher 3C contact frequency than the average enhancer–promoter pair (Barshad et al. 2023).
Taken together, current literature supports a “kiss-and-go” model, in which most enhancer–promoter interactions are transient and sufficient to induce a transcriptional burst.
Reconciling distance and time measurements between 3C and imaging methods
The results from imaging and genomic studies appear challenging to reconcile at first glance. It is important to keep in mind precisely what each approach measures, as well as the technical limitations, when interpreting results. In this section, we summarize the most fundamental limitations of 3C methods before discussing limitations in imaging approaches. We close with how these technical limitations influence our understanding of the distance and dynamics of enhancer–promoter interaction.
The first challenge with interpreting 3C methods is that they do not directly measure distance between interacting loci. Rather, 3C methods can detect only the contacts between DNA sequences in very close physical apposition, at the lower tail of the distribution two loci might occupy in cells (Fig. 3). How far apart two DNA sequences need to be for detection by 3C methods is not known precisely, but it may be possible to obtain rough estimates. The most conservative model, which assumes that contacts can be obtained if N-terminal nucleosome tails are cross-linked, will still only detect DNA closer than 100 nm. However, most modern Hi-C and Micro-C data sets use in situ ligation protocols performed in intact nuclei. Performing ligation reactions in situ likely makes the distance less sensitive to more distal contacts for two reasons: First, many blunt ends are available for ligation, resulting in competition for ligation events that favor the detection of more accessible, shorter contacts. Second, a network of cross-links likely prevents diffusion from ligating more distal DNA compared with older Hi-C protocols that perform ligations in dilute conditions. Taken together, these considerations most likely mean that DNA contacts observed in a 3C method are much closer than 100 nm. Although the effects of cross-linking on nuclear architecture remains an important caveat (see discussion below), it is possible that distances may be on the order of tens of nanometers. Candidate contacts between loci further than this distance threshold would not be detected in a 3C library.
A second limitation of 3C methods is that contact maps reflect a time-weighted average of interactions over a population of cells and 3D chromatin conformations adopted by two loci. These averages include both times when enhancer–promoter communication is occurring and when loci lie dormant. Above, we note reasonably strong evidence that enhancer–promoter residence times are relatively short. Such short residence times may explain why the effect of enhancer–promoter contacts is a relatively minor component of the signal obtained in 3C maps.
Although imaging studies can directly measure distance without a bias for shorter interactions, a variety of technical factors complicate distance measurements by imaging methods. Imaging studies require probes to measure DNA. Often probes hybridize a DNA carrying a fluorescent tag to nuclear DNA to identify the position of the enhancer and/or promoter. These probes often lie thousands of bases from the target regulatory region. Moreover, in many studies the regulatory region itself is coarsely defined, often as a ∼1–20 kb window that contains one or more enhancer units. The placement of the probes and the coarse-grained resolution of the enhancer unit make it challenging to interpret distance even in a microscopy experiment. Why? The main reason is that DNA is a long polymer: 1000 bp of naked DNA stretches ∼340 nm. Even considering that chromatin may be compacted by an order of magnitude in a living nucleus, a probe located a few kilobases from the precise ∼110 bp active unit of an enhancer (or promoter) could still lie tens to hundreds of nanometers away from its intended target. The potential for error further increases as investigators adapt these techniques to measure the distance between two (or more) loci, each of which has its own measurement error. These experimental difficulties make measuring precise enhancer–promoter distances challenging, and they require extreme care to be taken in the interpretation of the resulting distances.
Another important challenge shared by many imaging and most 3C studies is that current approaches rely on cross-linking with formaldehyde. Although ostensibly this step is devised to preserve the structure of cells through highly disruptive enzymatic steps, it has been widely reported to alter protein binding and nuclear structure in ways that may obscure accurate measurements (for a detailed explanations, see Belmont 2014; Gavrilov et al. 2015). To investigate the impact of formaldehyde cross-linking on chromatin structures, new methods have been introduced that omit or substantially change fixation techniques in 3C assays. First, the introduction of in situ Hi-C in 2014 introduced a new protocol in which ligation is performed prior to fragmenting nuclei. Performing in situ Hi-C or 4C without formaldehyde fixation generally recovers the same features as full Hi-C maps generated using more conventional cell preparation strategies (Rao et al. 2014; Brant et al. 2016). Second, DamC, an assay that measures DNA proximity by recruiting a DNA methylase to a target anchor (Redolfi et al. 2019), omits both formaldehyde cross-linking and ligation, yet resolves very similar structures as 4C and Hi-C. Third, recent studies introduced alternative cross-linkers that directly cross-link DNA to DNA (You et al. 2021) and recovered the same features identified using Hi-C. Overall, these approaches generally provide support for the structures first observed using conventional Hi-C data, including TADs and promoter–enhancer loops. Although these initial experiments appear to confirm structures identified using Hi-C, continuing to develop creative new methods that provide alternatives to formaldehyde cross-linking is an essential next step for the continued development of the field.
These considerations, along with the relatively short residence times of communication, make us unable to determine precisely how far apart enhancer–promoter pairs lie during transcriptional activation. However, associations between enhancer–promoter function and 3C contact frequency seem incompatible with models in which distances are larger than ∼100 nm during the entire transcriptional activation cycle. These findings are potentially compatible with the formation of a transitory structural bridge model and imply that distances between functionally interacting enhancers and promoters may not be as large as some proponents of the hub model would expect. Nevertheless, it remains challenging to distinguish between a structural bridge and variants of hub models where direct contact is important.
Future outlook and open questions
Although significant progress has been made in understanding the dynamics, distances, and models of enhancer–promoter communication, several key questions and debates remain unresolved. First, when during the transcription activation cycle does communication happen? The prevailing model suggests that communication occurs during a transcriptional burst; however, it is also possible that communication immediately precedes a burst, and interactions are released before the burst completes. Moreover, just as enhancer–promoter interactions can influence the transcription cycle, transcription can also influence contacts, as seen by recent studies showing that Pol II in general (Zhang et al. 2023), and even Pol II pausing (Barshad et al. 2023; Penagos-Puig et al. 2023), can affect enhancer–promoter interactions. Determining when communication occurs during the transcription activation cycle could provide critical insights into the regulation of gene expression and the mechanisms underlying transcriptional bursts. Second, do interactions better resemble a structural bridge or hub? The two models are not mutually exclusive. Although the literature appears to provide more and more support for hubs of some variety, evidence also suggests that enhancer–promoter pairs come into close apposition, and it remains possible that hubs support the formation of a transient protein–protein bridge during transcriptional activation. Understanding how elements of the structural bridge and hub models might coexist or function together could reshape our understanding of the molecular mechanisms governing enhancer–promoter communication.
These open questions highlight the urgent need for new techniques that can more accurately capture the spatial and temporal dynamics of enhancer–promoter interactions. Existing methods are not adequate for measuring enhancer–promoter communication. Imaging approaches risk changing the system they are measuring, probing neighboring DNA and thereby reducing accuracy, or ignoring rare events at the tail end of a distance distribution. Conversely, 3C methods do not directly measure distances, and short residence times ensure enhancer–promoter communication is a minor part of 3C signal. These considerations highlight the need for new methods that more precisely measure enhancer–promoter interactions in real time. Potential approaches include advanced live-cell imaging, innovative single-molecule techniques, or refinements to 3C-based methods that directly measure distances or specifically target loci while in active states. These new methods will be essential for advancing our understanding of enhancer-mediated gene regulation.
Competing interest statement
The authors declare no competing interests.
Acknowledgments
We thank members of the Danko laboratory, John Lis, Abdullah Ozer, James Lewis, and many other scientists at Cornell and around the world for thoughtful conversations that have shaped our thoughts on this topic. This work was supported by the National Human Genome Research Institute (R01-HG010346).
Notes
[1] Article and publication date are at https://www.genome.org/cgi/doi/10.1101/gr.278389.123.
References
- ↵Akiki RM, Cornbrooks RG, Magami K, Greige A, Snyder KK, Wood DJ, Herrington MC, Mace P, Blidy K, Koike N, 2024. A long noncoding eRNA forms R-loops to shape emotional experience-induced behavioral adaptation. Science 386: 1282–1289. 10.1126/science.adp1562
- ↵Alexander JM, Guan J, Li B, Maliskova L, Song M, Shen Y, Huang B, Lomvardas S, Weiner OD. 2019. Live-cell imaging reveals enhancer-dependent Sox2 transcription in the absence of enhancer proximity. eLife 8: e41769. 10.7554/eLife.41769
- ↵Andersson R, Sandelin A. 2020. Determinants of enhancer and promoter activities of regulatory elements. Nat Rev Genet 21: 71–87. 10.1038/s41576-019-0173-8
- ↵Andersson R, Gebhard C, Miguel-Escalada I, Hoof I, Bornholdt J, Boyd M, Chen Y, Zhao X, Schmidl C, Suzuki T, 2014. An atlas of active enhancers across human cell types and tissues. Nature 507: 455–461. 10.1038/nature12787
- ↵Andersson R, Sandelin A, Danko CG. 2015. A unified architecture of transcriptional regulatory elements. Trends Genet 31: 426–433. 10.1016/j.tig.2015.05.007
- ↵Antonellis A, Bennett WR, Menheniott TR, Prasad AB, Lee-Lin S-Q, NISC Comparative Sequencing Program, Green ED, Paisley D, Kelsh RN, Pavan WJ, 2006. Deletion of long-range sequences at Sox10 compromises developmental expression in a mouse model of Waardenburg–Shah (WS4) syndrome. Hum Mol Genet 15: 259–271. 10.1093/hmg/ddi442
- ↵Banani SF, Lee HO, Hyman AA, Rosen MK. 2017. Biomolecular condensates: organizers of cellular biochemistry. Nat Rev Mol Cell Biol 18: 285–298. 10.1038/nrm.2017.7
- ↵Banerji J, Rusconi S, Schaffner W. 1981. Expression of a beta-globin gene is enhanced by remote SV40 DNA sequences. Cell 27: 299–308. 10.1016/0092-8674(81)90413-X
- ↵Banigan EJ, Tang W, van den Berg AA, Stocsits RR, Wutz G, Brandão HB, Busslinger GA, Peters J-M, Mirny LA. 2023. Transcription shapes 3D chromatin organization by interacting with loop extrusion. Proc Natl Acad Sci 120: e2210480120. 10.1073/pnas.2210480120
- ↵Barshad G, Lewis JJ, Chivu AG, Abuhashem A, Krietenstein N, Rice EJ, Ma Y, Wang Z, Rando OJ, Hadjantonakis A-K, 2023. RNA polymerase II dynamics shape enhancer–promoter interactions. Nat Genet 55: 1370–1380. 10.1038/s41588-023-01442-7
- ↵Barski A, Cuddapah S, Cui K, Roh T-Y, Schones DE, Wang Z, Wei G, Chepelev I, Zhao K. 2007. High-resolution profiling of histone methylations in the human genome. Cell 129: 823–837. 10.1016/j.cell.2007.05.009
- ↵Barutcu AR, Blencowe BJ, Rinn JL. 2019. Differential contribution of steady-state RNA and active transcription in chromatin organization. EMBO Rep 20: e48068. 10.15252/embr.201948068
- ↵Beagan JA, Pastuzyn ED, Fernandez LR, Guo MH, Feng K, Titus KR, Chandrashekar H, Shepherd JD, Phillips-Cremins JE. 2020. Three-dimensional genome restructuring across timescales of activity-induced neuronal gene expression. Nat Neurosci 23: 707–717. 10.1038/s41593-020-0634-6
- ↵Beck JS. 1961. Variations in the morphological patterns of “autoimmune” nuclear fluorescence. Lancet 277: 1203–1205. 10.1016/S0140-6736(61)91944-4
- ↵Belmont AS. 2014. Large-scale chromatin organization: the good, the surprising, and the still perplexing. Curr Opin Cell Biol 26: 69–78. 10.1016/j.ceb.2013.10.002
- ↵Belmont AS. 2022. Nuclear compartments: an incomplete primer to nuclear compartments, bodies, and genome organization relative to nuclear architecture. Cold Spring Harb Perspect Biol 14: a041268. 10.1101/cshperspect.a041268
- ↵Benabdallah NS, Williamson I, Illingworth RS, Kane L, Boyle S, Sengupta D, Grimes GR, Therizols P, Bickmore WA. 2019. Decreased enhancer-promoter proximity accompanying enhancer activation. Mol Cell 76: 473–484.e7. 10.1016/j.molcel.2019.07.038
- ↵Benoist C, Chambon P. 1981. In vivo sequence requirements of the SV40 early promoter region. Nature 290: 304–310. 10.1038/290304a0
- ↵Bhat P, Honson D, Guttman M. 2021. Nuclear compartmentalization as a mechanism of quantitative control of gene expression. Nat Rev Mol Cell Biol 22: 653–670. 10.1038/s41580-021-00387-1
- ↵Bialek W, Gregor T, Tkačik G. 2019. Action at a distance in transcriptional regulation. arXiv:1912.08579 [q-bio.SC]. 10.48550/arXiv.1912.08579
- ↵Boija A, Klein IA, Sabari BR, Dall'Agnese A, Coffey EL, Zamudio AV, Li CH, Shrinivas K, Manteiga JC, Hannett NM, 2018. Transcription factors activate genes through the phase-separation capacity of their activation domains. Cell 175: 1842–1855.e16. 10.1016/j.cell.2018.10.042
- ↵Bose DA, Donahue G, Reinberg D, Shiekhattar R, Bonasio R, Berger SL. 2017. RNA binding to CBP stimulates histone acetylation and transcription. Cell 168: 135–149.e22. 10.1016/j.cell.2016.12.020
- ↵Brant L, Georgomanolis T, Nikolic M, Brackley CA, Kolovos P, van Ijcken W, Grosveld FG, Marenduzzo D, Papantonis A. 2016. Exploiting native forces to capture chromosome conformation in mammalian cell nuclei. Mol Syst Biol 12: 891. 10.15252/msb.20167311
- ↵Brodsky S, Jana T, Mittelman K, Chapal M, Kumar DK, Carmi M, Barkai N. 2020. Intrinsically disordered regions direct transcription factor in vivo binding specificity. Mol Cell 79: 459–471.e4. 10.1016/j.molcel.2020.05.032
- ↵Buckley MS, Kwak H, Zipfel WR, Lis JT. 2014. Kinetics of promoter Pol II on Hsp70 reveal stable pausing and key insights into its regulation. Genes Dev 28: 14–19. 10.1101/gad.231886.113
- ↵Cavalheiro GR, Pollex T, Furlong EE. 2021. To loop or not to loop: What is the role of TADs in enhancer function and gene regulation? Curr Opin Genet Dev 67: 119–129. 10.1016/j.gde.2020.12.015
- ↵Chen H, Levo M, Barinov L, Fujioka M, Jaynes JB, Gregor T. 2018. Dynamic interplay between enhancer–promoter topology and gene activity. Nat Genet 50: 1296–1303. 10.1038/s41588-018-0175-z
- ↵Cho W-K, Jayanth N, English BP, Inoue T, Andrews JO, Conway W, Grimm JB, Spille J-H, Lavis LD, Lionnet T, 2016. RNA polymerase II cluster dynamics predict mRNA output in living cells. eLife 5: e13617. 10.7554/eLife.13617
- ↵Cho W-K, Spille J-H, Hecht M, Lee C, Li C, Grube V, Cisse II. 2018. Mediator and RNA polymerase II clusters associate in transcription-dependent condensates. Science 361: 412–415. 10.1126/science.aar4199
- ↵Choi OR, Engel JD. 1988. Developmental regulation of beta-globin gene switching. Cell 55: 17–26. 10.1016/0092-8674(88)90005-0
- ↵Chong S, Dugast-Darzacq C, Liu Z, Dong P, Dailey GM, Cattoglio C, Heckert A, Banala S, Lavis L, Darzacq X, 2018. Imaging dynamic and selective low-complexity domain interactions that control gene transcription. Science 361: eaar2555. 10.1126/science.aar2555
- ↵Cisse II, Izeddin I, Causse SZ, Boudarene L, Senecal A, Muresan L, Dugast-Darzacq C, Hajj B, Dahan M, Darzacq X. 2013. Real-time dynamics of RNA polymerase II clustering in live human cells. Science 341: 664–667. 10.1126/science.1239053
- ↵Core LJ, Martins AL, Danko CG, Waters CT, Siepel A, Lis JT. 2014. Analysis of nascent RNA identifies a unified architecture of initiation regions at mammalian promoters and enhancers. Nat Genet 46: 1311–1320. 10.1038/ng.3142
- ↵Creyghton MP, Cheng AW, Welstead GG, Kooistra T, Carey BW, Steine EJ, Hanna J, Lodato MA, Frampton GM, Sharp PA, 2010. Histone H3K27ac separates active from poised enhancers and predicts developmental state. Proc Natl Acad Sci 107: 21931–21936. 10.1073/pnas.1016071107
- ↵Danko CG, Hah N, Luo X, Martins AL, Core L, Lis JT, Siepel A, Kraus WL. 2013. Signaling pathways differentially affect RNA polymerase II initiation, pausing, and elongation rate in cells. Mol Cell 50: 212–222. 10.1016/j.molcel.2013.02.015
- ↵Dao LTM, Galindo-Albarrán AO, Castro-Mondragon JA, Andrieu-Soler C, Medina-Rivera A, Souaid C, Charbonnier G, Griffon A, Vanhille L, Stephen T, 2017. Genome-wide characterization of mammalian promoters with distal enhancer functions. Nat Genet 49: 1073–1081. 10.1038/ng.3884
- ↵Davidson IF, Barth R, Zaczek M, van der Torre J, Tang W, Nagasaka K, Janissen R, Kerssemakers J, Wutz G, Dekker C, 2023. CTCF is a DNA-tension-dependent barrier to cohesin-mediated loop extrusion. Nature 616: 822–827. 10.1038/s41586-023-05961-5
- ↵De Santa F, Barozzi I, Mietton F, Ghisletti S, Polletti S, Tusi BK, Muller H, Ragoussis J, Wei C-L, Natoli G. 2010. A large fraction of extragenic RNA pol II transcription sites overlap enhancers. PLoS Biol 8: e1000384. 10.1371/journal.pbio.1000384
- ↵Di Giammartino DC, Polyzos A, Apostolou E. 2020. Transcription factors: building hubs in the 3D space. Cell Cycle 19: 2395–2410. 10.1080/15384101.2020.1805238
- ↵Du M, Stitzinger SH, Spille J-H, Cho W-K, Lee C, Hijaz M, Quintana A, Cissé II. 2024. Direct observation of a condensate effect on super-enhancer controlled gene bursting. Cell 187: 331–344.e17. 10.1016/j.cell.2023.12.005
- ↵Engreitz JM, Haines JE, Perez EM, Munson G, Chen J, Kane M, McDonel PE, Guttman M, Lander ES. 2016. Local regulation of gene expression by lncRNA promoters, transcription and splicing. Nature 539: 452–455. 10.1038/nature20149
- ↵Eskiw CH, Fraser P. 2011. Ultrastructural study of transcription factories in mouse erythroblasts. J Cell Sci 124: 3676–3683. 10.1242/jcs.087981
- ↵Eskiw CH, Rapp A, Carter DRF, Cook PR. 2008. RNA polymerase II activity is located on the surface of protein-rich transcription factories. J Cell Sci 121: 1999–2007. 10.1242/jcs.027250
- ↵Flores-Solis D, Lushpinskaia IP, Polyansky AA, Changiarath A, Boehning M, Mirkovic M, Walshe J, Pietrek LM, Cramer P, Stelzl LS, 2023. Driving forces behind phase separation of the carboxy-terminal domain of RNA polymerase II. Nat Commun 14: 5979. 10.1038/s41467-023-41633-8
- ↵Frietze S, Farnham PJ. 2011. Transcription factor effector domains. Subcell Biochem 52: 261–277. 10.1007/978-90-481-9069-0_12
- ↵Fudenberg G, Imakaev M. 2017. FISH-ing for captured contacts: towards reconciling FISH and 3C. Nat Methods 14: 673–678. 10.1038/nmeth.4329
- ↵Fudenberg G, Imakaev M, Lu C, Goloborodko A, Abdennur N, Mirny LA. 2016. Formation of chromosomal domains by loop extrusion. Cell Rep 15: 2038–2049. 10.1016/j.celrep.2016.04.085
- ↵Fulco CP, Nasser J, Jones TR, Munson G, Bergman DT, Subramanian V, Grossman SR, Anyoha R, Doughty BR, Patwardhan TA, 2019. Activity-by-contact model of enhancer-promoter regulation from thousands of CRISPR perturbations. Nat Genet 51: 1664–1669. 10.1038/s41588-019-0538-0
- ↵Ganji M, Shaltiel IA, Bisht S, Kim E, Kalichava A, Haering CH, Dekker C. 2018. Real-time imaging of DNA loop extrusion by condensin. Science 360: 102–105. 10.1126/science.aar7831
- ↵Gasperini M, Hill AJ, McFaline-Figueroa JL, Martin B, Kim S, Zhang MD, Jackson D, Leith A, Schreiber J, Noble WS, 2019. A genome-wide framework for mapping gene regulation via cellular genetic screens. Cell 176: 377–390.e19. 10.1016/j.cell.2018.11.029
- ↵Gavrilov A, Razin SV, Cavalli G. 2015. In vivo formaldehyde cross-linking: It is time for black box analysis. Brief Funct Genomics 14: 163–165. 10.1093/bfgp/elu037
- ↵Ghiasvand NM, Rudolph DD, Mashayekhi M, Brzezinski JAIV, Goldman D, Glaser T. 2011. Deletion of a remote enhancer near ATOH7 disrupts retinal neurogenesis, causing NCRNA disease. Nat Neurosci 14: 578–586. 10.1038/nn.2798
- ↵Goel VY, Huseyin MK, Hansen AS. 2023. Region capture micro-C reveals coalescence of enhancers and promoters into nested microcompartments. Nat Genet 55: 1048–1056. 10.1038/s41588-023-01391-1
- ↵Grossman SR, Engreitz J, Ray JP, Nguyen TH, Hacohen N, Lander ES. 2018. Positional specificity of different transcription factor classes within enhancers. Proc Natl Acad Sci 115: E7222–E7230. 10.1073/pnas.1804663115
- ↵Grubert F, Zaugg JB, Kasowski M, Ursu O, Spacek DV, Martin AR, Greenside P, Srivas R, Phanstiel DH, Pekowska A, 2015. Genetic control of chromatin states in humans involves local and distal chromosomal interactions. Cell 162: 1051–1065. 10.1016/j.cell.2015.07.048
- ↵Gruss P, Dhar R, Khoury G. 1981. Simian virus 40 tandem repeated sequences as an element of the early promoter. Proc Natl Acad Sci 78: 943–947. 10.1073/pnas.78.2.943
- ↵Guckelberger P, Doughty BR, Munson G, Rao SSP, Tan Y, Cai XS, Fulco CP, Nasser J, Mualim KS, Bergman DT, 2024. Cohesin-mediated 3D contacts tune enhancer-promoter regulation. bioRxiv 10.1101/2024.07.12.603288
- ↵Guelen L, Pagie L, Brasset E, Meuleman W, Faza MB, Talhout W, Eussen BH, de Klein A, Wessels L, de Laat W, 2008. Domain organization of human chromosomes revealed by mapping of nuclear lamina interactions. Nature 453: 948–951. 10.1038/nature06947
- ↵Hah N, Murakami S, Nagari A, Danko CG, Kraus WL. 2013. Enhancer transcripts mark active estrogen receptor binding sites. Genome Res 23: 1210–1223. 10.1101/gr.152306.112
- ↵Hamamoto K, Fukaya T. 2022. Molecular architecture of enhancer–promoter interaction. Curr Opin Cell Biol 74: 62–70. 10.1016/j.ceb.2022.01.003
- ↵Hansen AS, Pustova I, Cattoglio C, Tjian R, Darzacq X. 2017. CTCF and cohesin regulate chromatin loop stability with distinct dynamics. eLife 6: eaar2555. 10.7554/eLife.25776
- ↵Hay D, Hughes JR, Babbs C, Davies JOJ, Graham BJ, Hanssen LLP, Kassouf MT, Marieke Oudelaar A, Sharpe JA, Suciu MC, 2016. Genetic dissection of the α-globin super-enhancer in vivo. Nat Genet 48: 895–903. 10.1038/ng.3605
- ↵He HH, Meyer CA, Shin H, Bailey ST, Wei G, Wang Q, Zhang Y, Xu K, Ni M, Lupien M, 2010. Nucleosome dynamics define transcriptional enhancers. Nat Genet 42: 343–347. 10.1038/ng.545
- ↵Hegyi H. 2015. Enhancer-promoter interaction facilitated by transiently forming G-quadruplexes. Sci Rep 5: 9165. 10.1038/srep09165
- ↵Heintzman ND, Stuart RK, Hon G, Fu Y, Ching CW, Hawkins RD, Barrera LO, Van Calcar S, Qu C, Ching KA, 2007. Distinct and predictive chromatin signatures of transcriptional promoters and enhancers in the human genome. Nat Genet 39: 311–318. 10.1038/ng1966
- ↵Henriques T, Scruggs BS, Inouye MO, Muse GW, Williams LH, Burkholder AB, Lavender CA, Fargo DC, Adelman K. 2018. Widespread transcriptional pausing and elongation control at enhancers. Genes Dev 32: 26–41. 10.1101/gad.309351.117
- ↵Hnisz D, Shrinivas K, Young RA, Chakraborty AK, Sharp PA. 2017. A phase separation model for transcriptional control. Cell 169: 13–23. 10.1016/j.cell.2017.02.007
- ↵Hsieh T-HS, Cattoglio C, Slobodyanyuk E, Hansen AS, Rando OJ, Tjian R, Darzacq X. 2020. Resolving the 3D landscape of transcription-linked mammalian chromatin folding. Mol Cell 78: 539–553.e8. 10.1016/j.molcel.2020.03.002
- ↵Hua P, Badat M, Hanssen LLP, Hentges LD, Crump N, Downes DJ, Jeziorska DM, Marieke Oudelaar A, Schwessinger R, Taylor S, 2021. Defining genome architecture at base-pair resolution. Nature 595: 125–129. 10.1038/s41586-021-03639-4
- ↵Iborra FJ, Pombo A, Jackson DA, Cook PR. 1996. Active RNA polymerases are localized within discrete transcription ‘factories’ in human nuclei. J Cell Sci 109: 1427–1436. 10.1242/jcs.109.6.1427
- ↵Jackson DA, Hassan AB, Errington RJ, Cook PR. 1993. Visualization of focal sites of transcription within human nuclei. EMBO J 12: 1059–1065. 10.1002/j.1460-2075.1993.tb05747.x
- ↵Jana T, Brodsky S, Barkai N. 2021. Speed-specificity trade-offs in the transcription factors search for their genomic binding sites. Trends Genet 37: 421–432. 10.1016/j.tig.2020.12.001
- ↵Johanson TM, Lun ATL, Coughlan HD, Tan T, Smyth GK, Nutt SL, Allan RS. 2018. Transcription-factor-mediated supervision of global genome architecture maintains B cell identity. Nat Immunol 19: 1257–1264. 10.1038/s41590-018-0234-8
- ↵Jonkers I, Kwak H, Lis JT. 2014. Genome-wide dynamics of Pol II elongation and its interplay with promoter proximal pausing, chromatin, and exons. eLife 3: e02407. 10.7554/eLife.02407
- ↵Kagey MH, Newman JJ, Bilodeau S, Zhan Y, Orlando DA, van Berkum NL, Ebmeier CC, Goossens J, Rahl PB, Levine SS, 2010. Mediator and cohesin connect gene expression and chromatin architecture. Nature 467: 430–435. 10.1038/nature09380
- ↵Karr JP, Ferrie JJ, Tjian R, Darzacq X. 2022. The transcription factor activity gradient (TAG) model: contemplating a contact-independent mechanism for enhancer–promoter communication. Genes Dev 36: 7–16. 10.1101/gad.349160.121
- ↵Kim T-K, Shiekhattar R. 2015. Architectural and functional commonalities between enhancers and promoters. Cell 162: 948–959. 10.1016/j.cell.2015.08.008
- ↵Kim T-K, Hemberg M, Gray JM, Costa AM, Bear DM, Wu J, Harmin DA, Laptewicz M, Barbara-Haley K, Kuersten S, 2010. Widespread transcription at neuronal activity-regulated enhancers. Nature 465: 182–187. 10.1038/nature09033
- ↵Kim JH, Rege M, Valeri J, Dunagin MC, Metzger A, Titus KR, Gilgenast TG, Gong W, Beagan JA, Raj A, 2019. LADL: light-activated dynamic looping for endogenous gene expression control. Nat Methods 16: 633–639. 10.1038/s41592-019-0436-5
- ↵Kind J, van Steensel B. 2010. Genome-nuclear lamina interactions and gene regulation. Curr Opin Cell Biol 22: 320–325. 10.1016/j.ceb.2010.04.002
- ↵Krietenstein N, Rando OJ. 2022. Mammalian micro-C-XLMicro-C-XL. In Chromatin: methods and protocols (ed. Horsfield J, ), pp. 321–332. Springer, New York.
- ↵Lam MTY, Cho H, Lesch HP, Gosselin D, Heinz S, Tanaka-Oishi Y, Benner C, Kaikkonen MU, Kim AS, Kosaka M, 2013. Rev-Erbs repress macrophage gene expression by inhibiting enhancer-directed transcription. Nature 498: 511–515. 10.1038/nature12209
- ↵Lambert SA, Jolma A, Campitelli LF, Das PK, Yin Y, Albu M, Chen X, Taipale J, Hughes TR, Weirauch MT. 2018. The human transcription factors. Cell 172: 650–665. 10.1016/j.cell.2018.01.029
- ↵Lettice LA, Heaney SJH, Purdie LA, Li L, de Beer P, Oostra BA, Goode D, Elgar G, Hill RE, de Graaff E. 2003. A long-range Shh enhancer regulates expression in the developing limb and fin and is associated with preaxial polydactyly. Hum Mol Genet 12: 1725–1735. 10.1093/hmg/ddg180
- ↵Lim B, Levine MS. 2021. Enhancer-promoter communication: hubs or loops? Curr Opin Genet Dev 67: 5–9. 10.1016/j.gde.2020.10.001
- ↵Martin BJE, Brind'Amour J, Kuzmin A, Jensen KN, Liu ZC, Lorincz M, Howe LJ. 2021. Transcription shapes genome-wide histone acetylation patterns. Nat Commun 12: 210. 10.1038/s41467-020-20543-z
- ↵Mateo LJ, Murphy SE, Hafner A, Cinquini IS, Walker CA, Boettiger AN. 2019. Visualizing DNA folding and RNA in embryos at single-cell resolution. Nature 568: 49–54. 10.1038/s41586-019-1035-4
- ↵McClintock B. 1934. The relation of a particular chromosomal element to the development of the nucleoli in Zea mays. Z Zellforsch Mikrosk Anat 21: 294–326. 10.1007/BF00374060
- ↵Melo CA, Drost J, Wijchers PJ, van de Werken H, de Wit E, Vrielink JAFO, Elkon R, Melo SA, Léveillé N, Kalluri R, 2013. eRNAs are required for p53-dependent enhancer activity and gene transcription. Mol Cell 49: 524–535. 10.1016/j.molcel.2012.11.021
- ↵Merkenschlager M, Nora EP. 2016. CTCF and cohesin in genome folding and transcriptional gene regulation. Annu Rev Genomics Hum Genet 17: 17–43. 10.1146/annurev-genom-083115-022339
- ↵Nair SJ, Yang L, Meluzzi D, Oh S, Yang F, Friedman MJ, Wang S, Suter T, Alshareedah I, Gamliel A, 2019. Phase separation of ligand-activated enhancers licenses cooperative chromosomal enhancer assembly. Nat Struct Mol Biol 26: 193–203. 10.1038/s41594-019-0190-5
- ↵Oksuz O, Henninger JE, Warneford-Thomson R, Zheng MM, Erb H, Vancura A, Overholt KJ, Hawken SW, Banani SF, Lauman R, 2023. Transcription factors interact with RNA to regulate genes. Mol Cell 83: 2449–2463.e13. 10.1016/j.molcel.2023.06.012
- ↵Patil A, Strom AR, Paulo JA, Collings CK, Ruff KM, Shinn MK, Sankar A, Cervantes KS, Wauer T, St Laurent JD, 2023. A disordered region controls cBAF activity via condensation and partner recruitment. Cell 186: 4936–4955.e26. 10.1016/j.cell.2023.08.032
- ↵Penagos-Puig A, Claudio-Galeana S, Stephenson-Gussinye A, Jácome-López K, Aguilar-Lomas A, Chen X, Pérez-Molina R, Furlan-Magaril M. 2023. RNA polymerase II pausing regulates chromatin organization in erythrocytes. Nat Struct Mol Biol 30: 1092–1104. 10.1038/s41594-023-01037-0
- ↵Petrenko N, Jin Y, Wong KH, Struhl K. 2016. Mediator undergoes a compositional change during transcriptional activation. Mol Cell 64: 443–454. 10.1016/j.molcel.2016.09.015
- ↵Pickersgill H, Kalverda B, de Wit E, Talhout W, Fornerod M, van Steensel B. 2006. Characterization of the Drosophila melanogaster genome at the nuclear lamina. Nat Genet 38: 1005–1014. 10.1038/ng1852
- ↵Portillo-Ledesma S, Chung S, Hoffman J, Schlick T. 2023. Regulation of chromatin architecture by transcription factor binding. eLife 12: RP91320. 10.7554/eLife.91320
- ↵Ramasamy S, Aljahani A, Karpinska MA, Cao TBN, Velychko T, Cruz JN, Lidschreiber M, Oudelaar AM. 2023. The Mediator complex regulates enhancer-promoter interactions. Nat Struct Mol Biol 30: 991–1000. 10.1038/s41594-023-01027-2
- ↵Rao SSP, Huntley MH, Durand NC, Stamenova EK, Bochkov ID, Robinson JT, Sanborn AL, Machol I, Omer AD, Lander ES, 2014. A 3D map of the human genome at kilobase resolution reveals principles of chromatin looping. Cell 159: 1665–1680. 10.1016/j.cell.2014.11.021
- ↵Rao SSP, Huang S-C, Glenn St Hilaire B, Engreitz JM, Perez EM, Kieffer-Kwon K-R, Sanborn AL, Johnstone SE, Bascom GD, Bochkov ID, 2017. Cohesin loss eliminates all loop domains. Cell 171: 305–320.e24. 10.1016/j.cell.2017.09.026
- ↵Ray J, Munn PR, Vihervaara A, Lewis JJ, Ozer A, Danko CG, Lis JT. 2019. Chromatin conformation remains stable upon extensive transcriptional changes driven by heat shock. Proc Natl Acad Sci 116: 19431–19439. 10.1073/pnas.1901244116
- ↵Redolfi J, Zhan Y, Valdes-Quezada C, Kryzhanovska M, Guerreiro I, Iesmantavicius V, Pollex T, Grand RS, Mulugeta E, Kind J, 2019. DamC reveals principles of chromatin folding in vivo without crosslinking and ligation. Nat Struct Mol Biol 26: 471–480. 10.1038/s41594-019-0231-0
- ↵Rengachari S, Schilbach S, Aibara S, Dienemann C, Cramer P. 2021. Structure of the human mediator–RNA polymerase II pre-initiation complex. Nature 594: 129–133. 10.1038/s41586-021-03555-7
- ↵Robson MI, Ringel AR, Mundlos S. 2019. Regulatory landscaping: how enhancer-promoter communication is sculpted in 3D. Mol Cell 74: 1110–1122. 10.1016/j.molcel.2019.05.032
- ↵Rowley MJ, Nichols MH, Lyu X, Ando-Kuri M, Rivera ISM, Hermetz K, Wang P, Ruan Y, Corces VG. 2017. Evolutionarily conserved principles predict 3D chromatin organization. Mol Cell 67: 837–852.e7. 10.1016/j.molcel.2017.07.022
- ↵Rubin AJ, Barajas BC, Furlan-Magaril M, Lopez-Pajares V, Mumbach MR, Howard I, Kim DS, Boxer LD, Cairns J, Spivakov M, 2017. Lineage-specific dynamic and pre-established enhancer–promoter contacts cooperate in terminal differentiation. Nat Genet 49: 1522–1528. 10.1038/ng.3935
- ↵Sabari BR, Dall'Agnese A, Boija A, Klein IA, Coffey EL, Shrinivas K, Abraham BJ, Hannett NM, Zamudio AV, Manteiga JC, 2018. Coactivator condensation at super-enhancers links phase separation and gene control. Science 361: eaar3958. 10.1126/science.aar3958
- ↵Sanborn AL, Rao SSP, Huang S-C, Durand NC, Huntley MH, Jewett AI, Bochkov ID, Chinnappan D, Cutkosky A, Li J, 2015. Chromatin extrusion explains key features of loop and domain formation in wild-type and engineered genomes. Proc Natl Acad Sci 112: E6456–E6465. 10.1073/pnas.1518552112
- ↵Schaukowitch K, Joo J-Y, Liu X, Watts JK, Martinez C, Kim T-K. 2014. Enhancer RNA facilitates NELF release from immediate early genes. Mol Cell 56: 29–42. 10.1016/j.molcel.2014.08.023
- ↵Schoenfelder S, Fraser P. 2019. Long-range enhancer–promoter contacts in gene expression control. Nat Rev Genet 20: 437–455. 10.1038/s41576-019-0128-0
- ↵Scruggs BS, Gilchrist DA, Nechaev S, Muse GW, Burkholder A, Fargo DC, Adelman K. 2015. Bidirectional transcription arises from two distinct hubs of transcription factor binding and active chromatin. Mol Cell 58: 1101–1112. 10.1016/j.molcel.2015.04.006
- ↵Sigova AA, Abraham BJ, Ji X, Molinie B, Hannett NM, Guo YE, Jangi M, Giallourakis CC, Sharp PA, Young RA. 2015. Transcription factor trapping by RNA in gene regulatory elements. Science 350: 978–981. 10.1126/science.aad3346
- ↵Spitz F, Gonzalez F, Duboule D. 2003. A global control region defines a chromosomal regulatory landscape containing the HoxD cluster. Cell 113: 405–417. 10.1016/S0092-8674(03)00310-6
- ↵Strom AR, Emelyanov AV, Mir MR, Fyodorov DV, Darzacq XR, Karpen GH. 2018. Phase separation drives heterochromatin domain formation. Biophys J 114: 445a. 10.1016/j.bpj.2017.11.2460
- ↵Sutherland H, Bickmore WA. 2009. Transcription factories: gene expression in unions? Nat Rev Genet 10: 457–466. 10.1038/nrg2592
- ↵Swift H. 1959. Studies on nuclear fine structure. Brookhaven Symp Biol 12: 134–152.
- ↵Symmons O, Uslu VV, Tsujimura T, Ruf S, Nassari S, Schwarzer W, Ettwiller L, Spitz F. 2014. Functional and topological characteristics of mammalian regulatory domains. Genome Res 24: 390–400. 10.1101/gr.163519.113
- ↵Tang Z, Luo OJ, Li X, Zheng M, Zhu JJ, Szalaj P, Trzaskoma P, Magalska A, Wlodarczyk J, Ruszczycki B, 2015. CTCF-mediated human 3D genome architecture reveals chromatin topology for transcription. Cell 163: 1611–1627. 10.1016/j.cell.2015.11.024
- ↵Tippens ND, Liang J, Leung AK-Y, Wierbowski SD, Ozer A, Booth JG, Lis JT, Yu H. 2020. Transcription imparts architecture, function and logic to enhancer units. Nat Genet 52: 1067–1075. 10.1038/s41588-020-0686-2
- ↵Titus KR, Simandi Z, Chandrashekar H, Paquet D, Phillips-Cremins JE. 2024. Cell-type-specific loops linked to RNA polymerase II elongation in human neural differentiation. Cell Genomics 4: 100606. 10.1016/j.xgen.2024.100606
- ↵Vakoc CR, Letting DL, Gheldof N, Sawado T, Bender MA, Groudine M, Weiss MJ, Dekker J, Blobel GA. 2005. Proximity among distant regulatory elements at the beta-globin locus requires GATA-1 and FOG-1. Mol Cell 17: 453–462. 10.1016/j.molcel.2004.12.028
- ↵Vian L, Pękowska A, Rao SSP, Kieffer-Kwon K-R, Jung S, Baranello L, Huang S-C, El Khattabi L, Dose M, Pruett N, 2018. The energetics and physiological impact of cohesin extrusion. Cell 173: 1165–1178.e20. 10.1016/j.cell.2018.03.072
- ↵Vos SM, Pöllmann D, Caizzi L, Hofmann KB, Rombaut P, Zimniak T, Herzog F, Cramer P. 2016. Architecture and RNA binding of the human negative elongation factor. eLife 5: e14981. 10.7554/eLife.14981
- ↵Wang Z, Chivu AG, Choate LA, Rice EJ, Miller DC, Chu T, Chou S-P, Kingsley NB, Petersen JL, Finno CJ, 2022. Prediction of histone post-translational modification patterns based on nascent transcription data. Nat Genet 54: 295–305. 10.1038/s41588-022-01026-x
- ↵Wei M-T, Chang Y-C, Shimobayashi SF, Shin Y, Strom AR, Brangwynne CP. 2020. Nucleated transcriptional condensates amplify gene expression. Nat Cell Biol 22: 1187–1196. 10.1038/s41556-020-00578-6
- ↵Yang JH, Hansen AS. 2024. Enhancer selectivity in space and time: from enhancer-promoter interactions to promoter activation. Nat Rev Mol Cell Biol 25: 574–591. 10.1038/s41580-024-00710-6
- ↵Yin J-W, Wang G. 2014. The mediator complex: a master coordinator of transcription and cell lineage development. Development 141: 977–987. 10.1242/dev.098392
- ↵You Q, Cheng AY, Gu X, Harada BT, Yu M, Wu T, Ren B, Ouyang Z, He C. 2021. Direct DNA crosslinking with CAP-C uncovers transcription-dependent chromatin organization at high resolution. Nat Biotechnol 39: 225–235. 10.1038/s41587-020-0643-8
- ↵Zamudio AV, Dall'Agnese A, Henninger JE, Manteiga JC, Afeyan LK, Hannett NM, Coffey EL, Li CH, Oksuz O, Sabari BR, 2019. Mediator condensates localize signaling factors to key cell identity genes. Mol Cell 76: 753–766.e6. 10.1016/j.molcel.2019.08.016
- ↵Zaret KS, Carroll JS. 2011. Pioneer transcription factors: establishing competence for gene expression. Genes Dev 25: 2227–2241. 10.1101/gad.176826.111
- ↵Zhang S, Übelmesser N, Josipovic N, Forte G, Slotman JA, Chiang M, Gothe HJ, Gusmao EG, Becker C, Altmüller J, 2021. RNA polymerase II is required for spatial chromatin reorganization following exit from mitosis. Sci Adv 7: eabg8205. 10.1126/sciadv.abg8205
- ↵Zhang S, Übelmesser N, Barbieri M, Papantonis A. 2023. Enhancer–promoter contact formation requires RNAPII and antagonizes loop extrusion. Nat Genet 55: 832–840. 10.1038/s41588-023-01364-4
- ↵Zuin J, Roth G, Zhan Y, Cramard J, Redolfi J, Piskadlo E, Mach P, Kryzhanovska M, Tihanyi G, Kohler H, 2022. Nonlinear control of transcription through enhancer–promoter interactions. Nature 604: 571–577. 10.1038/s41586-022-04570-y