

Abstract
The genus Tuber (family: Tuberaceae) includes the most economically valuable ectomycorrhizal (ECM), truffle-forming fungi. Previous genomic analyses revealed that massive transposable element (TE) proliferation represents a convergent genomic feature of ECM fungi, including Tuberaceae. Repetitive sequences constitute a principal driver of genome evolution, shaping its architecture and regulatory networks. In this context, Tuberaceae can become an important model system to study their genomic impact; however, the family lacks high-quality assemblies. Here, we investigate the interplay between TEs and Tuberaceae genome evolution by producing a highly contiguous assembly for the endangered Chinese white truffle Tuber panzhihuanense, along with a recalibrated timeline for Tuberaceae diversification and comprehensive comparative genomic analyses. We find that, concurrently with a Paleogene diversification of the family, pre-existing Chromoviridae-related Gypsy clades independently expanded in different truffle lineages, leading to increased genome size and high gene-family turnover rates, but without resulting in highly rearranged genomes. Additionally, we uncover a significant enrichment of ECM-induced gene families stemming from ancestral duplication events. Finally, we explore the repetitive structure of nuclear ribosomal DNA (rDNA) loci for the first time in the clade. Most of the 45S rDNA paralogs are undergoing concerted evolution, although an isolated divergent locus raises concerns about potential issues for metabarcoding and biodiversity assessments. Our study establishes a fundamental genomic resource for future research on truffle genomics and showcases a clear example of how establishment and self-perpetuating expansion of heterochromatin can drive massive genome size variation owing to activity of selfish genetic elements.
Transposable elements (TEs) and other repetitive sequences are known to be one of the major causes of structural variations within individuals and species, promoting genome expansion, gene duplication, gene loss, genomic rearrangements, and reshaping of the overall genomic regulatory network (Bourque et al. 2018). Among fungi, true truffles stand out between the most TE-rich species (Muszewska et al. 2019). The family Tuberaceae (Ascomycota: Pezizomycetes) is the richest and most diverse clade of ectomycorrhizal (ECM) truffle-forming fungi (Leonardi et al. 2021) with the genus Tuber (true truffles) including some of the most economically valuable species (Leonardi et al. 2021), such as the Périgord black truffle (Tuber melanosporum Vittad.) and the Italian white truffle (Tuber magnatum Picco) (Mello et al. 2006). Among Tuberaceae, T. melanosporum was the first to have its genome sequenced (Martin et al. 2010), revealing one of the larger genomes compared with most of the ascomycetes sequenced at that time. It is characterized by a fourfold larger genome compared with other ascomycetes and by a high TE content. Comparative genomic analyses of Pezizomycetes (Murat et al. 2018b) and various other mycorrhizal-forming fungi (Kohler et al. 2015; Miyauchi et al. 2020) have demonstrated that high TE content and a reduced set of plant cell wall–degrading enzymes are recurring genomic features among ECM fungi. As all known Tuberaceae species exhibit an ECM lifestyle (Bonito and Smith 2016), this family represents a valuable model for investigating the genomic impact of transposons and their potential role in shaping phenotypic diversity.
Truffles typically establish ECM relationships with plants (Tedersoo et al. 2010), are characterized by a hypogeous fruit body in which spores are sequestered, and rely on pungent aromas to attract the animals responsible for their dispersal (Bonito et al. 2013). Most Tuberaceae host plants are angiosperms, and presumably, these were their ancestral hosts with multiple independent transitions to some gymnosperms (e.g., pines) in individual lineages during their evolution (Bonito et al. 2013). To mitigate TE activity, true truffles rely on a nonexhaustive, partially reversible methylation-based defense, known as the methylation-induced premeiotically (MIP) defense system (Montanini et al. 2014). MIP is more similar to TE control systems of metazoans and plants than to those of other fungi, such as Neurospora crassa Shear & B.O. Dodge, that rely on a highly efficient repeat-induced point mutation system (RIP) (Galagan and Selker 2004).
High repetitive content imposes great challenges for genome assembly, particularly with short-read technologies, resulting in highly fragmented genomes and unreliable gene and transposon annotations (Peona et al. 2021; Rhie et al. 2021). To date, most publicly available Tuberaceae genomes have been produced with short-read data, with the only exception of Tuber indicum Cooke & Massee (NCBI GenBank [https://www.ncbi.nlm.nih.gov/genbank/] under accession number GCA_006112555.1) and Tuber borchii Vittad. (Murat et al. 2018a), which have been sequenced with a combination of Pacific Biosciences (PacBio) RSII and Illumina short reads. To overcome these limitations and elucidate the impact of transposons bursts in Tuberaceae genomic architecture, we generated a high-quality assembly of the critically endangered Chinese white truffle Tuber panzhihuanense X.J. Deng & Y. Wang (Deng et al. 2013) using PacBio long high-fidelity (HiFi) reads. Along with Tuber latisporum Juan Chen & P.G, T. panzhihuanense is considered to be one of the most economically important truffle species in China (Wan et al. 2015). Despite its potential economic value, it is currently listed as critically endangered species by the Red List of China's Biodiversity—Macrofungi (Yao et al. 2020; Zhuang et al. 2020; https://english.mee.gov.cn/). Our assembly represents the most contiguous Tuberaceae genome assembled to date. Leveraging this resource alongside other Pezizomycetes genomes, we (1) reconstructed a robust timeline for Tuberaceae emergence and diversification, (2) deciphered the evolutionary dynamics of TEs across the clade, and (3) assessed the impact of massive TE bursts on genome architecture and gene-family evolution.
Results
A high-quality assembly and gleba-associated microbiome of T. panzhihuanense
Using k-mer-based approaches, we estimated a genome size of 109 Mb, compatible with estimates of other Tuber species (Murat et al. 2018). As expected for the haploid state of the gleba fruiting body, the genome was completely homozygous (Supplemental Fig. S1A). The assembled genome spans 119 Mb with an N50 value of 7.3 Mb, a consensus quality value (QV) of 57.72, and complete single-copy BUSCO scores of 96.4%. (Supplemental Table S1; Supplemental Fig. S1B).
Among the 29 assembled contigs, contigs 1–17 encompass almost the entire nuclear genome (Fig. 1A). Contig 18 represents the 302 kb mitochondrial genome, for which we obtained a complete and circularized sequence, whereas contigs 19–29 contain only 45S rDNA arrays. We found an enrichment of TTAGGG telomere repeats, typical of many eukaryotes, including true truffles (Martin et al. 2010), toward both ends of all 17 majors nuclear contigs, except for contigs 16 and 17, which show enrichment only at one end (Supplemental Fig. S2). These two contigs carry 45S rDNA loci at the ends lacking telomeric repeats (see Results section “45S rDNA genes are organized as a single tandem array with only one diverging locus dispersed throughout the genome”), suggesting that they may represent a single chromosome. These findings indicate that our assembly is close to chromosome level, with a haploid chromosome number of 1n = 16.
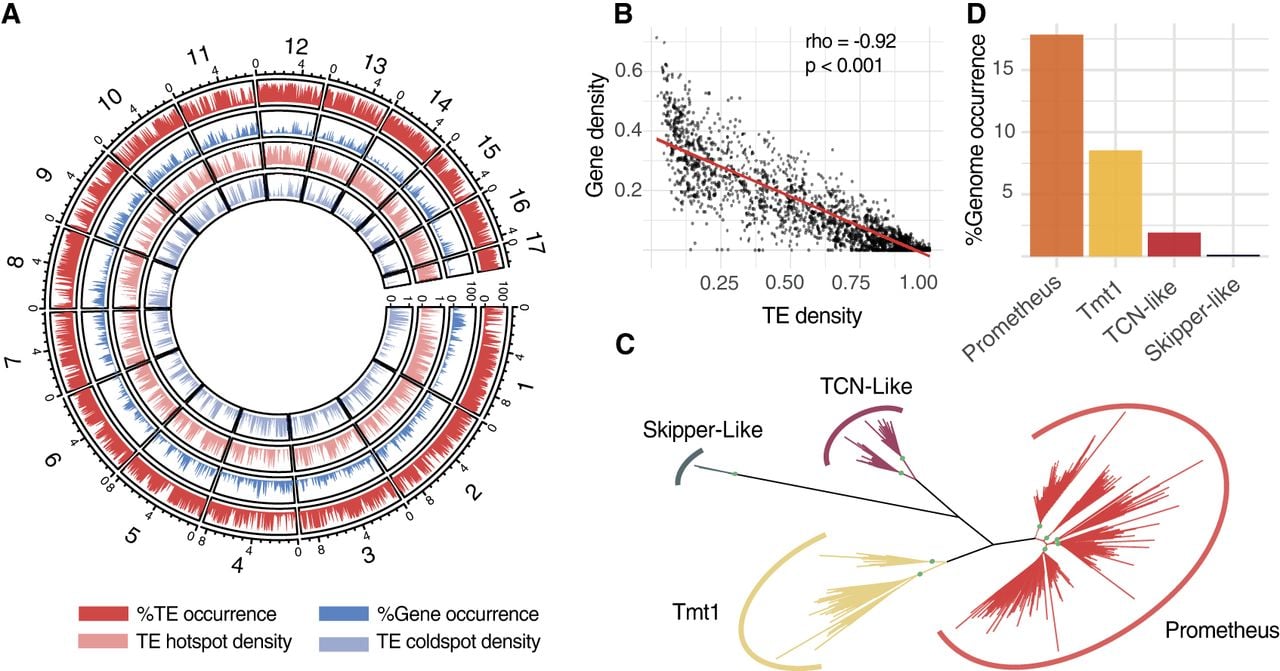
A highly compartmentalized genome colonized by Chromoviridae-related Gypsy transposons. (A) From outer to inner circles: distribution of transposons, genes, TE hotspots, and TE coldspots across the 17 main contigs of the T. panzhihuanense nuclear genome. (B) Correlation between TE density against gene density across 50 kb nonoverlapping genomic windows; rho = Spearman's rank correlation coefficient. (C) Phylogenetic tree of representative Gypsy RT protein segments longer than 100 amino acids. Green circles highlight crown nodes of identified families with bootstrap support values of 75 or more. (D) Genomic occurrence of the four identified Gypsy clades in the T. panzhihuanense genome.
On the 17 nuclear contigs, we predicted 8701 protein-coding genes (PCGs) with a complete and single-copy BUSCO score slightly higher than the assembly score (Supplemental Table S1). The T. panzhihuanense genome encodes for 363 secreted proteins (SPs), of which 173 are small SPs (SSPs), and a reduced set of 198 carbohydrate-active enzymes (CAZys) (Supplemental Table S2).
Microbial profiling (Supplemental Fig. S3A) and Blobtools analyses (Supplemental Fig. S3B) for T. panzhihuanense, along with other publicly available truffle fruiting bodies, reveal the exclusive presence of ascocarp-associated bacteria of the gleba. Bacteria of the genus Bradyrhizobium were ubiquitously detected across all species and samples (Supplemental Fig. S3A). Their association with Tuber spp. mycelia and fruiting bodies was already described and suggested to be potentially involved in nitrogen fixation (Monaco et al. 2022; Graziosi et al. 2024).
A highly compartmentalized genome dominated by retrotransposons
Manual curation of repeat libraries is considered an important step for accurate TE annotation in nonmodel species (Goubert et al. 2022; Peona et al. 2024). To improve TE annotation in T. panzhihuanense within a reasonable time frame, we manually curated the automatically generated libraries by selecting the most represented consensus sequences and/or those containing detectable protein fragments. Although the curated consensus sequences represent only 18% of the partially curated library, we found that they account for 54% of the total TE content, demonstrating that our selection strategy successfully captured most of the TE complement. Although the total TE content did not change much when using the raw versus the partially curated TE library, resulting in both instances >60%, we observed a drastic reduction in the number of unclassified elements using the former (Supplemental Fig. S4A,B). Additionally, the curation process yielded significantly longer consensus sequences compared with the uncurated ones (Supplemental Fig. S4C), suggesting a more accurate reconstruction of their complete structure (Peona et al. 2024). Finally, we managed to recover multiple consensus sequences belonging to the Plavaka group of the CMC/CACTA superfamily that were misclassified as LTR/Pao by the automatic annotation of RepeatModeler. Closer inspection of these consensus sequences revealed the presence of 2 bp target site duplications and terminal inverted repeats characterized by the motif 5′-CATAC-3′, which are features typical of Plavaka transposons previously identified in other fungal species (Supplemental Fig. S4D; Iyer et al. 2014; Hiltunen et al. 2021).
Regarding the general TE composition, Gypsy long terminal repeats (LTRs) and long interspersed nuclear element (LINE) Tad1 greatly dominate the genomic TE landscape of the Chinese white truffle (Supplemental Fig. S4B). TEs and genes have a strong and significant negative correlation between their densities (Spearman's rho = −0.92; P < 0.001) (Fig. 1A,B). Moreover, the majority of the assembly is composed of either significantly TE-enriched (TE hotspots; 51% of the genome; mean TE content = 96%) or TE-depleted genomic regions (TE coldspots; 32% of the genome; mean TE content = 15%) (Supplemental Table S3), with TE hotspots significantly longer than TE coldspots (Welch two-sample t-test, P < 0.001) (Supplemental Fig. S5). TE hotspots are richer in long retrotransposon insertions, whereas DNA elements are predominant transposons in TE coldspots (Supplemental Fig. S6). Moreover, the latter genomic compartment contains almost all PCGs (7047), with a gene density of 0.32, 2.6 times higher than the genome-wide estimation. These results are mirrored by the distance of TEs from the closest gene (Supplemental Fig. S7A), with DNA transposons more closely associated with genes compared with LINEs and LTRs (Kruskal–Wallis rank-sum test, P < 0.001; pairwise Wilcoxon rank-sum test with Bonferroni correction, P < 0.001), likely owing to the existence of numerous short nonautonomous and/or highly degenerated versions (Supplemental Fig. S7B,C). The classification of almost the entire genome into these two compartments, along with their striking differences in TE composition, strongly suggests a highly compartmentalized genomic organization. Effector-like SSPs showed no significant enrichment within TE hotspots (sample size = 8701; X2 = 1.6749, P = 0.25).
Chromoviridae-related Gypsy elements dominate the repeat landscape in the Chinese white truffle genome
Because of the significant contribution of Gypsy elements to the high TE content in the T. panzhihuanense genome, as well as in other true truffles (Payen et al. 2016; Murat et al. 2018b), we further investigated their phylogenetic placement and domain structure. Based on network clustering (Supplemental Fig. S8A) and phylogenetic analyses, we identified 10 evolutionary distinct families (Fig. 1C; Supplemental Fig. S8B). These families belong to four distinct clades: Skipper-Like, TCN-Like, Tmt1, and a rich and diversified clade that we named Prometheus (Fig. 1C; Supplemental Fig. S9). The two former clades correspond to two different elements of the Tmt6 clade founded by Payen et al. (2016), whereas the Prometheus elements correspond to the Tmt3 clade. The Tmt2, Tmt4, and Tmt5 clades identified in the work of Payen et al. (2016) seem to be absent from T. panzhihuanense. Similarly to Tmt1 and TCN-like elements, Prometheus LTRs possess a chromodomain (CHD) and belong to the Chromoviridae Gypsy branch (Supplemental Fig. S10). On the other hand, the identified Skipper-like element, despite its placement with high support in a sister relationship with the reference Skipper transposon (bootstrap = 88) (Supplemental Fig. S9), is lacking the characteristic CHD domain (Supplemental Fig. S10; Marín and Lloréns 2000). We found that Prometheus is the most abundant Gypsy clade (Fig. 1D) followed by Tmt1, TCN-like, and Skipper-like (Fig. 1D). Although most of the Gypsy insertions are composed of degenerated and/or fragmented elements (Supplemental Fig. S11), we also observed 3066 insertions that almost perfectly match LTR regions of their parent consensus sequence, resembling solo-LTR elements that arise from nonallelic homologous recombination (NAHR) between the two flanking LTRs (Kent et al. 2017).
45S rDNA genes are organized as a single tandem array with only one diverging locus dispersed throughout the genome
The ribosomal-only contigs 19 to 29 (Fig. 2A) display a conserved structural pattern characterized by 45S rDNA genes (18S–5.8S–28S) flanked by a large array of tandemly repeated elements (Fig. 2B,C). We could identify other characteristic motifs: a 160 bp sequence at the 3′ end of each rDNA unit with strong similarity to LTR regions of Prometheus Gypsy transposon, and, at the 5′ end before the main tandemly repeated region, a 100 bp palindromic structure followed by a smaller GC-rich tandem repeat (Fig. 2C). Beside these 45S rDNA-only contigs, we identified four complete and two partial 45S loci with the same structure at one end of contig 16 and contig 17, as well as an additional one isolated along contig 3, 2.8 Mb away from the closest contig end (Fig. 2A). On the other hand, 5S rDNA genes were only identified outside 45S rDNA loci, with a total of 28 copies scattered along multiple contigs (Fig. 2A).
Genomic features of rDNA loci. (A) Genomic locations of nuclear rDNA genes. The size of the contigs is proportional to their length, but different scales are used for contigs ctg_1 to ctg_17 and for contigs ctg_19 to ctg_29. The length of each contig is reported below its name. (B) Self-alignment of ctg_19 as an example of the 45S rDNA locus structure. (C) Simplified structure of 45S rDNA loci; the length of the blocks is not proportional to their actual length. (IR) Inverted repeat, (DR) direct repeat, (IGS) intergenic spacer, and (ITS1 and ITS2) internal transcribed spacers. (D) Alignment of 45S rDNA loci from 18S to 28S. Red lines highlight nucleotides that differ from the consensus sequence. The names of each locus reflect the naming system used in panel A. (E) Same as D, but for 5S rDNA genes.
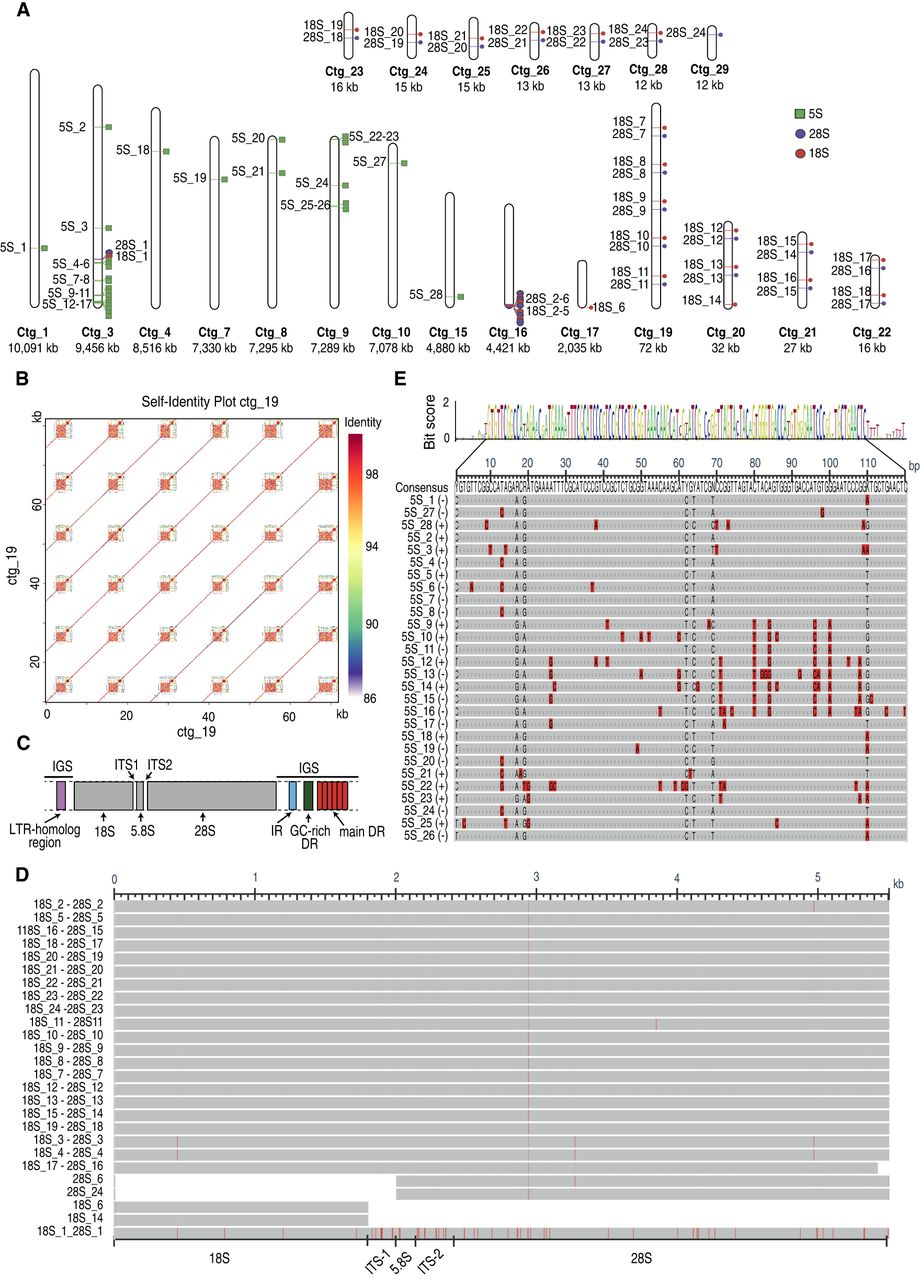
We aligned all 45S rDNA loci and all 5S rDNA genes to evaluate a possible intragenomic variation. 45S rDNA loci identified from contig 16 to contig 29 are highly homogenized, without any insertions or deletions and only seven positions harboring variants unique or shared across paralog copies (Fig. 2D). Instead, the intergenic spacer (IGS) shows variable lengths ranging from 6312 bp to 8510 bp, mainly owing to different copy numbers in the main tandem array (Fig. 2B). Contrary to other 45S loci, rDNA paralog genes found isolated on contig 3 are more diverging (Fig. 2D). Compared with the 18S_10 and 28S_10 rDNA loci, the most diverging regions are the two ITSs, both showing 96% of identity, whereas 18S, 28S, and 5.8 show an identity of 99%, 99%, and 98%, respectively. This locus is flanked by two IGS regions significantly shorter than those previously described (lengths of ∼3600 and ∼1600 bp) (Supplemental Fig. S12A,B), with one characterized by the insertion of a nonrepetitive genomic region of 480 bp of unknown origin, followed by a solo-LTR (Supplemental Fig. S12C,D). On the other hand, 5S rDNA genes present lower sequence similarity levels that can drop down to 80.8% of identity between 5S_14 and 5S_22 paralogs, with a mean identity of 93.6% (Fig. 2E).
Fossil-calibrated and genome-scale divergence time reveals a late Cretaceous origin and Paleogene radiation of Tuberaceae
To provide a robust timeline for Tuberaceae emergence and diversification as well as a backbone for all comparative genomic analyses, we first produced a recalibrated divergence time among a set of 32 Ascomycetes, including eight Tuberaceae (Fig. 3). The species were selected to maximize the number of possible calibration points, allowing us to use the highest number of fossils with clear phylogenetic placement (10 fossil calibrations) to date for an Ascomycota divergence time estimation, assembling a phylogenomic supermatrix of 1057 complete and single-copy BUSCO genes.
Late Cretaceous emergence of Tuberaceae and a Paleogene diversification of true truffles. Phylogenetic relationships and divergence time estimations obtained with 1057 complete and single-copy BUSCO genes. The species tree was constructed using an amino acid supermatrix, and both protein (black) and nucleotide (red) data were used for divergence time estimation. All nodes received maximum support values from the species tree inference, except for the split between Arthrobotrys and Pezizomycetes. The outgroup Schizosaccharomyces osmophilus was removed for visualization purposes. Numbers within circles represent the calibration points described in Supplemental Table S10. (Ne) Neoproterozoic, (Cam) Cambrian, (Or) Ordovician, (Si) Silurian, (De) Devonian, (Car) Carboniferous, (Pe) Permian, (Tr) Triassic, (Ju) Jurassic, (Cr) Cretaceous, and (Pa) Paleogene.
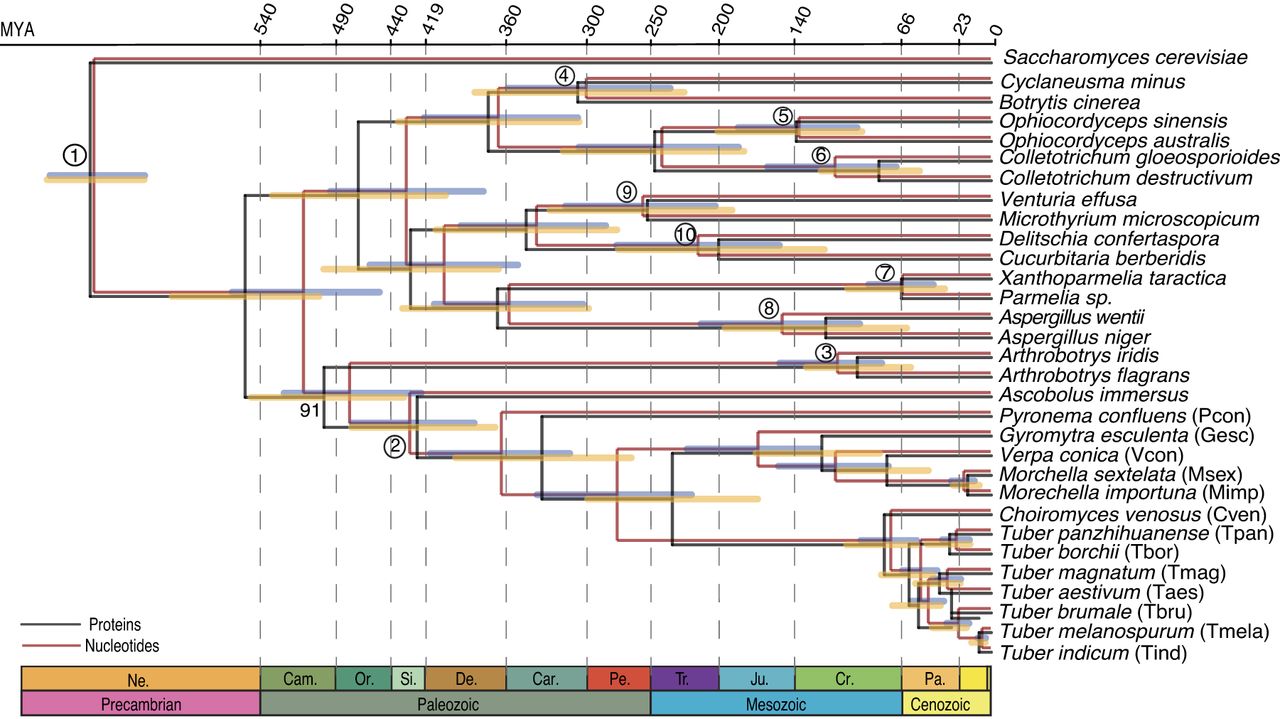
Generally, we did not observe over- or underestimation of divergence times of Ascomycota, and for most nodes, the use of nucleotide or protein data leads to confidence intervals largely overlapping (Fig. 3), providing evidence on the robustness of our estimates. Such estimates place the origin of the Tuberaceae crown group near the end of the Cretaceous (mean: ∼76 million years ago [MYA]), between previous estimations of ∼140 MYA (Bonito et al. 2013; Murat et al. 2018b) and ∼45 MYA (Miyauchi et al. 2020). The dawn of diversification within the genus Tuber is instead the Paleogene, ∼56 MYA, which sees the emergence of major subgeneric lineages: the Aestivum clade at ∼34 MYA and the Melanosporum clade at ∼26 MYA. The estimated split between T. panzhihuanense and T. borchii (Puberulum clade), its closest relative in the data set, is estimated to have occurred between ∼26 and ∼30 MYA.
High and variable TE content in Tuberaceae
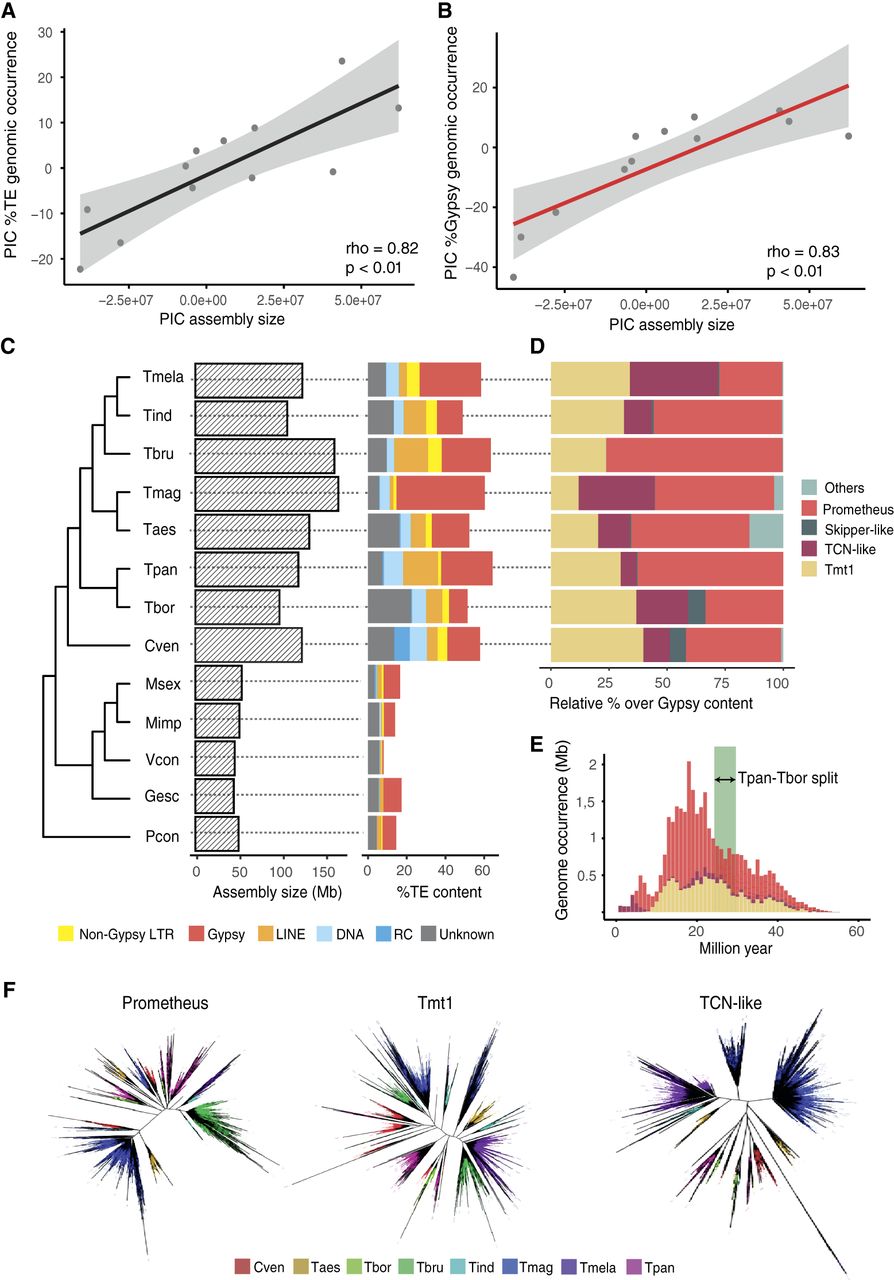
We estimated the TE content of the 13 included Pezizales species using automatically de novo generated libraries. Although we did not manually curate these elements, as previously shown, the overall TE content and its composition did not change significantly when using the raw and partially curated repeat library in the Chinese white truffle genome (Supplemental Fig. S4B), making our results suitable for a genome-wide comparison of the TE content between different species (Carrasco-Valenzuela et al. 2025). First, we explored the presence of possible biases in assembly sizes (as a proxy for genome size) and TE estimations owing to different levels of assembly contiguities measured in terms of N50 values, and we did not identify any significant relationship (all P > 0.05) (Supplemental Table S4). Instead, we detected a significant positive correlation between assembly size (proxy for genome size) and both total TE content and Gypsy content, also when correcting for shared evolutionary histories using phylogenetic-independent contrasts (PICs) (Fig. 4A,B; Supplemental Tables S5, S6). Moreover, for total TE, DNA, and non-Gypsy LTR content, we found strong and significant phylogenetic signals, with Pagel's λ values approaching one, whereas no such relationship was observed for Gypsy elements (Supplemental Table S6). Indeed, Gypsy LTRs contribute very differently to the overall repeat content, even between closely related Tuber species such as T. melanosporum and T. indicum (Fig. 4C). The four identified clades account for most of the Gypsy content in Tuberaceae, with CHD-related elements being the main contributors (Fig. 4D; Supplemental Table S5), whereas the relative proportions of the different clades vary greatly among species (Fig. 4D). Lineage-specific activity of Gypsy clades in T. panzhihuanense was confirmed by repeat landscape profiles using a neutral substitution rate of 3.36 × 10⁻³ per million years (Fig. 4E). We did not produce repeat landscape profiles for other species owing to the significantly lower quality of their assemblies; however, an evolutionary scenario mainly involving lineage-specific amplifications was supported by Gypsy phylogenetic analyses with the presence of highly dense species-specific clades that are evolutionarily distant between each other (Fig. 4F).
Lineage-specific proliferation of different Gypsy clades drives genome expansion in Tuberaceae. Correlations between total TE content (A) and Gypsy content with assembly size (B), used as a proxy for genome size after correcting for shared evolutionary history using phylogenetic-independent contrasts (PICs). (C) Assembly size and TE content for 13 Pezizales species used in comparative genomic analyses. (D) Relative contribution of identified clades to the total Gypsy content of Tuberaceae. Others refer to Gypsy clades that were not identified and characterized in T. panzhihuanense. (E) Repeat landscape profile describing the activity over time of Gypsy clades in the T. panzhihuanense genome after transforming the CpG-corrected Kimura distance into millions of years using a substitution rate of 3.36 × 10⁻³ per million year. The green box highlights the mean divergence time between T. panzhihuanense and T. borchii based on nucleotides (lower bound) and amino acids (upper bound). (F) Clade-specific phylogenetic trees of all Gypsy RT segments with a length of at least 100 amino acids extracted from all Tuberaceae genomes. Different colors highlight different species. All species abbreviations are reported in Figure 3.
Members of all four Gypsy clades were identified also within Morchellaceae, Gyromitra esculenta Pers. ex Fr., and Pyronema confluens Tul. & C. Tul. (Supplemental Fig. S13; Supplemental Table S5), suggesting their ancestral presence in Pezizomycetes.
Synteny conservation between true truffles and Morchellaceae despite high gene-family turnover rates and TE accumulation
Murat et al. (2018b) found a high rate of gene-family turnover within Tuberaceae together with an unexpected high level of microsynteny conservation within them. Here, we took advantage of the increased number of truffle genomes together with our high-quality T. panzhihuanense assembly to further test these findings and their relationship with TE accumulation. Because no gene annotation was publicly available for Verpa conica (O.F. Müll.) Sw. and G. esculenta, we performed a de novo annotation following the same pipeline used for T. panzhihuanense (for summary statistics, see Supplemental Table S7). We estimated, compared with other analyzed species, a fourfold higher gene-family (CAFE λ) turnover rate in Tuberaceae (0.163 vs. 0.036) (Fig. 5A) with their early evolution mainly impacted by gene losses. However, we also identified 27 significantly expanded gene families in their stem branch (CAFE Viterbi P < 0.05) (Fig. 5A).
High gene-family turnover rates within Tuberaceae and synteny conservation with Morchellaceae. (A) Gene-family expansions and contractions along the Pezizales phylogeny. At each node, the top number indicates the number of gene-family expansions, and the bottom number indicates the number of contractions. The numbers in parentheses represent the significantly expanded and contracted gene families. (λ) Birth–death model rates fitted with CAFE for Tuberaceae and all other Pezizales species. Species abbreviations are shown in Figure 3. (B) Syntenic relationships between the T. panzhihuanense and M. sextelata genomes. The length of syntenic blocks is proportional to their actual length in base pairs. (C,D) Examples of syntenic genomic regions between T. panzhihuanense and M. sextelata involved in gene loss and small-scale rearrangements. (Private genes) Genes without any known orthologous relationship. Blocks have different scales and are shown at the bottom. (E) Cumulative distribution of the length of syntenic blocks in T. panzhihuanense and M. sextelata. (F,G) Comparison of TE and gene coverage (% of base pairs) across syntenic and nonsyntenic genomic regions in T. panzhihuanense, calculated over nonoverlapping genomic windows of 50 kb. Nonsyntenic genomic regions were found to be significantly more TE-rich and less gene dense (Wilcoxon rank-sum test, P < 0.01). (H) TE coverage (% of base pairs) across exons, introns, and 5 kb of gene-flanking regions for genes belonging to significantly expanded gene families identified in the branch leading to Tuberaceae diversification, as well as in the T. panzhihuanense terminal branch, compared with all other genes. Genes belonging to significantly expanded gene families were found to be significantly more TE-rich across all genomic compartments (Wilcoxon rank-sum test, P < 0.01).
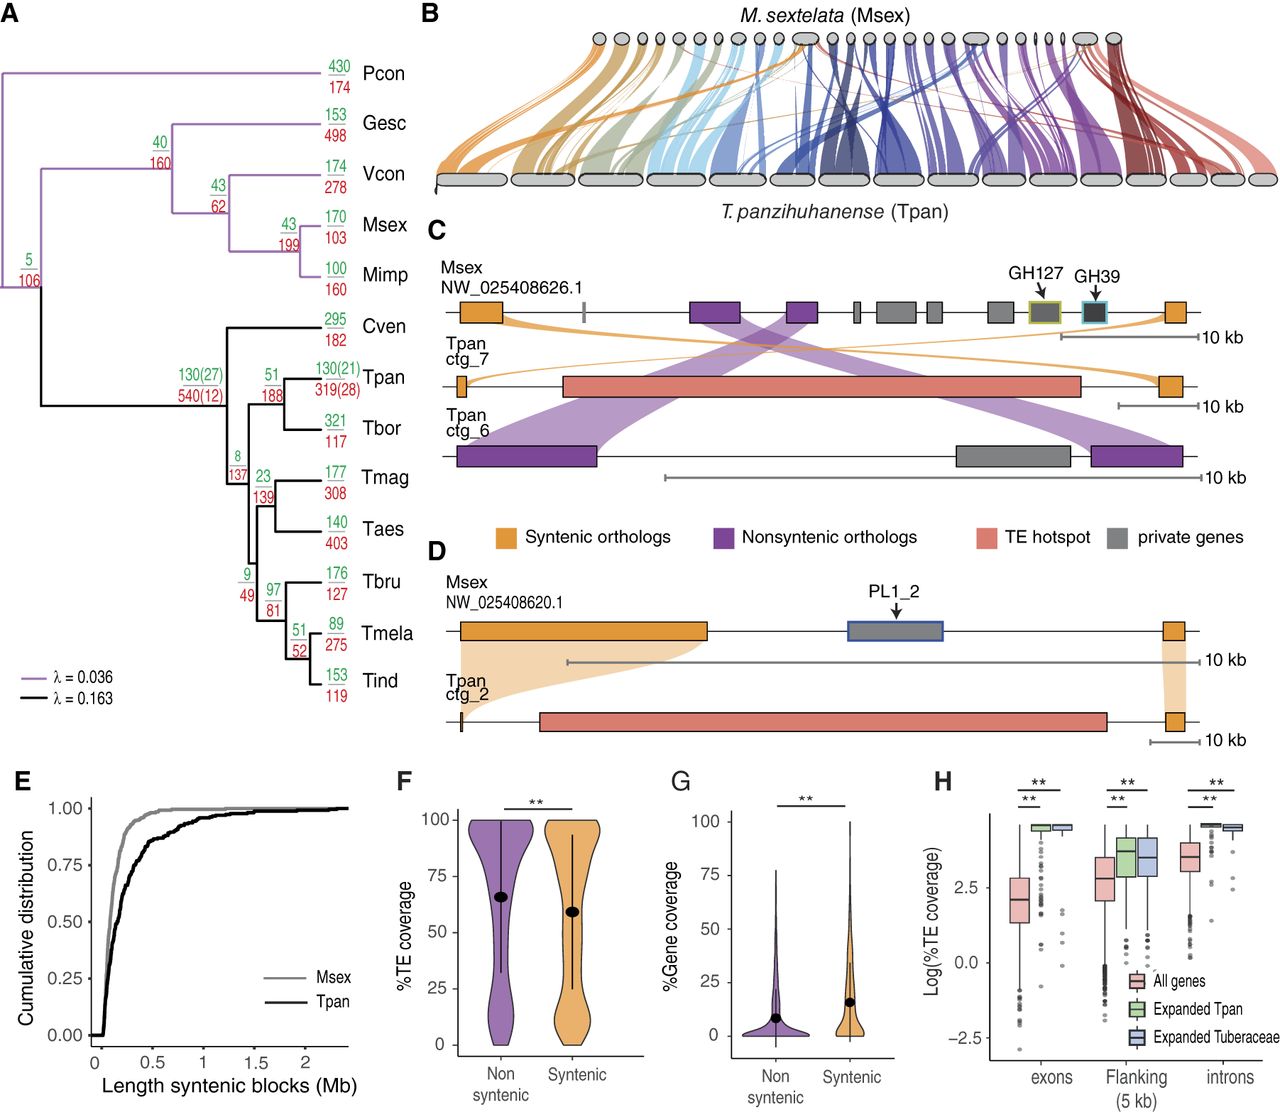
Gene-based synteny analysis between T. panzhihuanense and the 16 longest scaffolds of T. magnatum confirms a notable conservation of mid-scale synteny within true truffles (Supplemental Fig. S14A). Moreover, two T. magnatum scaffolds align with two different contigs of T. panzhihuanense. Considering that all involved contigs possess telomeric repeats at both ends, these rearrangements might reflect chromosomal fusions or fissions. Also, the comparison of T. panzhihuanense with the long-read-based high-quality Morchella sextelata M. Kuo assembly revealed relatively high levels of mesosynteny conservation between the two species (Fig. 5B; Supplemental Fig. S14B). Indeed, 61% of the T. panzhihuanense genome and 70% of single-copy orthologs results were syntenic with synteny blocks that can reach up to 2 Mb of length (mean = 269.5 kb) (Supplemental Fig. S15A,B). Synteny blocks are markedly elongated in T. panzhihuanense relative to M. sextelata (Wilcoxon rank-sum test, P < 0.001) (Fig. 5E) exhibiting up to 20-fold length increases. TE accumulation in intergenic regions emerged as the main driver of synteny block and genome size expansion. Although M. sextelata shows slightly longer and more numerous introns than T. panzhihuanense (Wilcoxon rank-sum test, P < 0.001) (Supplemental Fig. S16A,B), intergenic regions are on average about 4.8 times longer in T. panzhihuanense (Wilcoxon rank-sum test, P < 0.001) (Supplemental Fig. S16C), with TE accumulation having a much greater impact on their length than on introns (Supplemental Fig. S16D,E). Syntenic genomic regions are slightly but significantly depleted in TEs (TE density: 0.59 vs. 0.65; Wilcoxon rank-sum test, P < 0.01) (Fig. 5F) and are almost two times more gene-dense compared with nonsyntenic ones (gene density: 0.159 vs. 0.08; Wilcoxon rank-sum test, P < 0.01) (Fig. 5G). However, 59% of the TE hotspots are completely contained within synteny blocks and flanked by syntenic genes (Fig. 5C,D). Visual inspection of some of these regions revealed some notable cases of loss of CAZy-encoding genes in the T. panzhihuanense lineage related to small scale rearrangements (e.g., GH37 and GH39) (Fig. 5C) and TE accumulation (e.g., PL1_2) (Fig. 5D).
Finally, we found that genes belonging to significantly expanded families in the branch leading to Tuberaceae diversification as well as in T. panzhihuanense terminal branch are significantly more TE-rich (Wilcoxon rank-sum test, all P < 0.01), in their exons, in their introns, and within 5 kb of flanking sequences (Fig. 5H). Additionally, genes included in TE hotspots are enriched in paralogous copies of these fast-evolving families (X2 test, sample size = 8701, degree of freedom = 1, X2 = 149.1907, P < 0.01), with 4.7 times more of these genes than expected by chance. These findings led us to hypothesize that genes located within TE hotspots are likely to be members of multicopy gene families. Indeed, 54% of the gene content of TE hotspots belongs to families with more than one gene compared with 18% of the genome.
Gene-family expansions at the root of Tuberaceae are related to the establishment of an ECM lifestyle
Gene duplication can lead to neofunctionalization and protein diversification (Copley 2020). We therefore tested whether gene duplication contributed to the transition from a saprotrophic to an ECM lifestyle in the Tuberaceae stem branch. Murat et al. (2018b) proposed that conserved ancient gene networks underlie the development and functioning of Tuberaceae ectomycorrhizae. Accordingly, we expect orthologous ECM-induced genes to have retained their function throughout the diversification of the clade. We therefore identified gene families associated with ECM (ECM-induced families) by intersecting our gene-family set with genes found to be upregulated in T. magnatum ECM compared with free-living mycelium by Murat et al. (2018b). In total, we identified 328 gene families containing T. magnatum ECM-induced orthologs, of which 18 are expanded, and five of these are significantly expanded in the branch of interest (Fig. 6A; Supplemental Table S8; Supplemental Fig. S15). We then applied a Fisher's exact test to assess the hypothesis that ECM-induced gene families are significantly overrepresented among expanded and significantly expanded gene families in the stem branch of Tuberaceae. Contingency tables were constructed by counting the number of ECM-induced and non-ECM-induced gene families in the expanded/significantly expanded categories versus all other gene families having at least one gene in one Tuberaceae species (i.e., present at the root of Tuberaceae). In both instances, we found a significant overrepresentation of ECM-induced gene families of 2.5-fold and 3.7-fold, respectively, among expanded (P < 0.001) and significantly expanded gene families (P = 0.013).
Ancestral gene duplications of ECM-induced gene families. (A) CAFE results for three ECM-induced gene families that are significantly expanded on the stem branch of Tuberaceae. For each node, inferred and observed gene-family counts are shown on internal and terminal branches, respectively. Green indicates expansions, red indicates contractions, and significant changes are marked with an asterisk. Numbers in brackets indicate node IDs and refer to Supplemental Table S8. Species abbreviations are given in Figure 3. (B) InterProScan domain annotations of representative T. panzhihuanense proteins from each of the three gene families. For OG0000075, we used a reference protein from T. magnatum because no family members were detected in T. panzhihuanense. Symbols correspond to those in A. (TPR) Tetratricopeptide repeat. Supplemental Figure S17 shows the results for the two others significantly expanded ECM-induced gene families, OG0000009 and OG0000138, encoding ankyrin repeat–containing proteins and AAA ATPases, respectively.
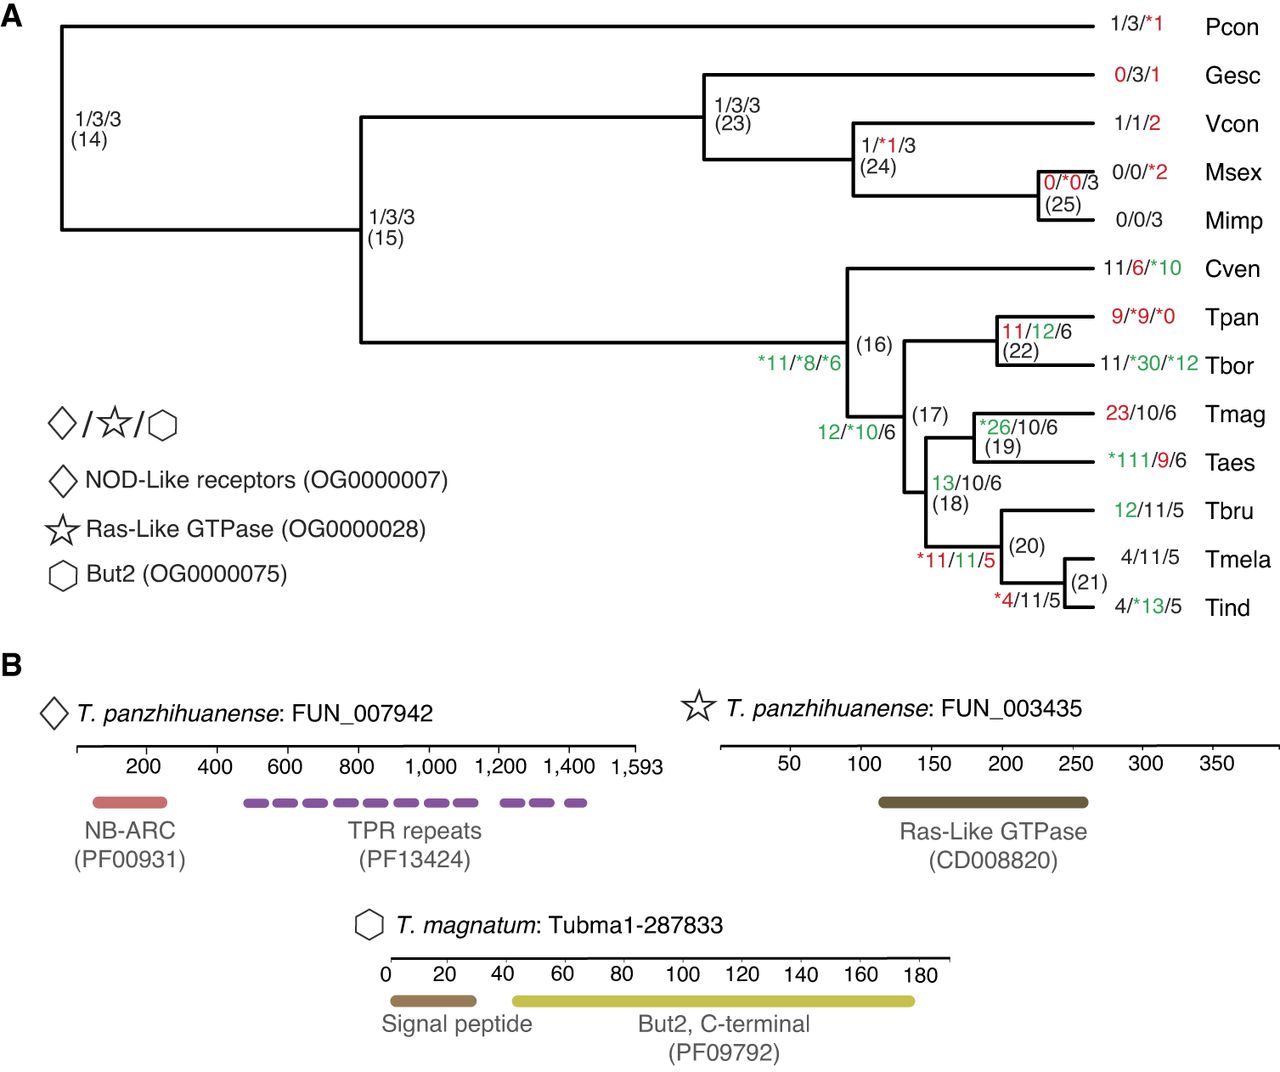
Significantly expanded gene families of particular interest are the OG0000007, OG0000028, and OG0000075 (Fig. 6A,B). The former encodes for NOD-like receptors (NLRs), and a total of 187 genes are clustered in this family, with only one ortholog in P. confluens and one in V. conica. Morchellaceae have apparently lost this gene family, whereas Tuberaceae possess a variable but high number of paralogous copies. The other two gene families encode for putative Ras-like and But2 C-terminal-like proteins, respectively. For the former family, Tuberaceae species encodes between six and 30 genes, whereas other Pezizomycetes encode between three and zero. For the latter family, Tuberaceae species encode at least five gene copies, except for T. panzhihuanense, which appears to have lost this gene family. In other analyzed species, there are between one and three copies. All Tuberaceae But2 C-terminal-like genes encode for SSP. The two remaining significantly expanded ECM-induced gene families OG0000009 and OG0000138 encode, respectively, ankyrin repeat–containing proteins and AAA ATPases (Supplemental Fig. S17).
Discussion
This study presents a high-quality genome assembly for the critically endangered Chinese white truffle, T. panzhihuanense, exhibiting a contiguity of about fourfold higher than that of the second most contiguous Tuber genome (T. magnatum GenBank: GCA_003182015.1, scaffold N50 of 1.8 Mb and contig N50 of 45.1 kb). Its high assembly quality, our recalibrated divergence time, and in-depth analyses of TEs and gene-family evolution across Pezizales allowed us to explore with unprecedented detail the impact of massive TE burst in genome architecture and evolution of Tuberaceae.
Based on multiple fossil calibration points and a genome-scale matrix, we placed the diversification of Tuberaceae and true truffles in a more biologically meaningful time frame compared with previous studies (Bonito et al. 2013; Murat et al. 2018b; Miyauchi et al. 2020), which were based on substitution rates inferred from distantly related taxa and/or few fossil data. A late Cretaceous emergence of the family is consistent with the angiosperm terrestrial revolution (Benton et al. 2022) that gave rise to the most species-rich living clades of angiosperms (Ramírez-Barahona et al. 2020), mammals (Álvarez-Carretero et al. 2022), birds (Jarvis et al. 2014), and arthropods (Montagna et al. 2019; Benton et al. 2022), but their following diversification took place in the Paleogene. The diversification of truffles therefore occurred in a context of expanding angiosperm-based ecosystems in which these fungi coevolved and codiversified with their host plants and the animals responsible for their spore dispersal (Brundrett and Tedersoo 2018; Benton et al. 2022). It is noteworthy that within Basidiomycota, ECM Agaricomycetes apparently experienced a similar evolutionary course, diversifying rapidly during the Paleogene following a late Cretaceous divergence (Sato 2024).
Massive TE bursts, triggered by horizontal transposon transfer or stochastic activation of pre-existing lineages, can lead to rapid genome size increases (Schaack et al. 2010; Oggenfuss et al. 2021). Previous studies have already highlighted the prominent role of Gypsy elements, particularly Chromoviridae-related clades, in driving genome expansion in true truffles (Martin et al. 2010; Payen et al. 2016; Murat et al. 2018b; Miyauchi et al. 2020). However, whether these bursts represent ancestral or lineage-specific events, as well as which specific clades were involved, has remained an open question. Here, we found that Tuberaceae genomes host four main CHD-related clades that underwent predominantly lineage-specific activity. Together with the presence of representative elements in several other Pezizales species, this makes Tuberaceae an iconic example of how an apparently common genome size expansion within a clade can be driven by parallel genomic trajectories, involving the differential lineage-specific proliferation of pre-existing transposon lineages, possibly influenced by specific demographic dynamics (Martin et al. 2010).
Reduced gene density is a widely observed result of TE accumulation (Muszewska et al. 2019). Our results indicate that, in Tuberaceae, this is because of a highly compartmentalized genome architecture, with stretches of heterochromatic DNA dominated by long retrotransposon insertions interspersed with compact, gene-rich regions. The absence of an enrichment of SSPs within TE-rich regions suggest a partially different genomic organization compared with the frequent TE/effector compartmentalization of pathogenic fungi genomes (Raffaele et al. 2010; Schmidt et al. 2013; Fouché et al. 2020). Nonrandom distribution of TEs, particularly Gypsy LTRs, was already observed in T. melanosporum (Martin et al. 2010; Payen et al. 2016), and Chromoviridae-related LTRs are known to have a strong preference for heterochromatic genomic regions in plants (Neumann et al. 2011) and in the fungus Schizosaccharomyces pombe Lindner, in which the CHD domain directly recognizes histone H3 K9 methylation (Gao et al. 2008). Increased genome size of Tuberaceae is therefore the result of a process of retrotransposon-mediated self-perpetuating expansion of heterochromatic genomic regions (Gao et al. 2008), rather than intron gain or intron expansion, as observed in other eukaryotes (Cicconardi et al. 2023). No heterochromatic insertion preference has been described so far for LINE Tad1 elements, and their massive presence within these regions can be explained by negative selection against long insertions in gene-dense genomic regions (Buckley et al. 2017; Ruggieri et al. 2022; Martelossi et al. 2024). Similarly to what was previously observed in the fungus Pleurotus ostreatus (Jacq.) P. Kumm. (Castanera et al. 2016), we found evidence of NAHR between LTR regions of Gypsy transposons. We therefore suggest that Tuberaceae genomes coped with TE expansions both owing to strong insertion preference of highly active Gypsy elements and, on the host genome side, owing to MIP and an increased rate of ectopic recombination resulting from the spread of homologous sequences throughout the genome, limiting the deleterious effects of an uncontrolled proliferation.
The emergence of nonhomologous and rearranged genomic regions can be another major outcome of TE bursts (Thon et al. 2006; Aguileta et al. 2009; Treindl et al. 2021). However, the massive, lineage-specific activity of Chromoviridae-related Gypsy elements during Tuberaceae diversification did not result in extensive genome rearrangements, as indicated by the strong conservation of synteny between T. panzhihuanense and T. magnatum and even between T. panzhihuanense and M. sextelata, a Morchellaceae species that diverged from Tuberaceae ancestor >200 MYA and is characterized by low TE content and high gene density (Han et al. 2019). Instead, rampant TE accumulation primarily elongates syntenic blocks while preserving mid-scale synteny, with the occasional emergence of small-scale genomic rearrangements, possibly favoring the establishment of novel TE-rich heterochromatic DNA. Indeed, multiple CAZy enzymes encoded by M. sextelata were lost and replaced by TE-rich genomic regions in T. panzhihuanense, suggesting that TE insertions, together with sequence decay (Murat et al. 2018b), might have contributed to gene loss in the clade. Despite the absence of chromosome-scale assemblies to dissect intra- and inter-chromosomal genomic rearrangements, our results recapitulate the mesosynteny pattern formally described in filamentous fungi (Hane et al. 2011) and observed between T. melanosporum and the Eurotiomycete Coccidioides immitis Rixford & Gilchrist (Martin et al. 2010). Furthermore, the presence of 16 putative chromosomes in the haploid genome of T. panzhihuanense, along with its syntenic relationships with T. magnatum, suggests that although mesosynteny is maintained, large-scale chromosomal rearrangements, such as fusions and fissions, might have occurred during Tuberaceae diversification. To date, cytogenetic data are available for only four Tuber species with an estimated haploid chromosome number ranging from four to five (Poma et al. 1998, 2002). Additional cytogenetic and/or chromosome conformation capture data on T. panzhihuanense and other true truffles will be necessary to confirm our findings and assess the impact of large-scale genomic rearrangements on Tuberaceae genome evolution.
The preferential localization of multicopy gene families within TE-rich genomic regions supports the idea that these regions act as hotspots for copy number variation (Montanini et al. 2014). The overrepresentation of ECM-induced gene families among those significantly expanded on the stem branch of the family further suggests that protein diversification through neo- and/or subfunctionalization may have contributed to the emergence of the ECM lifestyle. Based on the annotated domains, these gene families appear to be involved in self/nonself recognition, signal transduction, and the modulation of transcription in both the fungus and, eventually, its host. Indeed, rapid adaptation to a changing environment during ECM establishment has been suggested to involve signal transduction pathway cascades (Martin and Tunlid 2009), potentially including NLRs, Ras-like proteins, and But2 C-terminal-like proteins. NLRs are a class of receptor proteins involved in various types of biotic interactions, including self/nonself recognition and ECM symbiosis (Dyrka et al. 2014), and many NLR-encoding genes were found upregulated in T. melanosporum during ECM formation (Martin et al. 2010). The genome of the ECM fungus Laccaria bicolor (Maire) P.D. Orton encodes a wide set of protein kinase and RAS small guanosine triphosphatase (GTPase) genes (Martin et al. 2008), with frequent neofunctionalization of paralogous copies and few pseudogenization events (Rajashekar et al. 2009). The expression of one of these genes, Lbras, depends on the interaction with host roots, and it is expressed in established mycorrhizal tissues (Sundaram et al. 2001). But proteins of Saccharomyces cerevisiae Meyen ex E.C. Hansen are seemingly involved in the activation of the NEDD8 ligation pathway, which leads to substrate NEDDylation (Yashiroda and Tanaka 2003), a post-translational modification that is crucial for fungal cellular processes such as development and secondary metabolism (Yang et al. 2022). SSPs with high similarity to But2 C-terminal domain could be involved, with other fungal SPs, in affecting host transcription and responses needed for the establishment and retention of mycorrhizal structures or part of fungal–host plant cross talk.
Finally, we explored the structure of nuclear rDNA loci, which were difficult to characterize in previous genome assemblies owing to their low contiguity. The high level of similarity found between 45S rDNA genes and the presence of partial arrays only at the ends or within rDNA-only contigs suggest that the 45S genes are undergoing concerted evolution owing to high homogenization within a single cluster (Ganley and Kobayashi 2011; Hori et al. 2021; Garcia et al. 2024). The complex IGS region, similarly to what is observed in humans and budding yeast (Ganley and Kobayashi 2011; Hori et al. 2021), is composed of tandemly arranged repeats and can undergo deletion and duplication events, leading to rDNA arrays of different lengths. IGS regions contain regulatory sequences involved in rDNA maintenance, replication, and transcription (Hori et al. 2023). The variability of the spacers has also been correlated with differential expression of rDNA loci (Kim et al. 2024) owing to its potential impact on functional elements that are embedded in the structure of the sequence. We also provide evidence of intragenomic variability of 45S rDNA units, with the identification of one diverging copy that is located outside the presumptive main cluster. As observed in work by Robicheau et al. (2017), the isolated rDNA copy might have emerged through nonhomologous exchange of centromeric sequences in proximity to rDNA arrays or, eventually, by a recombination event fostered by the tandemly repeated sequences of the IGS, with the subsequent accumulation of point mutations owing to weaker concerted evolution. Its existence should not invalidate the use of the ITS region for species and strain identification in T. panzhihuanense using classic Sanger sequencing as, even if we assume a successful primer binding, most of the fluorescent intensity of the electropherogram would come from the paralogous copies of the main clusters. However, it can become a problem with metagenomics studies based on environmental DNA samples (Bradshaw et al. 2023). We therefore encourage future investigation of the 45S rDNA gene polymorphisms in truffles to avoid the establishment of new cryptic species and invalid diversity estimates owing to intra-genomic polymorphisms.
The high-quality T. panzhihuanense assembly will represent a fundamental resource for future agriculture-applied studies of this endangered species (e.g., transitioning this currently uncultivable species from wild harvesting to orchard cultivation) (Lemmond et al. 2023) and will continue to serve as a basis for genomic studies of truffles.
Methods
Sampling and DNA/RNA sequencing
The sample used for genome sequencing was collected in 2020 by the Jinsha river basin (river section of Zhongba village, Renhe district, city of Panzhihua, China). The fruiting body was isolated and taxonomically identified based on morphology and molecular characteristics and sent to Personalbio for whole-genome sequencing (WGS). WGS was performed both on a PacBio Sequel II obtaining 38+ Gb of HiFi reads and on an Illumina NovaSeq 6000 platform. RNA-seq data used for genome annotation were obtained from three replicates of a mix of 100 ECM individuals isolated from one P. massoniana–T. panzhihuanense mycorrhizal seedlings. Samples were sent to Novogene Technology for library construction and sequencing on an Illumina NovaSeq 6000 platform in 150 PE mode. For detailed sample identification, mycorrhizal synthesis preparation, and library construction, see the Supplemental Methods.
Genome survey and assembly
Illumina reads were quality checked with FastQC v0.11.7 (http://www.bioinformatics.babraham.ac.uk/projects/fastqc) and trimmed with Trimmomatic v0.39 (-phred33 LEADING:3 TRAILING:3 SLIDINGWINDOW:4:15 MINLEN:36) (Bolger et al. 2014). Trimmed reads were used with KAT v2.4.2 (Mapleson et al. 2017) hist to produce k-mer frequency histogram. Genome size and heterozygosity were estimated with GenomeScope 2.0 (Ranallo-Benavidez et al. 2020). PacBio subreads were processed to obtain final circular consensus sequencing (CCS) reads using PacBio CCS tool v6.4.0 (‐‐min-rq 0.99). The genome was assembled with Hifiasm v0.16.1 (Cheng et al. 2021) under default parameters, and Blobtools v1.1 (Laetsch and Blaxter 2017) was used to identify contigs deriving from fruiting body–associated microorganisms. To obtain coverage information, we mapped HiFi reads back to the assembly with minimap2 v2.24-r1122 (-ax map-hifi) (Li 2018), whereas for taxonomic annotation, we blasted all contigs against the NCBI nt database (BLASTN -max_target_seqs 10 -max_hsps 1 -evalue 1 × 10⁻²⁵). Reads mapped to identified microorganism-associated contigs were excluded, and the genome was reassembled with Hifiasm. TTAGGG telomeric repeats were identified with tidk (Brown et al. 2025) under default settings. The quality and completeness of the final assembly were assessed with BUSCO v5.2.2 (fungi_odb10 reference database) (Mosè et al. 2021) and Merqury (Rhie et al. 2020) with a k-mer size of 21. Metagenomic taxonomic profiling was performed using raw short reads from our study, along with publicly available sequencing data from the gleba of Tuber brumale, T. indicum, and T. melanosporum. A T. borchii isolate was used as a control. Paired-end sequencing reads were classified using Kraken2 v2.1.2 (Wood et al. 2019) with a custom Kraken database built from merged bacterial and fungal genomes downloaded from NCBI RefSeq. For details about Kraken2 classification, see the Supplemental Methods.
Repeat annotation
For repeat annotation, we produced a starting raw repeat library with RepeatModeler2 v2.0.4 (Flynn et al. 2020) with the LTR structure extension. Raw consensus sequences were used for a first genome annotation with RepeatMasker v4.1.2-p1 (Smit et al. 2013–2015) in sensitive mode (-s). Based on RepeatMasker results, we isolated all consensus sequences with at least 50 instances in the genome and/or characterized by protein fragments based on Blastx (E-value 1 × 10⁻⁵) results against the RepeatPeps database from the RepeatMasker package. Selected sequences were subjected to manual curation and classification based on structural features (presence and length of target site duplications, presence of terminal inverted repeats or long terminal repeats, and TE-related domains identified through the NCBI Conserved Domain Database) following a “blast–extend–extract” process as described by Goubert et al. (2022) and Peona et al. (2024). Curated and uncurated consensus were merged and redundancy removed following the 80–80 rule (i.e., requiring a minimum 80% identity along 80% of the shortest sequence) (Wicker et al. 2007; Goubert et al. 2022) with cd-hit-est (-c 0.8 -n 5 -aS 0.8 -g 1 -G 0 -t 1). This partially curated library was used for repeat annotation and soft-masking the genome with RepeatMasker in sensitive mode. We postprocessed RepeatMasker results with the parseRM.pl script (https://github.com/4ureliek/Parsing-RepeatMasker-Outputs/blob/master/parseRM.pl) to obtain genome-wide repeat estimations and RepeatCraft (Wong and Simakov 2019) in loose mode to defragment closely spaced repeat loci and obtain a final TE annotation.
Gene annotation
Quality of RNA-seq reads was assessed with FastQC v0.11.7 and trimmed with Trimmomatic v0.39 (-phred33 LEADING:3 TRAILING:3 SLIDINGWINDOW:4:15 MINLEN:36). We assembled the transcriptome with Trinity v2.1.1 (Grabherr et al. 2011) under default parameters.
For gene annotation, we used Funannotate v1.8.16 (https://doi.org/10.5281/zenodo.1134477) on the soft-masked version of the genome performing an ab initio gene prediction with AUGUSTUS (Stanke et al. 2008), SNAP (Korf 2004), GlimmerHMM (Majoros et al. 2004), CodingQuarry (Testa et al. 2015), and GeneMark-ES (Lomsadze et al. 2005). As external evidence, together with the assembled transcriptome, we selected a high-quality and consistent set of proteins composed by four Ascomycota RefSeq proteomes available on the NCBI GenBank database (GCF_000151645.1: T. melanosporum; GCF_003444635.1: Morchella importuna; GCF_020137385.1: M. sextelata; and GCF_024521635.1: Tricharina praecox) and the Swiss-Prot database (The UniProt Consortium 2023). We excluded other available Tuber spp. gene annotation available on NCBI as the gene annotation is not part of the RefSeq collection (https://www.ncbi.nlm.nih.gov/refseq/annotation_euk/process/).
Functional annotation of predicted genes was performed with InterProScan V5.70 (Jones et al. 2014) to obtain Pfam domains (Mistry et al. 2021) and InterPro entries. CAZymes were separately annotated with dbCAN3 (Zheng et al. 2023). rDNA genes were annotated using RNAmmer (Lagesen et al. 2007). SPs were annotated following the method of Pellegrin et al. (2015). We considered SP proteins as SSPs when their length was equal to or lower than 300 aa, as in the work by Pellegrin et al. (2015).
TE genomic distribution analyses
To test the interplay between gene density and TE densities, we subdivided the T. panzhihuanense nuclear genome into nonoverlapping windows of 50 kb using BEDTools makewindows (Quinlan and Hall 2010) and calculated the proportion of base pairs occupied by genes and transposons for each interval.
To detect genomic regions significantly enriched (TE hotspots) and depleted (TE coldspots) in TEs, we applied a binomial test on the number of base pairs occupied by transposons in genomic sliding windows of 20 kb with a window step size of 5 kb. For each window, we computed the TE coverage using BEDTools coverage and compared the observed number with the genome-wide average estimation computed across all windows. For each genomic interval, we separately tested for both significant greater and lower TE content compared with genome-wide estimation as alternative hypotheses, generating two sets of intervals representing genomic regions significantly enriched and depleted in TEs, respectively. P-values were corrected for multiple testing with the Benjamini–Hochberg procedure and a false-discovery rate (FDR) cut-off of 0.01. Because applying a sliding window approach may result in overlapping genomic intervals being annotated as both TE-rich (TE hotspots) and TE-depleted (TE coldspots), we used BEDTools subtract reciprocally on both interval sets to remove overlapping regions. Genes completely falling within TE-enriched or TE-depleted windows were extracted using BEDTools intersect (-f 1).
Identification, classification, and annotation of LTR Gypsy families
We reconstructed T. panzhihuanense Gypsy families from the evolutionary relationships of RT domains of single insertions. RT nucleotide segments >400 nt, and the corresponding protein sequences were retrieved via BLASTX (E-value ≤ 1 × 10⁻⁵) of all LTR insertions against RT domains from GypsyDB (Llorens et al. 2011) and confirmed via BLASTP (E-value ≤ 1 × 10⁻⁵) against the RepeatPep library, retaining only best hits to Gypsy elements.
For phylogenetics, confirmed RT protein sequences were clustered with CD-HIT (-c 0.8), aligned with MAFFT v7.520 (G-INS-i) (Katoh and Standley 2013), and trimmed with trimAl (-gt 0.8) (Capella-Gutiérrez et al. 2009). A maximum likelihood (ML) tree was inferred with IQ-TREE v2.2.2.6 (Minh et al. 2020), using ModelFinder (Kalyaanamoorthy et al. 2017) for model selection and 1000 ultrafast bootstrap replicates (Hoang et al. 2018) for assessing nodal support.
To complement the phylogenetic analyses, we built a network from all-to-all BLASTN (E-value ≤ 1 × 10⁻⁶) of RT nucleotide sequences; alignments <300 bp were excluded. Bit scores were used as edge weights to detect communities with greedy_modularity_communities function of the NetworkX Python package (Hagberg et al. 2008). Gypsy communities were mapped onto the RT phylogeny, and families were defined as well-supported (bootstrap ≥ 75) divergent clades, splitting communities when necessary.
To build consensus sequences representative of the identified families, we recovered all insertions from which the RT segments used in the phylogenetic analyses were derived and aligned them separately with MAFFT v7.520. From these alignments, we generated initial consensus sequences with CIAlign (Tumescheit et al. 2022), refined them using a “blast–extend–extract” process as previously described, and finally assessed their completeness with TE-aid (Goubert et al. 2022).
We classified curated Gypsy families relying on phylogenetic relationships with previously described elements. RT protein domains extracted from each consensus were added to a set of reference Gypsy elements, including known Gypsy clades described in GypsyDB and elements from Novikova et al. (2010), Riccioni et al. (2008), and Payen et al. (2016). To identify representative elements of the six Gypsy lineages described by Payen et al. (2016), we isolated the RT segments from all Gypsy sequences mined by the authors based on BLASTX alignment coordinates, as previously described. All mined Gypsy sequences were then clustered at 80% identity at the protein level using CD-HIT. All sequences were aligned with MAFFT G-INS-I, and gappy positions were removed with trimAl (-gt 0.8). We inferred a ML tree with IQ-TREE together with ModelFinder and 1000 UltraFastBootstrap replicates. Each Gypsy family was assigned to the closest known clade if the bootstrap value was 75 or more.
Classified Gypsy families were used in an additional RepeatMasker analysis in sensitive mode, and results were postprocessed to obtain their genome-wide estimations and repeat landscapes, as previously described. We used the parseRM.pl script to produce a repeat landscape describing the activity of transposons through absolute time using a Tuber-specific neutral substitution rate (see the subsection “Phylogenomics and divergence time estimation”).
To identify solo-LTRs arising from NAHR events, we blasted back (BLASTN, E-value 1 × 10⁻⁵) all insertions against their source consensus sequence and identified alignments that reciprocally cover both the insertion and one of the two LTR regions of the source consensus for at least 90% of their length. If the alignment reciprocally covers the insertion and the whole consensus sequence for 90% of their length, we considered the elements as full-length, and all other instances were considered as degenerated and/or fragmented elements.
Comparative genomics analyses
Phylogenomics and divergence time estimation
We performed species tree inference across a data set of 31 Ascomycete genomes available on NCBI. Species were chosen to have as many calibration points as possible for the divergence time estimation (Supplemental Table S9).
We extracted single-copy orthologous genes from all 31 fungal genomes using BUSCO and the Ascomycota_odb10 reference database. Amino acid and nucleotide sequences of complete and single-copy BUSCO genes present in at least 95% of the species were aligned using MAFFT in auto mode and cleaned of gappy positions with trimAl (-automated1). Single-gene amino acid alignments were then concatenated and subjected to ML tree inference with IQ-TREE, incorporating ModelFinder2 and 1000 UltraFast Bootstrap replicates.
To obtain a reliable time frame for Ascomycota and, specifically, truffle diversification, we applied a Bayesian approach using multiple fossil calibrations as priors on our genome-scale data set and the previously inferred species tree, as implemented in the MCMCTree package (dos Reis and Yang 2019). Specifically, we used 10 fossils with unambiguous phylogenetic placements, fitting a flat distribution between minimum and maximum bounds, and a normal distribution for the root of the tree (split between Taphrinomycotina and Saccharomycotina + Pezizomycotina). All priors are detailed in Supplemental Table S10, along with a deep justification for each fossil in Supplemental Methods. Three runs were performed under an independent rate model, and convergence of the MCMC chains was assessed using Tracer (Rambaut et al. 2018). MCMCTree was run on both amino acid and nucleotide alignments to assess the sensitivity of the analyses to the underlying data set.
To estimate a putative neutral substitution rate for Tuberaceae, we extracted all fourfold degenerate sites from the previously identified Tuberaceae BUSCO genes and concatenated them. LSD2 (To et al. 2016) within IQ-TREE2 was then used to estimate a fixed substitution rate within the Tuberaceae subtree, calibrating all nodes setting as maximum and minimum bound the 95% highest posterior density estimation obtained from MCMCTree analyses on the nucleotide alignment.
Repeat annotation and analyses across additional Pezizales genomes
All Pezizales genomes included in phylogenetic analyses were used in a de novo repeat discovery with RepeatModeler2 and the LTR structure extension. Raw species-specific repeat libraries were used for repeat annotation in each genome with RepeatMasker in sensitive mode to obtain a rough estimation of their repetitive content. The relationships between genome size and TE content were assessed with correlation analyses to the raw data and the data corrected for shared evolutionary histories using PICs with the pic function of Ape R (R Core Team 2021) package (Paradis et al. 2004). Phylogenetic signal was tested with Pagel's λ (Pagel 1999) with the phylosig function of the Phytools R package (Revell 2024).
To characterize the distribution of different Gypsy clades across Pezizales diversity, we classified all Gypsy consensus sequences following the same approach used to classify Gypsy families isolated from the T. panzhihuanense genome after adding the T. panzhihuanense–classified Gypsy families to the reference RT database.
Classified consensus sequences mined from Tuberaceae species were subjected to manual curation following a “blast–extend–extract” process as previously described. Curated consensus was used in an additional RepeatMasker analysis on their source genome to obtain an accurate estimation of their genomic occurrence. RT fragments >400 nt were extracted from the annotation (BLASTX; E-value 1 × 10⁻⁵), and elements coming from Prometheus, Tmt1, and TCN-like clades were separately aligned via MAFFT in G-INS-i mode and, after removing gappy positions with trimAl (-gt 0.8), were subjected to phylogenetic inference with FastTree v2.1.10 (Price et al. 2010) under a GTR + Gamma model.
Gene-family evolutionary analyses and syntenic genomic region detection
Syntenic genomic regions between T. panzhihuanense and the 16 longest scaffolds of T. magnatum (GCA_003182015.1) and between T. panzhihuanense and M. sextelata (GCF_024521635.1) genomes were identified with GENESPACE v1.3.1 under default parameters (Lovell et al. 2022) after excluding the identified rDNA contigs of T. panzhihuanense. A riparian plot was generated from inferred syntenic blocks with the plot_riparian function, with the length of the block proportional to its actual length in base pairs. Syntenic and nonsyntenic orthologs were extracted from GENESPACE results with the query_pangenes function.
We studied gene-family turnover dynamics during Pezizales diversification using CAFE5 (Mendes et al. 2020) and the corresponding nucleotide divergence time estimation as a background tree. Gene-family counts were obtained by inferring orthogroups from the proteomes of all species with OrthoFinder v2.5.5 (Emms and Kelly 2019) with diamond (Buchfink et al. 2015) in ultrasensitive mode (-S diamcond_ultra_sens). Because no gene annotation was freely available for V. conica (GCA_033030425.1) and G. esculenta (GCA_038503075.1), we performed a de novo annotation using Funannotate following the previously described procedure for T. panzhihuanense. Briefly, RNA-seq reads were downloaded from the NCBI Sequence Read Archive (SRA; https://www.ncbi.nlm.nih.gov/sra) (under accession numbers SRR12605086 and SRR5491178 for V. conica and G. esculenta, respectively), and the transcriptomes were assembled with Trinity v2.1.1 (default mode). Assembled transcripts and previously described protein evidence (see the Methods section “Gene annotation”) were then supplied to Funannotate as external evidence. Gene-family turnover analyses were performed, estimating an error model and specifying two separate lambdas (λ) for the tree: one for Tuberaceae and one for other Pezizales branches.
Spatial relationships between TEs, syntenic genomic regions, and fast-evolving gene families
To explore the spatial relationships between TEs, synteny, and gene-family evolution, we looked at the genomic occurrence of transposons based on the RepeatMasker analyses obtained with the curated TE library on the T. panzhihuanense genome. After extracting syntenic and nonsyntenic genomic regions between T. panzhihuanense and M. sextelata from GENESPACE results, we compared their gene and TE density across nonoverlapping genomic windows of 50 kb. Accumulation of TEs in significantly expanded/contracted gene families was tested by looking at the percentage of base pairs annotated as TEs across exons, introns, and 5 kb flanking regions compared with the rest of the genes.
Data access
The sequencing data generated in this study have been submitted to the NCBI BioProject database (https://www.ncbi.nlm.nih.gov/bioproject/) under accession number PRJNA1110184. The T. panzhihuanense genome assembly, all gene annotations, and the TE libraries and orthogroup clusters described in this article are available on Figshare (https://figshare.com/s/a435a5ac8371bcea2cae) and as Supplemental Data.
Competing interest statement
The authors declare no competing interests.
Acknowledgments
We thank the China Scholarship Council–University of Bologna Cooperation Scholarship. Part of the research was completed thanks to the Master of Science course in Microbiology, China, with the relevant degree thesis (Biological Traits of Occurrence of Chinese Truffles [Tuber spp.] in the Natural Truffle Producing Area of Jinsha River Basin, China), confidential until June 2025 at https://www.cnki.net/index/. The topic was selected as one of the 2016–2017 Sichuan Agricultural University Subject Construction Dual Support Projects (special funding projects for outstanding young researchers) led by Y.H. and X.Z. This work was partially supported by the “Canziani Bequest” fund from the University of Bologna (grant no. A.31.CANZELSEW) funded to F.G. and the “Ricerca Fondamentale Orientata” (RFO) funding from the University of Bologna to F.G. A.T. contributed to the present publication while attending the PhD program in Sustainable Development and Climate Change at the University School for Advanced Studies IUSS Pavia, cycle XXXVIII, with the support of a scholarship financed by the ministerial decree no. 351 of April 9, 2022, based on the NRRP, funded by the European Union, NextGenerationEU, mission 4 “education and research,” component 1 “enhancement of the offer of educational services: from nurseries to universities,” investment 4.1 “extension of the number of research doctorates and innovative doctorates for public administration and cultural heritage.”
Author contributions: Y.H., X.Z., J.M., J.V., F.G., and A.Z. designed the study. Y.H., K.X., Y.C., and X.Z. sampled the specimens and prepared the materials used for genomic and transcriptomic extraction. Y.H., K.X., and Y.C. performed RNA extraction. J.V. performed genome assembly and gene annotations. J.M. performed transposable elements and comparative genomic analyses. A.T. and O.R.S. selected the species and the fossils for divergence time estimation. J.M. and A.T. performed divergence time estimation. O.R.S. and F.G. supervised the analyses. J.M., J.V., Y.H., and A.T. prepared the figures and Supplemental Materials. J.M., J.V., A.T., Y.H., F.P., O.R.S., F.G., and A.Z. interpreted the results. J.V., J.M., and Y.H. wrote the first version of the manuscript. All authors critically revised the manuscript.
Notes
[1] Supplementary material [Supplemental material is available for this article.]
[2] Article published online before print. Article, supplemental material, and publication date are at https://www.genome.org/cgi/doi/10.1101/gr.280368.124.
References
- ↵Aguileta G, Hood ME, Refrégier G, Giraud T. 2009. Chapter 3 genome evolution in plant pathogenic and symbiotic fungi. In Advances in botanical research (ed. Kuete V, Jacquot JP), pp. 151–193. Academic Press, London.
- ↵Álvarez-Carretero S, Tamuri AU, Battini M, Nascimento FF, Carlisle E, Asher RJ, Yang Z, Donoghue PCJ, dos Reis M. 2022. A species-level timeline of mammal evolution integrating phylogenomic data. Nature 602: 263–267. 10.1038/s41586-021-04341-1
- ↵Benton MJ, Wilf P, Sauquet H. 2022. The angiosperm terrestrial revolution and the origins of modern biodiversity. New Phytol 233: 2017–2035. 10.1111/nph.17822
- ↵Bolger AM, Lohse M, Usadel B. 2014. Trimmomatic: a flexible trimmer for Illumina sequence data. Bioinformatics 30: 2114–2120. 10.1093/bioinformatics/btu170
- ↵Bonito GM, Smith ME. 2016. General systematic position of the truffles: evolutionary theories. In True truffle (Tuber spp.) in the world: soil biology, Vol. 47 (ed. Zambonelli A, ). Springer, Cham, Switzerland.
- ↵Bonito G, Smith ME, Nowak M, Healy RA, Guevara G, Cázares E, Kinoshita A, Nouhra ER, Domínguez LS, 2013. Historical biogeography and diversification of truffles in the Tuberaceae and their newly identified southern hemisphere sister lineage. PLoS One 8: e52765. 10.1371/journal.pone.0052765
- ↵Bourque G, Burns KH, Gehring M, Gorbunova V, Seluanov A, Hammell M, Imbeault M, Izsvák Z, Levin HL, Macfarlan TS, 2018. Ten things you should know about transposable elements. Genome Biol 19: 199. 10.1186/s13059-018-1577-z
- ↵Bradshaw MJ, Aime MC, Rokas A, Maust A, Moparthi S, Jellings K, Pane AM, Hendricks D, Pandey B, Li Y, 2023. Extensive intragenomic variation in the internal transcribed spacer region of fungi. iScience 26: 107317. 10.1016/j.isci.2023.107317
- ↵Brown MR, Gonzalez de La Rosa PM, Blaxter M. 2025. tidk: a toolkit to rapidly identify telomeric repeats from genomic datasets. Bioinformatics 41: btaf049. 10.1093/bioinformatics/btaf049
- ↵Brundrett MC, Tedersoo L. 2018. Evolutionary history of mycorrhizal symbioses and global host plant diversity. New Phytol 220: 1108–1115. 10.1111/nph.14976
- ↵Buchfink B, Xie C, Huson DH. 2015. Fast and sensitive protein alignment using DIAMOND. Nat Methods 12: 59–60. 10.1038/nmeth.3176
- ↵Buckley RM, Kortschak RD, Raison JM, Adelson DL. 2017. Similar evolutionary trajectories for retrotransposon accumulation in mammals. Genome Biol Evol 9: 2336–2353. 10.1093/gbe/evx179
- ↵Capella-Gutiérrez S, Silla-Martínez JM, Gabaldón T. 2009. trimAl: a tool for automated alignment trimming in large-scale phylogenetic analyses. Bioinformatics 25: 1972–1973. 10.1093/bioinformatics/btp348
- ↵Carrasco-Valenzuela T, Marino A, Storer JM, Bonnici I, Mazzoni CJ, Fontaine MC, Haudry A, Boulesteix M, Fiston-Lavier A-S. 2025. Manual versus automatic annotation of transposable elements: case studies in Drosophila melanogaster and Aedes albopictus, balancing accuracy and biological relevance. bioRxiv 10.1101/2025.01.10.632341
- ↵Castanera R, López-Varas L, Borgognone A, LaButti K, Lapidus A, Schmutz J, Grimwood J, Pérez G, Pisabarro AG, Grigoriev IV, 2016. Transposable elements versus the fungal genome: impact on whole-genome architecture and transcriptional profiles. PLoS Genet 12: e1006108. 10.1371/journal.pgen.1006108
- ↵Cheng H, Concepcion GT, Feng X, Zhang H, Li H. 2021. Haplotype-resolved de novo assembly using phased assembly graphs with hifiasm. Nat Methods 18: 170–175. 10.1038/s41592-020-01056-5
- ↵Cicconardi F, Milanetti E, Pinheiro de Castro EC, Mazo-Vargas A, Van Belleghem SM, Ruggieri AA, Rastas P, Hanly J, Evans E, Jiggins CD, 2023. Evolutionary dynamics of genome size and content during the adaptive radiation of Heliconiini butterflies. Nat Commun 14: 5620. 10.1038/s41467-023-41412-5
- ↵Copley SD. 2020. Evolution of new enzymes by gene duplication and divergence. FEBS J 287: 1262–1283. 10.1111/febs.15299
- ↵Deng X, Liu P, Liu C, Wang Y. 2013. A new white truffle species, Tuber panzhihuanense from China. Mycol Prog 12: 557–561. 10.1007/s11557-012-0862-6
- ↵dos Reis M, Yang Z. 2019. Bayesian molecular clock dating using genome-scale datasets. In Evolutionary genomics: statistical and computational methods (ed. Anisimova M), pp. 309–330. Springer, New York.
- ↵Dyrka W, Lamacchia M, Durrens P, Kobe B, Daskalov A, Paoletti M, Sherman DJ, Saupe SJ. 2014. Diversity and variability of NOD-like receptors in fungi. Genome Biol Evol 6: 3137–3158. 10.1093/gbe/evu251
- ↵Emms DM, Kelly S. 2019. OrthoFinder: phylogenetic orthology inference for comparative genomics. Genome Biol 20: 238. 10.1186/s13059-019-1832-y
- ↵Flynn JM, Hubley R, Goubert C, Rosen J, Clark AG, Feschotte C, Smit AF. 2020. Repeatmodeler2 for automated genomic discovery of transposable element families. Proc Natl Acad Sci 117: 9451–9457. 10.1073/pnas.1921046117
- ↵Fouché S, Badet T, Oggenfuss U, Plissonneau C, Francisco CS, Croll D. 2020. Stress-driven transposable element de-repression dynamics and virulence evolution in a fungal pathogen. Mol Biol Evol 37: 221–239. 10.1093/molbev/msz216
- ↵Galagan JE, Selker EU. 2004. RIP: the evolutionary cost of genome defense. Trends Genet 20: 417–423. 10.1016/j.tig.2004.07.007
- ↵Ganley ARD, Kobayashi T. 2011. Monitoring the rate and dynamics of concerted evolution in the ribosomal DNA repeats of Saccharomyces cerevisiae using experimental evolution. Mol Biol Evol 28: 2883–2891. 10.1093/molbev/msr117
- ↵Gao X, Hou Y, Ebina H, Levin HL, Voytas DF. 2008. Chromodomains direct integration of retrotransposons to heterochromatin. Genome Res 18: 359–369. 10.1101/gr.7146408
- ↵Garcia S, Kovarik A, Maiwald S, Mann L, Schmidt N, Pascual-Díaz JP, Vitales D, Weber B, Heitkam T. 2024. The dynamic interplay between ribosomal DNA and transposable elements: a perspective from genomics and cytogenetics. Mol Biol Evol 41: msae025. 10.1093/molbev/msae025
- ↵Goubert C, Craig RJ, Bilat AF, Peona V, Vogan AA, Protasio AV. 2022. A beginner's guide to manual curation of transposable elements. Mob DNA 13: 7. 10.1186/s13100-021-00259-7
- ↵Grabherr MG, Haas BJ, Yassour M, Levin JZ, Thompson DA, Amit I, Adiconis X, Fan L, Raychowdhury R, Zeng Q, 2011. Full-length transcriptome assembly from RNA-seq data without a reference genome. Nat Biotechnol 29: 644–652. 10.1038/nbt.1883
- ↵Graziosi S, Puliga F, Iotti M, Amicucci A, Zambonelli A. 2024. In vitro interactions between Bradyrhizobium spp. and Tuber magnatum mycelium. Environ Microbiol Rep 16: e13271. 10.1111/1758-2229.13271
- ↵Hagberg AA, Schult DA, Swart PJ. 2008. Exploring network structure, dynamics, and function using NetworkX. In Proceedings of the 7th Python in Science Conference (SciPy2008) (ed. Varoquaux G, ), Pasadena, CA, pp. 11–15.
- ↵Han M, Wang Q, Baiyintala, Wuhanqimuge. 2019. The whole-genome sequence analysis of Morchella sextelata. Sci Rep 9: 15376. 10.1038/s41598-019-51831-4
- ↵Hane JK, Rouxel T, Howlett BJ, Kema GH, Goodwin SB, Oliver RP. 2011. A novel mode of chromosomal evolution peculiar to filamentous ascomycete fungi. Genome Biol 12: R45. 10.1186/gb-2011-12-5-r45
- ↵Hiltunen M, Ament-Velásquez SL, Johannesson H. 2021. The assembled and annotated genome of the fairy-ring fungus Marasmius oreades. Genome Biol Evol 13: evab126. 10.1093/gbe/evab126
- ↵Hoang DT, Chernomor O, von Haeseler A, Minh BQ, Vinh LS. 2018. UFBoot2: improving the ultrafast bootstrap approximation. Mol Biol Evol 35: 518–522. 10.1093/molbev/msx281
- ↵Hori Y, Shimamoto A, Kobayashi T. 2021. The human ribosomal DNA array is composed of highly homogenized tandem clusters. Genome Res 31: 1971–1982. 10.1101/gr.275838.121
- ↵Hori Y, Engel C, Kobayashi T. 2023. Regulation of ribosomal RNA gene copy number, transcription and nucleolus organization in eukaryotes. Nat Rev Mol Cell Biol 24: 414–429. 10.1038/s41580-022-00573-9
- ↵Iyer LM, Zhang D, de Souza RF, Pukkila PJ, Rao A, Aravind L. 2014. Lineage-specific expansions of TET/JBP genes and a new class of DNA transposons shape fungal genomic and epigenetic landscapes. Proc Natl Acad Sci 111: 1676–1683. 10.1073/pnas.1321818111
- ↵Jarvis ED, Mirarab S, Aberer AJ, Li B, Houde P, Li C, Ho SYW, Faircloth BC, Nabholz B, Howard JT, 2014. Whole-genome analyses resolve early branches in the tree of life of modern birds. Science 346: 1320–1331. 10.1126/science.1253451
- ↵Jones P, Binns D, Chang HY, Fraser M, Li W, McAnulla C, McWilliam H, Maslen J, Mitchell A, Nuka G, 2014. InterProScan 5: genome-scale protein function classification. Bioinformatics 30: 1236–1240. 10.1093/bioinformatics/btu031
- ↵Kalyaanamoorthy S, Minh BQ, Wong TKF, von Haeseler A, Jermiin LS. 2017. ModelFinder: fast model selection for accurate phylogenetic estimates. Nat Methods 14: 587–589. 10.1038/nmeth.4285
- ↵Katoh K, Standley DM. 2013. MAFFT multiple sequence alignment software version 7: improvements in performance and usability. Mol Biol Evol 30: 772–780. 10.1093/molbev/mst010
- ↵Kent TV, Uzunović J, Wright SI. 2017. Coevolution between transposable elements and recombination. Philos Trans R Soc Lond B Biol Sci 372: 20160458. 10.1098/rstb.2016.0458
- ↵Kim JH, Nagaraja R, Ogurtsov AY, Noskov VN, Liskovykh M, Lee H-S, Hori Y, Kobayashi T, Hunter K, Schlessinger D, 2024. Comparative analysis and classification of highly divergent mouse rDNA units based on their intergenic spacer (IGS) variability. NAR Genom Bioinform 6: lqae070. 10.1093/nargab/lqae070
- ↵Kohler A, Kuo A, Nagy L, Morin E, Barry KW, Buscot F, Canbäck B, Choi C, Cichocki N, Clum A, 2015. Convergent losses of decay mechanisms and rapid turnover of symbiosis genes in mycorrhizal mutualists. Nat Genet 47: 410–415. 10.1038/ng.3223
- ↵Korf I. 2004. Gene finding in novel genomes. BMC Bioinformatics 5: 59. 10.1186/1471-2105-5-59
- ↵Laetsch DR, Blaxter ML. 2017. BlobTools: interrogation of genome assemblies. F1000Res 6: 1287. 10.12688/f1000research.12232.1
- ↵Lagesen K, Hallin P, Rødland EA, Stærfeldt HH, Rognes T, Ussery DW. 2007. RNAmmer: consistent and rapid annotation of ribosomal RNA genes. Nucleic Acids Res 35: 3100–3108. 10.1093/nar/gkm160
- ↵Lemmond B, Sow A, Bonito G, Smith ME. 2023. Accidental cultivation of the European truffle Tuber brumale in north American truffle orchards. Mycorrhiza 33: 221–228. 10.1007/s00572-023-01114-8
- ↵Leonardi P, Baroni R, Puliga F, Iotti M, Salerni E, Perini C, Zambonelli A. 2021. Co-occurrence of true truffle mycelia in Tuber magnatum fruiting sites. Mycorrhiza 31: 389–394. 10.1007/s00572-021-01030-9
- ↵Li H. 2018. Minimap2: pairwise alignment for nucleotide sequences. Bioinformatics 34: 3094–3100. 10.1093/bioinformatics/bty191
- ↵Llorens C, Futami R, Covelli L, Domínguez-Escribá L, Viu JM, Tamarit D, Aguilar-Rodríguez J, Vicente-Ripolles M, Fuster G, Bernet GP, 2011. The gypsy database (GyDB) of mobile genetic elements: release 2.0. Nucleic Acids Res 39: D70–D74. 10.1093/nar/gkq1061
- ↵Lomsadze A, Ter-Hovhannisyan V, Chernoff YO, Borodovsky M. 2005. Gene identification in novel eukaryotic genomes by self-training algorithm. Nucleic Acids Res 33: 6494–6506. 10.1093/nar/gki937
- ↵Lovell JT, Sreedasyam A, Schranz ME, Wilson M, Carlson JW, Harkess A, Emms D, Goodstein DM, Schmutz J. 2022. GENESPACE tracks regions of interest and gene copy number variation across multiple genomes. eLife 11: e78526. 10.7554/eLife.78526
- ↵Majoros WH, Pertea M, Salzberg SL. 2004. TigrScan and GlimmerHMM: two open-source ab initio eukaryotic gene-finders. Bioinformatics 20: 2878–2879. 10.1093/bioinformatics/bth315
- ↵Mapleson D, Garcia Accinelli G, Kettleborough G, Wright J, Clavijo BJ. 2017. KAT: a k-mer analysis toolkit to quality control NGS datasets and genome assemblies. Bioinformatics 33: 574–576. 10.1093/bioinformatics/btw663
- ↵Marín I, Lloréns C. 2000. Ty3/gypsy retrotransposons: description of new Arabidopsis thaliana elements and evolutionary perspectives derived from comparative genomic data. Mol Biol Evol 17: 1040–1049. 10.1093/oxfordjournals.molbev.a026385
- ↵Martelossi J, Iannello M, Ghiselli F, Luchetti A. 2024. Widespread HCD-tRNA derived SINEs in bivalves rely on multiple LINE partners and accumulate in genic regions. Mob DNA 15: 22. 10.1186/s13100-024-00332-x
- ↵Martin F, Tunlid A. 2009. The ectomycorrhizal symbiosis: a marriage of convenience. In Plant relationships: the mycota, Vol. 5 (ed. Deising HB), pp. 237–257. Springer, Berlin.
- ↵Martin F, Aerts A, Ahrén D, Brun A, Danchin EGJ, Duchaussoy F, Gibon J, Kohler A, Lindquist E, Pereda V, 2008. The genome of Laccaria bicolor provides insights into mycorrhizal symbiosis. Nature 452: 88–92. 10.1038/nature06556
- ↵Martin F, Kohler A, Murat C, Balestrini R, Coutinho PM, Jaillon O, Montanini B, Morin E, Noel B, Percudani R, 2010. Périgord black truffle genome uncovers evolutionary origins and mechanisms of symbiosis. Nature 464: 1033–1038. 10.1038/nature08867
- ↵Mello A, Murat C, Bonfante P. 2006. Truffles: much more than a prized and local fungal delicacy. FEMS Microbiol Lett 260: 1–8. 10.1111/j.1574-6968.2006.00252.x
- ↵Mendes FK, Vanderpool D, Fulton B, Hahn MW. 2020. CAFE 5 models variation in evolutionary rates among gene families. Bioinformatics 36: 5516–5518. 10.1093/bioinformatics/btaa1022
- ↵Minh BQ, Schmidt HA, Chernomor O, Schrempf D, Woodhams MD, Von Haeseler A, Lanfear R. 2020. IQ-TREE 2: new models and efficient methods for phylogenetic inference in the genomic era. Mol Biol Evol 37: 1530–1534. 10.1093/molbev/msaa015
- ↵Mistry J, Chuguransky S, Williams L, Qureshi M, Salazar GA, Sonnhammer ELL, Tosatto SCE, Paladin L, Raj S, Richardson LJ, 2021. Pfam: the protein families database in 2021. Nucleic Acids Res 49: D412–D419. 10.1093/nar/gkaa913
- ↵Miyauchi S, Kiss E, Kuo A, Drula E, Kohler A, Sánchez-García M, Morin E, Andreopoulos B, Barry KW, Bonito G, 2020. Large-scale genome sequencing of mycorrhizal fungi provides insights into the early evolution of symbiotic traits. Nat Commun 11: 5125. 10.1038/s41467-020-18795-w
- ↵Monaco P, Naclerio G, Mello A, Bucci A. 2022. Role and potentialities of bacteria associated with Tuber magnatum: a mini-review. Front Microbiol 13: 1017089. 10.3389/fmicb.2022.1017089
- ↵Montagna M, Tong KJ, Magoga G, Strada, Tintori A, Ho SYW, Lo N. 2019. Recalibration of the insect evolutionary time scale using monte San Giorgio fossils suggests survival of key lineages through the end-Permian extinction. Proc Biol Sci 286: 20191854. 10.1098/rspb.2019.1854
- ↵Montanini B, Chen PY, Morselli M, Jaroszewicz A, Lopez D, Martin F, Ottonello S, Pellegrini M. 2014. Non-exhaustive DNA methylation-mediated transposon silencing in the black truffle genome, a complex fungal genome with massive repeat element content. Genome Biol 15: 411. 10.1186/s13059-014-0411-5
- ↵Mosè M, Berkeley MR, Seppey M, Simão FA, Zdobnov EM. 2021. BUSCO update: novel and streamlined workflows along with broader and deeper phylogenetic coverage for scoring of eukaryotic, prokaryotic, and viral genomes. Mol Biol Evol 38: 4647–4654. 10.1093/molbev/msab199
- ↵Murat C, Kuo A, Barry KW, Clum A, Dockter RB, Fauchery L, Iotti M, Kohler A, LaButti K, Lindquist EA, 2018a. Draft genome sequence of Tuber borchii Vittad., a whitish edible truffle. Genome Announc 6: e00537-18. 10.1128/genomeA.00537-18
- ↵Murat C, Payen T, Noel B, Kuo A, Morin E, Chen J, Kohler A, Krizsán K, Balestrini R, Da Silva C, 2018b. Pezizomycetes genomes reveal the molecular basis of ectomycorrhizal truffle lifestyle. Nat Ecol Evol 2: 1956–1965. 10.1038/s41559-018-0710-4
- ↵Muszewska A, Steczkiewicz K, Stepniewska-Dziubinska M, Ginalski K. 2019. Transposable elements contribute to fungal genes and impact fungal lifestyle. Sci Rep 9: 4307. 10.1038/s41598-019-40965-0
- ↵Neumann P, Navrátilová A, Koblížková A, Kejnovský E, Hřibová E, Hobza R, Widmer A, Doležel J, Macas J. 2011. Plant centromeric retrotransposons: a structural and cytogenetic perspective. Mob DNA 2: 4. 10.1186/1759-8753-2-4
- ↵Novikova O, Smyshlyaev G, Blinov A. 2010. Evolutionary genomics revealed interkingdom distribution of Tcn1-like chromodomain-containing gypsy LTR retrotransposons among fungi and plants. BMC Genomics 11: 231. 10.1186/1471-2164-11-231
- ↵Oggenfuss U, Badet T, Wicker T, Hartmann FE, Singh NK, Abraham L, Karisto P, Vonlanthen T, Mundt C, McDonald BA, 2021. A population-level invasion by transposable elements triggers genome expansion in a fungal pathogen. eLife 10: e69249. 10.7554/eLife.69249
- ↵Pagel M. 1999. Inferring the historical patterns of biological evolution. Nature 401: 877–884. 10.1038/44766
- ↵Paradis E, Claude J, Strimmer K. 2004. APE: analyses of phylogenetics and evolution in R language. Bioinformatics 20: 289–290. 10.1093/bioinformatics/btg412
- ↵Payen T, Murat C, Martin FM. 2016. Reconstructing the evolutionary history of gypsy retrotransposons in the Périgord black truffle (Tuber melanosporum Vittad.). Mycorrhiza 26: 553–563. 10.1007/s00572-016-0692-5
- ↵Pellegrin C, Morin E, Martin FM, Veneault-Fourrey C. 2015. Comparative analysis of secretomes from ectomycorrhizal fungi with an emphasis on small-secreted proteins. Front Microbiol 6: 1278. 10.3389/fmicb.2015.01278
- ↵Peona V, Blom MPK, Xu L, Burri R, Sullivan S, Bunikis I, Liachko I, Haryoko T, Jønsson KA, Zhou Q, 2021. Identifying the causes and consequences of assembly gaps using a multiplatform genome assembly of a bird-of-paradise. Mol Ecol Resour 21: 263–286. 10.1111/1755-0998.13252
- ↵Peona V, Martelossi J, Almojil D, Bocharkina J, Brännström I, Brown M, Cang A, Carrasco-Valenzuela T, DeVries J, Doellman M, 2024. Teaching transposon classification as a means to crowd source the curation of repeat annotation: a tardigrade perspective. Mob DNA 15: 10. 10.1186/s13100-024-00319-8
- ↵Poma A, Pacioni G, Ranalli R, Miranda M. 1998. Ploidy and chromosomal number in Tuber aestivum. FEMS Microbiol Lett 167: 101–105. 10.1111/j.1574-6968.1998.tb13214.x
- ↵Poma A, Venora G, Miranda M, Pacioni G. 2002. The karyotypes of three Tuber species (Pezizales, Ascomycota). Caryologia 55: 307–313. 10.1080/00087114.2002.10797881
- ↵Price MN, Dehal PS, Arkin AP. 2010. FastTree 2: approximately maximum-likelihood trees for large alignments. PLoS One 5: e9490. 10.1371/journal.pone.0009490
- ↵Quinlan AR, Hall IM. 2010. BEDTools: a flexible suite of utilities for comparing genomic features. Bioinformatics 26: 841–842. 10.1093/bioinformatics/btq033
- ↵Raffaele S, Farrer RA, Cano LM, Studholme DJ, MacLean D, Thines M, Jiang RHY, Zody MC, Kunjeti SG, Donofrio NM, 2010. Genome evolution following host jumps in the Irish potato famine pathogen lineage. Science 330: 1540–1543. 10.1126/science.1193070
- ↵Rajashekar B, Kohler A, Johansson T, Martin F, Tunlid A, Ahrén D. 2009. Expansion of signal pathways in the ectomycorrhizal fungus Laccaria bicolor: evolution of nucleotide sequences and expression patterns in families of protein kinases and RAS small GTPases. New Phytol 183: 365–379. 10.1111/j.1469-8137.2009.02860.x
- ↵Rambaut A, Drummond AJ, Xie D, Baele G, Suchard MA. 2018. Posterior summarization in Bayesian phylogenetics using tracer 1.7. Syst Biol 67: 901–904. 10.1093/sysbio/syy032
- ↵Ramírez-Barahona S, Sauquet H, Magallón S. 2020. The delayed and geographically heterogeneous diversification of flowering plant families. Nat Ecol Evol 4: 1232–1238. 10.1038/s41559-020-1241-3
- ↵Ranallo-Benavidez TR, Jaron KS, Schatz MC. 2020. GenomeScope 2.0 and Smudgeplot for reference-free profiling of polyploid genomes. Nat Commun 11: 1432. 10.1038/s41467-020-14998-3
- ↵R Core Team. 2021. R: a language and environment for statistical computing. R Foundation for Statistical Computing, Vienna. https://www.R-project.org/.
- ↵Revell LJ. 2024. phytools 2.0: an updated R ecosystem for phylogenetic comparative methods (and other things). PeerJ 12: e16505. 10.7717/peerj.16505
- ↵Rhie A, Walenz BP, Koren S, Phillippy AM. 2020. Merqury: reference-free quality, completeness, and phasing assessment for genome assemblies. Genome Biol 21: 245. 10.1186/s13059-020-02134-9
- ↵Rhie A, McCarthy SA, Fedrigo O, Damas J, Formenti G, Koren S, Uliano-Silva M, Chow W, Fungtammasan A, Kim J, 2021. Towards complete and error-free genome assemblies of all vertebrate species. Nature 592: 737–746. 10.1038/s41586-021-03451-0
- ↵Riccioni C, Rubini A, Belfiori B, Passeri V, Paolocci F, Arcioni S. 2008. Tmt1: the first LTR-retrotransposon from a Tuber spp. Curr Genet 53: 23–34. 10.1007/s00294-007-0155-9
- ↵Robicheau BM, Susko E, Harrigan AM, Snyder M. 2017. Ribosomal RNA genes contribute to the formation of pseudogenes and junk DNA in the human genome. Genome Biol Evol 9: 380–397. 10.1093/gbe/evw307
- ↵Ruggieri AA, Livraghi L, Lewis JJ, Evans E, Cicconardi F, Hebberecht L, Ortiz-Ruiz Y, Montgomery SH, Ghezzi A, Rodriguez-Martinez JA, 2022. A butterfly pan-genome reveals that a large amount of structural variation underlies the evolution of chromatin accessibility. Genome Res 32: 1862–1875. 10.1101/gr.276839.122
- ↵Sato H. 2024. The evolution of ectomycorrhizal symbiosis in the late cretaceous is a key driver of explosive diversification in Agaricomycetes. New Phytol 241: 444–460. 10.1111/nph.19055
- ↵Schaack S, Gilbert C, Feschotte C. 2010. Promiscuous DNA: horizontal transfer of transposable elements and why it matters for eukaryotic evolution. Trends Ecol Evol 25: 537–546. 10.1016/j.tree.2010.06.001
- ↵Schmidt SM, Houterman PM, Schreiver I, Ma L, Amyotte S, Chellappan B, Boeren S, Takken FLW, Rep M. 2013. MITEs in the promoters of effector genes allow prediction of novel virulence genes in Fusarium oxysporum. BMC Genomics 14: 119. 10.1186/1471-2164-14-119
- ↵Smit AFA, Hubley R, Green P. 2013–2015. RepeatMasker Open-4.0. http://www.repeatmasker.org.
- ↵Stanke M, Diekhans M, Baertsch R, Haussler D. 2008. Using native and syntenically mapped cDNA alignments to improve de novo gene finding. Bioinformatics 24: 637–644. 10.1093/bioinformatics/btn013
- ↵Sundaram S, Kim SJ, Suzuki H, Mcquattie CJ, Hiremath ST, Podila GK. 2001. Isolation and characterization of a symbiosis-regulated ras from the ectomycorrhizal fungus Laccaria bicolor. Mol Plant Microbe Interact 14: 618–628. 10.1094/MPMI.2001.14.5.618
- ↵Tedersoo L, May TW, Smith ME. 2010. Ectomycorrhizal lifestyle in fungi: global diversity, distribution, and evolution of phylogenetic lineages. Mycorrhiza 20: 217–263. 10.1007/s00572-009-0274-x
- ↵Testa AC, Hane JK, Ellwood SR, Oliver RP. 2015. CodingQuarry: highly accurate hidden Markov model gene prediction in fungal genomes using RNA-seq transcripts. BMC Genomics 16: 170. 10.1186/s12864-015-1344-4
- ↵Thon MR, Pan H, Diener S, Papalas J, Taro A, Mitchell TK, Dean RA. 2006. The role of transposable element clusters in genome evolution and loss of synteny in the rice blast fungus Magnaporthe oryzae. Genome Biol 7: R16. 10.1186/gb-2006-7-2-r16
- ↵To TH, Jung M, Lycett S, Gascuel O. 2016. Fast dating using least-squares criteria and algorithms. Syst Biol 65: 82–97. 10.1093/sysbio/syv068
- ↵Treindl AD, Stapley J, Winter DJ, Cox MP, Leuchtmann A. 2021. Chromosome-level genomes provide insights into genome evolution, organization and size in Epichloe fungi. Genomics 113: 4267–4275. 10.1016/j.ygeno.2021.11.009
- ↵Tumescheit C, Firth AE, Brown K. 2022. CIAlign: a highly customisable command line tool to clean, interpret and visualise multiple sequence alignments. PeerJ 10: e12983. 10.7717/peerj.12983
- ↵UniProt Consortium. 2023. UniProt: the Universal Protein Knowledgebase in 2023. Nucleic Acids Res 51(D1): D523–D531. 10.1093/nar/gkac1052
- ↵Wan S, Zheng Y, Tang L, Wang R, Liu P, Yu F. 2015. Diversity of culturable bacteria associated with Tuber panzhihuanense–Pinus armandii ectomycorrhizosphere soil. Plant Divers 37: 861–870. 10.7677/ynzwyj201515032
- ↵Wicker T, Sabot F, Hua-Van A, Bennetzen JL, Capy P, Chalhoub B, Flavell A, Leroy P, Morgante M, Panaud O, 2007. A unified classification system for eukaryotic transposable elements. Nat Rev Genet 8: 973–982. 10.1038/nrg2165
- ↵Wong WY, Simakov O. 2019. RepeatCraft: a meta-pipeline for repetitive element de-fragmentation and annotation. Bioinformatics 35: 1051–1052. 10.1093/bioinformatics/bty745
- ↵Wood DE, Lu J, Langmead B. 2019. Improved metagenomic analysis with Kraken 2. Genome Biol 20: 257. 10.1186/s13059-019-1891-0
- ↵Yang K, Tian J, Keller NP. 2022. Post-translational modifications drive secondary metabolite biosynthesis in Aspergillus: a review. Environ Microbiol 24: 2857–2881. 10.1111/1462-2920.16034
- ↵Yao Y, Wei J, Zhuang W, Wei T, Li Y, Wei X, Deng H, Liu D, Cai L, Li J, 2020. Threatened species list of China's macrofungi. Biodivers Sci 28: 20–25. 10.17520/biods.2019174
- ↵Yashiroda H, Tanaka K. 2003. But1 and But2 proteins bind to Uba3, a catalytic subunit of E1 for neddylation, in fission yeast. Biochem Biophys Res Commun 311: 691–695. 10.1016/j.bbrc.2003.10.058
- ↵Zheng J, Ge Q, Yan Y, Zhang X, Huang L, Yin Y. 2023. dbCAN3: automated carbohydrate-active enzyme and substrate annotation. Nucleic Acids Res 51: W115–W121. 10.1093/nar/gkad328
- ↵Zhuang W, Li Y, Zheng H, Zeng Z, Wang X. 2020. threat status of non-lichenized macro-ascomycetes in China and its threatening factors. Biodiver Sci 28: 26–40. 10.17520/biods.2019153