
Abstract
Quiescent (Q) cells are seemingly inactive, developmentally arrested cells, whose universal characteristic is the ability to promptly re-enter the cell cycle upon sensing of external cues. Q cells are responsive to the environment and flexible enough to adapt to available resources. In budding yeast, quiescent nuclear features are drastically distinct from those observed in nutrient replete conditions: The nuclear volume is reduced; the telomeres relocate from the nuclear periphery to the center of the nucleus into a hypercluster; chromatin is found in a compacted, hypoacetylated state; and transcription is globally shutdown. Yet, Q cells can restart transcription within minutes of refeeding. Here, we follow the global decrease of transcription in sorted, developing Q populations and its reactivation upon release. We find that transcription and telomere clustering dynamics in and out of quiescence are independent events. We report a genome-wide redistribution of the transcription machinery as cells progress into quiescence. Although most genes are shut down, 3% of coding genes remain active. Furthermore, RNA polymerase II (RNAPII) accumulates at one-third of gene promoters. The corresponding genes are highly enriched among those showing a high level of transcription and high frequency of expression in individual cells, shortly after cells are refed, as monitored by single-cell RNA-seq. Our results point toward a role for quiescent-specific RNAPII distribution to ensure a rapid and robust transcriptional response upon return to growth.
Eukaryotic genome organization is dynamic, varying across cell types and conditions, both functionally and spatially. These adaptations can be subtle, like individual gene repositioning upon activation (Brickner and Walter 2004; Casolari et al. 2004; Abruzzi et al. 2006; Taddei et al. 2006), or drastic, such as whole-genome reorganizations during development or metabolic transitions (Guidi et al. 2015; Bourbousse et al. 2020; Feodorova et al. 2020). In this study, we explore the transitions in and out of quiescence in budding yeast, aiming to understand how the genome adapts to environmental changes.
Saccharomyces cerevisiae undergoes a number of metabolic transitions, favoring glucose fermentation in rich medium and activating alternative metabolic pathways and stress-response genes as glucose depletes. When glucose runs out, cells enter the diauxic shift (DS), transitioning to ethanol metabolism, with a growth arrest and a twofold decrease in transcription (DeRisi 1997; Gasch and Werner-Washburne 2002; Miles et al. 2013; McKnight et al. 2015; Young et al. 2017). Cells will then progressively exhaust their medium, reaching the stationary phase (SP) within 3–7 days (Werner-Washburne et al. 1996; Gray et al. 2004; Miles et al. 2021; Opalek et al. 2023). From the early post-DS phase, two populations of cells develop, with highly dense (HD) quiescent (Q) cells that can be separated from lowly dense nonquiescent (NQ) cells along a density gradient (Allen et al. 2006). Q cells exhibit remarkable stress resistance and longevity compared with the rest of the population that is heterogeneous in terms of viability (Allen et al. 2006; Aragon et al. 2008; Davidson et al. 2011). Transcriptome analysis shows a two- to 30-fold reduction in transcription in Q cells compared with cycling cells (McKnight et al. 2015; Young et al. 2017). Yet, upon nutrient restoration, a robust and swift transcriptional reignition is observed within minutes.
The RSC remodeling complex was proposed to play a crucial role in this rapid reignition of transcription upon nutrient addition (Cucinotta et al. 2021). However, the extent to which the transcription machinery is associated with the quiescent genome is still debated, with early studies indicating poised RNA polymerase II (RNAPII) upstream of genes (Radonjic et al. 2005) and recent studies reporting either a different distribution, toward the 3′ end of coding sequences (Young et al. 2017), or no association of RNAPII to intergenic regions (Young et al. 2017; Cucinotta et al. 2021).
Changes in transcriptional activity are accompanied by a global change in chromatin and nuclear organization in Q cells. The quiescent genome is compacted (Schäfer et al. 2008; Swygert et al. 2019, 2021) and globally deacetylated at promoters targeted by Rpd3 (McKnight et al. 2015). Telomeres in Q cells hypercluster in a SIR3-dependent manner (Guidi et al. 2015). Although it has been suggested that condensin-dependent compaction plays a role in transcriptional shutdown (Swygert et al. 2019), the interplay between hyperclustering and transcriptional activity has not been explored.
Here we aim to shed light on the state of transcription upon quiescence entry and return to growth in relation to spatial constraints and rearrangements in the nucleus.
Results
Transcriptional shutdown during quiescence entry occurs independently of telomere hypercluster formation
We sought to dissect the process of transcriptional shutdown as cells enter quiescence and understand its functional relationship with telomere hypercluster formation. We mapped the genome-wide transcription machinery occupancy by quantitative chromatin-immunoprecipitation of the Rpb3 subunit fused to a FLAG tag (Methods). In parallel, using the same strain, we followed the subnuclear distribution of the telomere-bound protein Rap1 fused to GFP. Cells from post-DS cultures onward were purified using a density-based gradient, as described previously (Allen et al. 2006), to mainly retrieve the developing Q population. We followed entry into quiescence in two nutrient depletion conditions (Fig. 1A). First, we grew cells in glucose-rich medium and examined samples at different stages as the population grows into SP: cells growing exponentially by fermenting glucose (Log), undergoing DS, and purified HD cells from postdiauxic cultures at 1 (day 1-HD), 2 (day 2-HD), and 6 days HD (Q) after inoculation. Alternatively, we induced quiescence by abrupt starvation of post-DS cells for 24 h (Q-like).
Transcriptional shutdown during quiescence entry occurs independently of telomere hypercluster formation. (A) Timeline of events occurring during quiescence entry. Samples in the nutrient exhaustion kinetics are shown as a function of time after inoculation in rich liquid medium (YPD). All cells following diauxic shift (DS) are sorted through a density gradient (Allen et al. 2006) to recover the highly dense (HD) fraction. For abrupt starvation, yielding Q-like cells, gradient-enriched cells grown for +24 h to post-DS (day1-HD cells) are resuspended in water for 24 h. (B) Proportion of nuclei with hyperclusters during quiescence entry compared with spike-in calibrated RNAPII ChIP-seq (Rpb3-FLAG) counts genome-wide. (Top) Representative images of Rap1-GFP sampled during quiescence entry. Bar = 1 µm. (Middle) Rap1-GFP cluster intensities relative to total nuclear signal classified according to the number of clusters found per nucleus. Hyperclusters, shown in blue, are defined as clusters with a relative intensity more than fourfold higher than the average cluster in Log phase. Pie charts represent the proportion of nuclei with a hypercluster. (Bottom) Rpb3-FLAG spike-in calibrated IP counts averaged over 1 kb bins genome-wide. (C) Comparison of telomere hyperclustering and Pol II (Rpb3-FLAG) binding in quiescence (6d-HD; Q). (Left) Representative images of Rap1-GFP in WT and sir3Δ samples in Q cells. Small cells, with a Feret's diameter <4.5 µm are marked with an asterisk in transmitted light images. Bar = 1 µm. (Right) Rpb3-FLAG counts over genes normalized by gene size in WT versus sir3Δ samples.
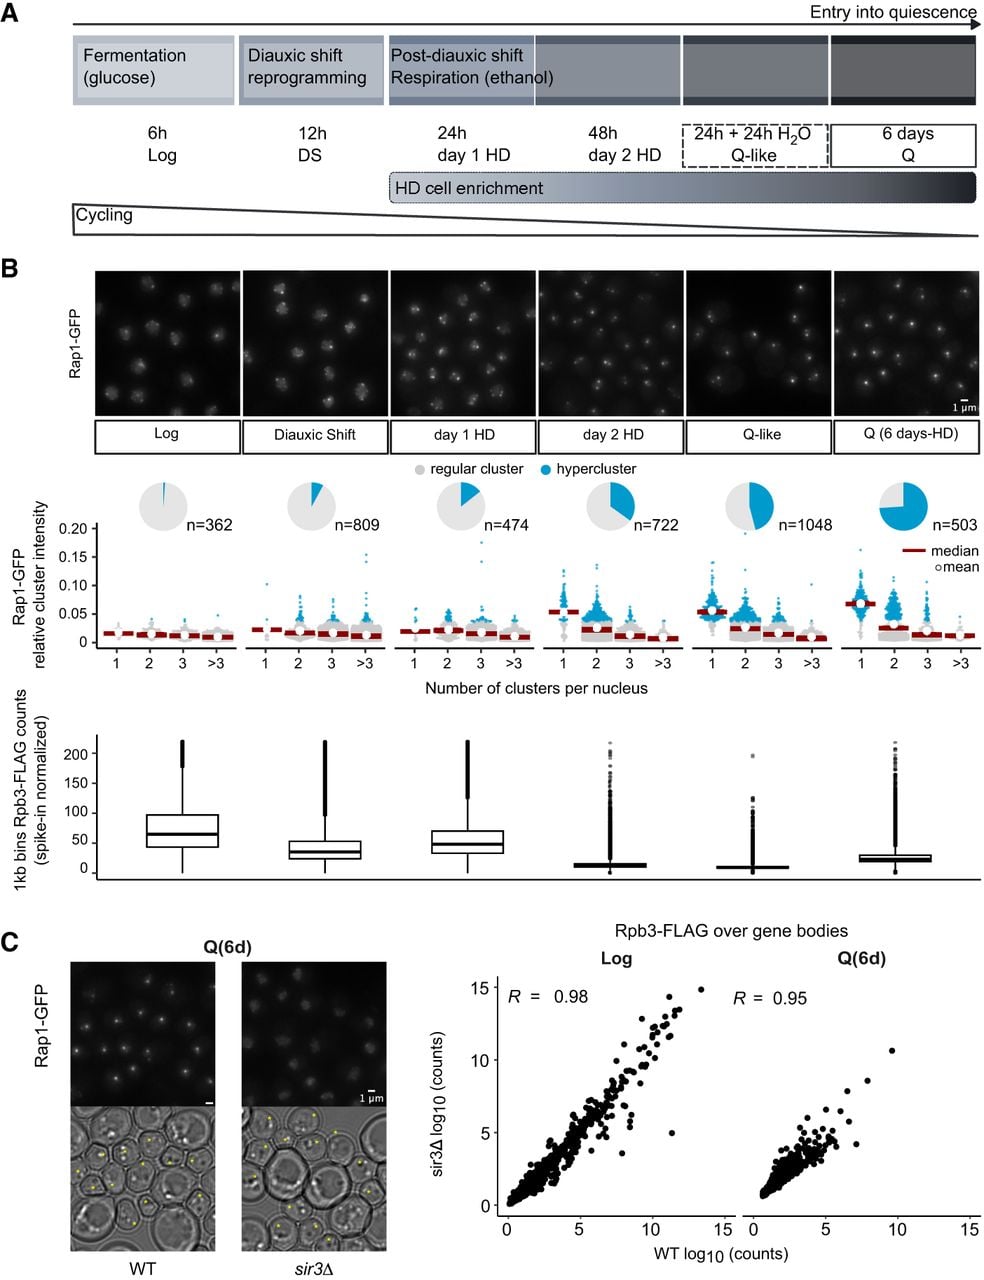
As previously described (Guidi et al. 2015), clustering of telomeres changes as cells transition from exponential growth by fermenting glucose (Log), through slowed-down growth in the post-DS phase (PDS, day 1 HD). The proportion of nuclei with more than three clusters is reduced, and foci become brighter. Hyperclusters (Guidi et al. 2015), defined here as clusters that are four times brighter than the median of clusters in Log phase, increase in proportion from day 2 onward (Fig. 1B).
Total RNAPII levels show little variation upon growth into SP and quiescence entry (Jona et al. 2000; Radonjic et al. 2005; Young et al. 2017). In contrast, genome-wide counts of spike-in calibrated RNAPII ChIP-seq show varying levels of the transcription machinery associated with the genome in these kinetics (Fig. 1B, bottom). First, RNAPII genome association decreases two- and 1.4-fold, respectively, in DS and early respiration (day 1 HD) samples relative to exponential phase (Log). All samples after 2 days of growth show more than a threefold decrease relative to the Log sample. We previously showed that both Q (6 days of nutrient exhaustion) and Q-like (abrupt starvation) cells display telomere hyperclusters (Guidi et al. 2015). Here, we show that these two stages are associated with very low Rpb3-FLAG occupancy genome-wide. Furthermore, although decrease of RNAPII occupancy and increase of telomere hypercluster follow a similar trend over the kinetics of quiescence entry, the former precedes the latter, as minimal RNAPII occupancy (6.2-fold decrease relative to Log) is observed after 2 days of growth, and telomere hyperclustering keeps increasing up to 6 days.
To test whether hypercluster formation is required for transcriptional shutdown, we examined RNAPII binding in a sir3Δ mutant, defective for hypercluster formation but able to form HD small cells, morphologically similar to the wild type (WT) (Fig. 1C; Guidi et al. 2015). To avoid pseudodiploid effects owing to the derepression of cryptic mating type loci in sir3Δ strains (Galitski et al. 1999), we worked in an hmlΔ background. As expected, RNAPII binding is higher at the subtelomeric loci in sir3Δ cycling cells (Log) (Supplemental Fig. S1A). Yet, Rpb3-FLAG ChIP-seq samples in the sir3Δ background highly correlate with the WT (Fig. 1C; Supplemental Fig. S1B) in Log and Q samples, including at 297 genes with significant Rpb3-FLAG binding in quiescent chromatin (Supplemental Fig. S1C), demonstrating that shutdown of transcription does not depend on telomere hyperclustering. Therefore, during quiescence entry, transcriptional shutdown precedes and occurs independently of telomere hyperclustering.
Dismantling of telomere hyperclusters follows, but is independent of, transcriptional activation upon return to growth
We next asked when telomere hyperclusters dismantle upon return to growth and whether this depends on transcriptional activation that occurs within 3–10 min after refeeding (Martinez et al. 2004; Radonjic et al. 2005; Cucinotta et al. 2021). We followed Rap1-GFP in released Q cells and found hyperclusters disassembling within 15–30 min, 1 h before S phase starts as monitored by bud emergence (Fig. 2A). Declustering is particularly apparent in the decrease in brightness of clusters, which reach intensities comparable to those found in cycling cells after 30 min of release in glucose (Fig. 2B; Supplemental Fig. S2A). Thus, hypercluster dismantling occurs swiftly, but it only comes after reignition of transcription.
The dismantling of telomere hyperclusters during return to growth follows but is independent of transcriptional activation. (A) Telomere hypercluster dismantling upon quiescence exit. Representative images of Rap1-GFP sampled during quiescence release. Brightness for all Rap1-GFP images is set at 1600 maximum. (B) Telomere hypercluster dismantling in rich medium (YPD) after shifting cells grown at 25°C to restrictive temperature (37°C; Methods) to inactivate RNAPII (rpb1-1) or not (WT): representative Rap1-GFP images after 15 or 30 min of refeeding of stationary phase cells. Brightness for all Rap1-GFP images is set at 1600 maximum.
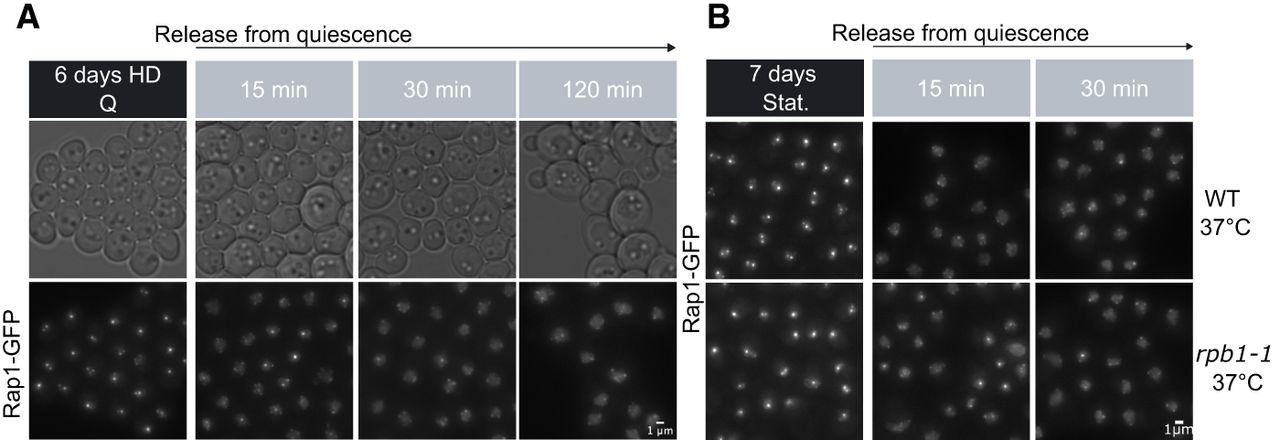
To test whether transcriptional activation could be the cause of telomere hypercluster dismantling, we followed telomere clusters after releasing the thermosensitive rpb1-1 strain at restrictive temperature. RNA-seq confirmed a severe defect of transcriptional activation (Supplemental Fig. S2B) and a close to WT kinetic of declustering in these conditions. Similar results were observed in cells pretreated with the RNAPII inhibitor phenanthroline (Supplemental Fig. S2C). In contrast, Q cells treated with thiolutin did not dismantle their telomere hyperclusters, confirming the complex effect of this drug (Lauinger et al. 2017; Eshleman et al. 2020; Qiu et al. 2024). We thus conclude that hypercluster dismantling upon quiescence exit is largely independent of RNAPII activity.
Scant transcription of poorly characterized genes remains in the quiescent population
We examined the genome-wide distribution of RNAPII through our spike-in calibrated Rpb3-FLAG mappings, which show no bias in distribution along the chromosome arms, except for a twofold increase of counts of Rpb3-FLAG at the rDNA locus observed both in WT and sir3Δ cells (Supplemental Fig. S3A,B) that is accompanied by a decrease in RNAPI occupancy (Supplemental Fig. S3C), consistent with a smaller nucleolus and reduced protein synthesis (Fuge et al. 1994; Laporte et al. 2013; Guidi et al. 2015). These observations suggest a competitive binding of RNAPII and RNAPI, as was previously proposed (Cioci et al. 2003).
As cells progress into quiescence, Rpb3-FLAG signal is depleted over genes and intergenes alike (Supplemental Fig. S3D). To address the extent of shutdown, we examined RNAPII annotations. Because noncoding annotations do not particularly show a quiescence-specific increase in Rpb3-FLAG binding (Supplemental Fig. S3E), we focused our analyses on the transcription of protein-coding genes. Importantly, the Rpb3-FLAG presence over gene bodies correlates very well with previous mappings of untagged Rpb3 (Pearson and Spearman's R = 0.8) and of Ser2 phosphorylation of the C-terminal domain (CTD) of Rpb1 (Pearson R = 0.87, Spearman's R = 0.85) in quiescence (Swygert et al. 2019), associated with its elongating form (Fig. 3A). Based on the presence or absence of Rpb3-FLAG and newly synthesized transcripts (4tU-seq; Methods) (Cucinotta et al. 2021) we define four classes of genes.
Transcriptional output is scant, but homogeneous, in the quiescent population. (A) Representative Genome Browser views of genes classified according to binarized Rpb3-FLAG binding and recently synthesized transcripts detection within the coding region. Thresholds are set at 50 average counts for Rpb3-FLAG and one average count for 4tU-seq (see Supplemental Fig. 3C,D,F). (*) This study, (**) Rpb1 CTD-Ser2P. Recently synthesized transcripts mappings are from the Tsukiyama laboratory (Swygert et al. 2019, Cucinotta et al. 2021). (B) UMAP representation of cells in the quiescent population assessed by scRNA-seq. Color scale represents the percentage of the transcriptome per cell for the sum of class I genes. (C, left) List of top seven class I genes, representing 18.8% of the transcriptome of the average cell. (Right) Genome Browser view of GRE1, detected in >99% of 6d-HD (Q) cells, during early respiration (day 1 HD) and in two types of quiescence induction: (Q-like) abrupt starvation from post-DS; (Q) nutrient exhaustion after 6 days. (*) This study, (**) Rpb1 CTD-Ser2P. Recently synthesized transcripts mappings are from the Tsukiyama laboratory (Swygert et al. 2019, Cucinotta et al. 2021). Intergenic accumulation of Rpb3-FLAG upstream of genes in Q samples (6d-HD) is highlighted in gray to allow comparison across conditions.
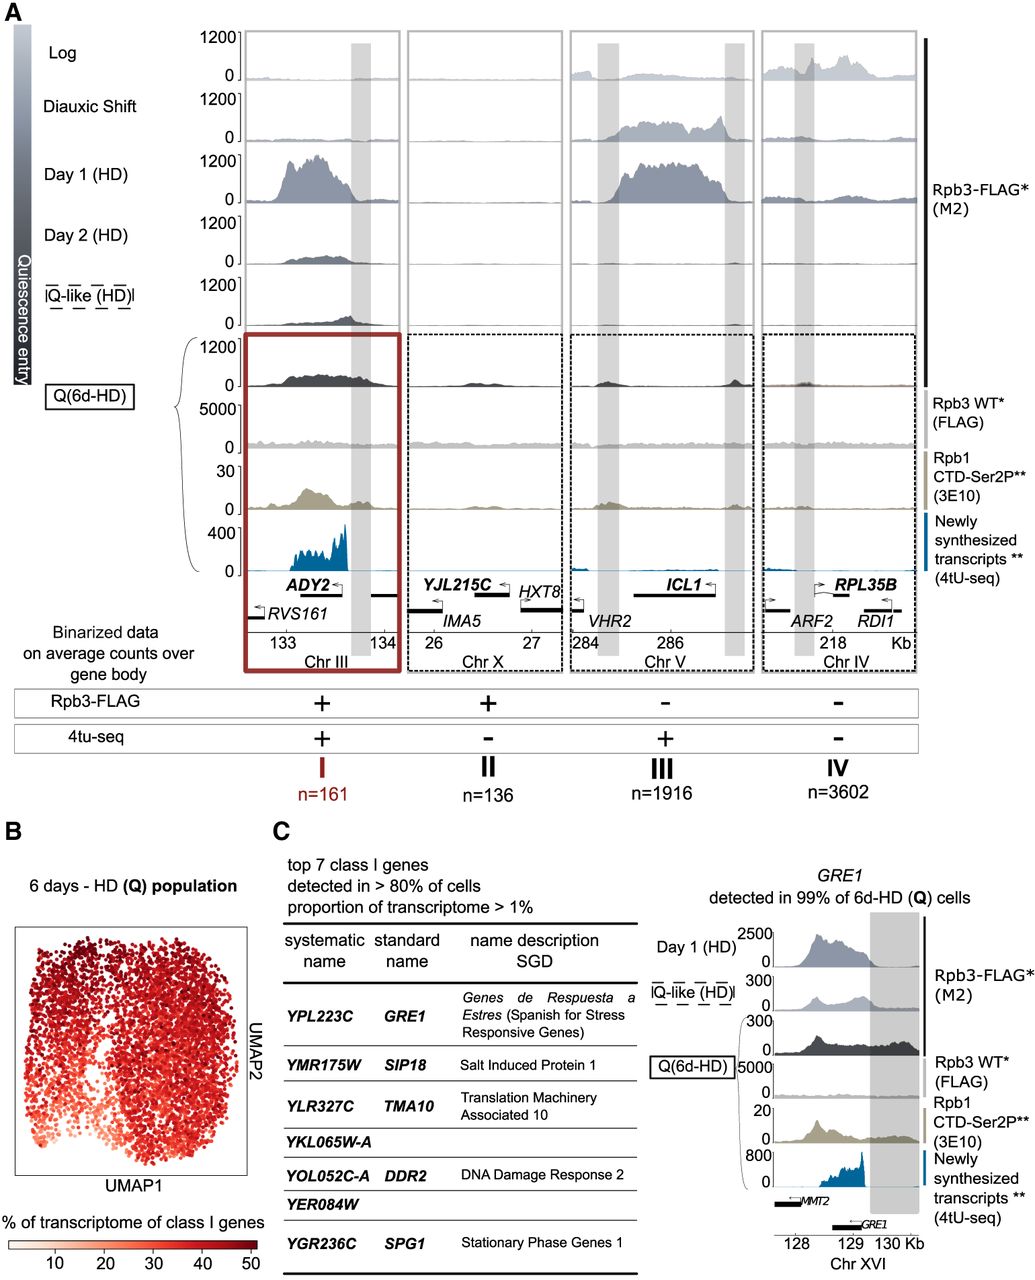
Among the 297 genes that are bound by RNAPII in quiescence, more than half show newly synthesized transcripts in Q cells (class I, 161 genes), whereas the rest, which are shorter (Supplemental Fig. S3F), do not (class II, 136 genes). Of note, the sir3Δ strain shows a similar RNAPII binding profile at these genes (Supplemental Fig. S1C).
One-third of all protein-coding genes show detectable transcripts but Rpb3-FLAG counts below the threshold (class III, 1916), whereas about half do not meet the threshold for Rpb3-FLAG or 4tU-seq counts (class IV, 3602). Class III genes show, on average, fewer recently synthesized transcripts compared with class I and more RNAPII compared with class IV (Supplemental Fig. S3F), thus showing consistency between 4tU and RNAPII detection. The presence of 4tU signal at these genes with no detectable RNAPII in their gene body could reflect the difference in sensitivity between ChIP and 4tU detection.
Classes I and II show comparable levels of Rpb3-FLAG binding but differ in 4tU-seq counts. With class II genes being particularly small (Supplemental Fig. S3F), size bias and/or reduced stability of transcripts might account for less efficient capture of 4tU-seq reads assigned to these genes. In addition, differences between 4tU incorporation and RNAPII binding could stem from small variations between growth conditions. Although both class I and class II are enriched in uncharacterized ORFs, class II genes are also enriched in dubious ORFs (Supplemental Fig. S3G). Thus, class II genes show overall less evidence for bona fide transcription in Q cells compared with class I genes. Fifty-five out of 136 class II genes do not show RNAPII binding in fermentation or respiration. In contrast, almost all class I genes were bound by RNAPII during growth: most during all growth phases (112) and some (49) specifically after the DS (Supplemental Fig. S3H). Only a few class I genes are annotated as verified ORFs (62 genes) and show an enrichment for catabolic processes and carboxylic acid transport (Supplemental Fig. S3G). Such little functional enrichment is consistent with class I genes being significantly enriched in uncharacterized ORFs (Supplemental Fig. S3G), in agreement with the scant characterization of quiescence. Only two verified ORFs with little functional characterization, RTS2 and BSC4, are bound exclusively in Q cells (Supplemental Fig. S3H).
Single-cell RNA-seq confirms active transcription in Q cells
Density gradients allow to enrich for the HD population, also referred to as quiescent (Allen et al. 2006). To rule out that class I transcripts resulted from transcription in leftover low-density cells, or a subpopulation of Q cells, we examined the transcriptome of the population at the single-cell level, after adapting the 10x Genomics SC3′ encapsulation protocol to Q cells (Methods) (Jariani et al. 2020; Vermeersch et al. 2022). The correlation between pseudobulk scRNA-seq and 4tU-seq counts (Pearson R = 0.6, Spearman's R = 0.64) indicates that single-cell RNA-seq in Q cells detects mainly recently synthesized transcripts. This is in good agreement with the reported difficulty to extract stored mRNAs in Q cells (Aragon et al. 2006). UMAP dimensionality reduction of single-cell RNA-seq data revealed that our gradient-sorted population at 6 days of medium exhaustion shows a bilobate structure (Fig. 3B). Nevertheless, class I transcripts are well represented throughout both subpopulations (Fig. 3B), independently of read counts (Supplemental Fig. S3I). Indeed, these 161 genes make up one-third (35.6%) of the transcriptome of the average cell (Supplemental Fig. S3J). Our single-cell analysis thus reveals a widespread transcription of 3% of protein-coding genes for the quiescent population.
Of note, seven class I genes are detected in >80% of the cells and collectively make up 18.8% of the average transcriptome, among which is GRE1, expressed in >99% of the 6d-HD (quiescent) population (Fig. 3C). Some of these are previously identified stress-response genes (SPG1 and two orthologs, GRE1 and SIP18) (Miralles and Serrano 1995; Martinez et al. 2004; Dang and Hincha 2011) and four with partial (TMA10, DDR2) (Kobayashi et al. 1996; Fleischer et al. 2006) or no characterization (YKL065W-A, YER084W). Individual deletion of these seven genes did not affect growth into quiescence, return to the cell cycle, telomere hypercluster formation and dismantling, or expression of the Hxt1 hexose transporter upon return to growth (Supplemental Fig. S3K). We hypothesize that these genes exert redundant functions or are important to resist specific stress conditions. These genes either have less RNAPII binding in abruptly starved cells, or they show a 5′-biased profile, as seen for GRE1 (Fig. 3C). Thus, despite showing a genome-wide decrease in transcription, and similar nuclear morphology, the remaining transcription in quiescence can distinguish different methods of induction, as previously reported (Klosinska et al. 2011). Taken together, these results provide strong evidence for active transcription that is homogeneously retained in the HD population at 6 days for a set of 161 genes, with only a handful being widely and relatively strongly transcribed.
RNAPII redistributes to a subset of promoter-bearing intergenes when cells enter quiescence
We noticed that entry into quiescence is accompanied by a redistribution of RNAPII away from gene bodies (Fig. 3A,C, gray boxes). When first induced at respiration or fermentation, class I genes show a canonical profile, with a TSS-proximal accumulation followed by increasing RNAPII enrichment toward the 3′ end of coding sequences (Mayer et al. 2010; Tietjen et al. 2010; Bataille et al. 2012). But, as the culture approaches SP (day 2-HD) and increasingly as cells reach either quiescent state (Q or Q-like), Rpb3-FLAG is partially retained within the gene body while accumulating outside the ORF specifically in Q cells (Fig. 3A,C, gray boxes).
To ask whether RNAPII was enriched in Q in all intergenes alike, we sorted them based on the orientation of their surrounding annotations (convergent, divergent, tandem) and examined their enrichment in RNAPII (Fig. 4A). As previously reported (Mayer et al. 2010; Tietjen et al. 2010; Bataille et al. 2012; Ocampo et al. 2019), during exponential growth (Log), RNAPII is highly enriched at convergent intergenes and near the transcription start sites in tandem and divergent intergenes.
RNAPII redistributes to a subset of promoter-bearing intergenes when cells enter quiescence. (A) Rpb3-FLAG spike-in calibrated signal piled-up at the center of intergenes classified based on the orientation of surrounding coding annotations. Rows are sorted based on intergene size. (B) Mapping of RNAPII ([Rpb1 CTD] Rpb1 C-terminal domain, [Rpb1 CTD-Ser2P] Rpb1 CTD Serine 2 phosphorylation, [Rpb1 CTD Ser5P] Rpb1 CTD Serine 5 phosphorylation) and RNAPI (Rpa135-FLAG) epitopes in and around the RNAPII (Rpb3-FLAG) quiescent peak at the divergent intergene between DCP2 and MLS1 (class III genes). (Top) Genome Browser view of spike-in calibrated Rpb3-FLAG (this study), Rpb1 CTD-Ser2P (Swygert et al. 2019), and recently synthesized transcripts (4tU-seq, both strands merged) (Cucinotta et al. 2021). (Bottom) ChIP-qPCR IP/INPUT signal normalized to an intergenic region in Chr I (Methods). Antibodies used are written in parentheses. (C) Average profile plot of ChIP-seq or ChIP-array mappings (z-scores) of various nuclear proteins in exponential growth (Log) and quiescent (Q 6d-HD) cells: RNAPII (Rpb3-FLAG; this study), TFIIB (Sua7 in Log [Jeronimo and Robert 2014] Sua7 in quiescent [6d-HD] cells [Cucinotta et al. 2021]), and Sir3 (Guidi et al. 2015). Signals are centered at the summits of RNAPII (Rpb3-FLAG) strongest peaks in quiescence (MACS2 signal value > 2.4), falling in promoter-bearing intergenes, or at random locations in promoter-bearing intergenes without RNAPII peak overlap. (Right) Coverage tracks of samples shown in left panel at the DCP2/MLS1 intergene. (D) Pie charts depicting the proportion of genes bearing a RNAPII summit in the vicinity of their promoter, stratified by transcription status in quiescence, as described in Figure 3A. P-values for hypergeometric test: (**) 2.23 × 10⁻³, (***) 1.23 × 10−43.
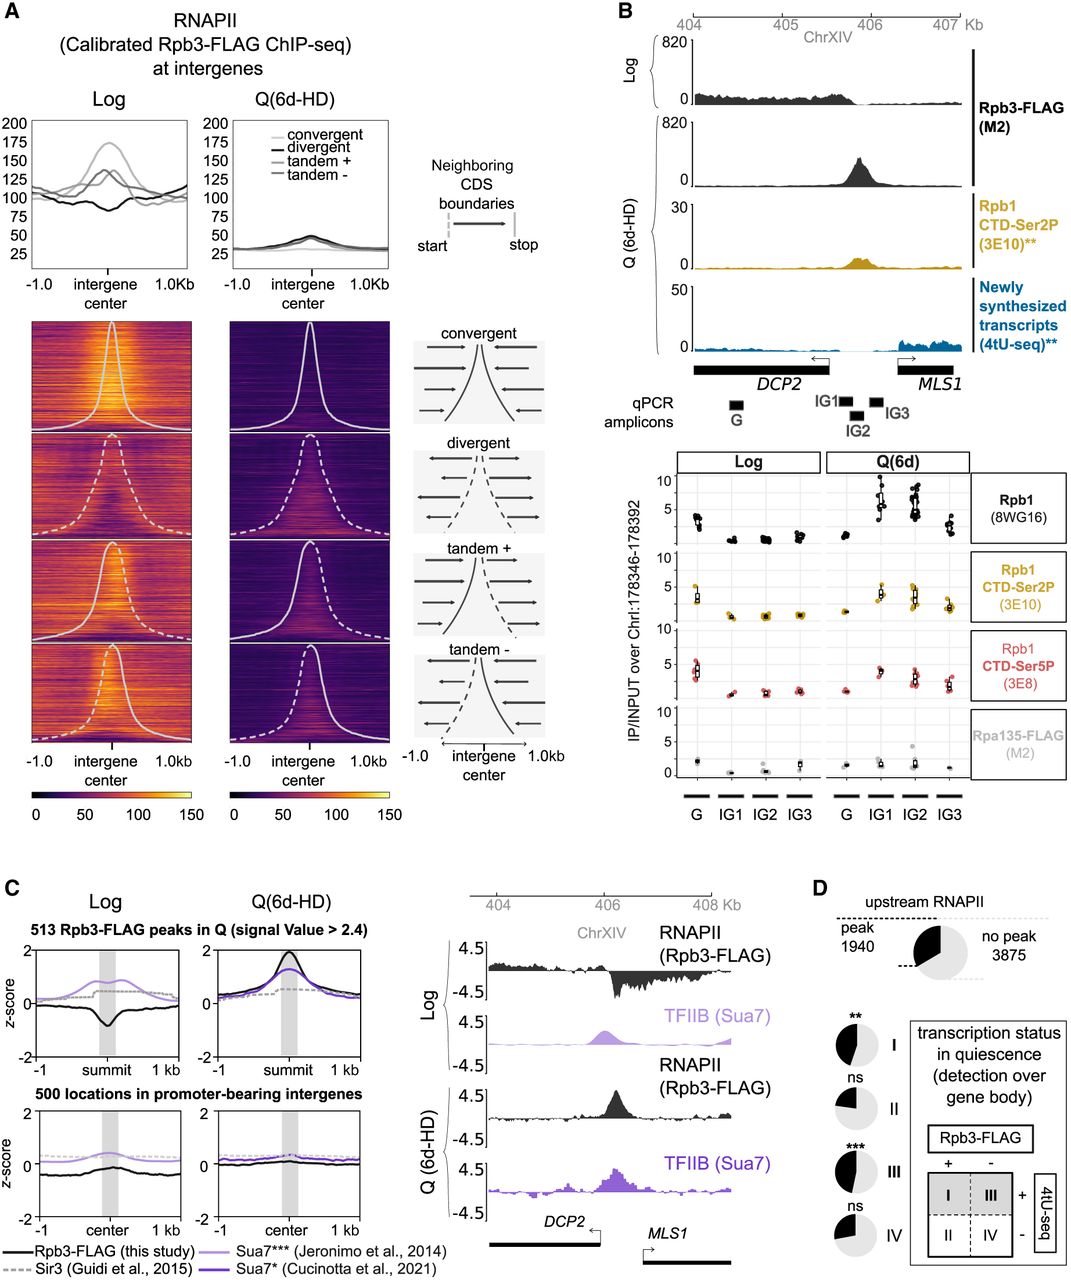
In sharp contrast, in Q samples, RNAPII is mostly enriched within the boundaries of those intergenes containing a promoter: tandem and divergent, the latter one being particularly striking, as these show virtually no enrichment in growing cells. Peak calling analysis, using the IP on untagged samples (FLAG on Rpb3 WT) as controls (Methods), corroborates the significance of the observed enrichment (Supplemental Fig. S4A). Input and untagged IP (anti-FLAG on Rpb3 WT) chromatin coverage tracks show no enrichment or depletion at these locations, ruling out a potential artifact (Supplemental Fig. S4B). This was further confirmed by ChIP q-PCR (see below) (Fig. 4B). Thus, RNAPII is depleted from convergent intergenes, while accumulating at 1773 promoter-bearing intergenes, upstream of 2478 genes in quiescent chromatin (Supplemental Fig. S4A).
Promoter-bound RNAPII bears signs of canonical transcription
All epitopes of the RNAPII complex that we targeted using ChIP-qPCR follow the same trend of enrichment at promoters (Fig. 4B; Supplemental Fig. S4C), thereby indicating presence of the whole catalytic RNAPII. This was not the case for the FLAG-tagged Rpa135 subunit of RNAPI. As our ChIP-seq was performed against FLAG-tagged Rpb3, this allows us to rule out a potential artifact owing to the hyperchippability of the FLAG epitope at these loci (Teytelman et al. 2013). Furthermore, we detect the Rpb1 CTD phosphorylations (Ser2, 3E8; Ser5, 3E10) associated with elongation and initiation (Komarnitsky et al. 2000) in cycling cells, suggesting that RNAPII may be active at these sites specifically in quiescence. Indeed, Ser5P is enriched at the DCP2/MLS1 intergenic region, where no Ser5P enrichment could be detected during Log phase, although Rpb3 was clearly detected over the DCP2 gene body. Ser5P was also found enriched in the promoter of the ADY2 class I gene (Supplemental Fig. S4C) with levels three to six times higher than in the DCP2/MLS1 intergene, possibly linked to the stronger activity of ADY2 over DCP2 or MLS1.
We next compared Rpb3-FLAG ChIP signal at the summits of peaks within promoter-containing intergenic regions (1442 upstream of 1940 genes; Methods) with those of other factors previously mapped in quiescent chromatin (Guidi et al. 2015; Swygert et al. 2019; Cucinotta et al. 2021). As expected, the silencing factor Sir3 does not colocalize with Rpb3-FLAG (Fig. 4C), whereas the ChIP-seq signal obtained with a native Rpb3 antibody (Swygert et al. 2019) does (Supplemental Fig. S4D). In contrast, Sth1 (RSC) showed low enrichment at these sites, whereas Rpb1-Ser2P, Brn1, Msn2, and especially TFIIB (Sua7) showed higher correlation with Rpb3-FLAG peaks. Notably, TFIIB binding suggests the presence of the preinitiation complex (PIC) and closely follows RNAPII enrichment in quiescent chromatin. This pattern differs in cycling (Fig. 4C, gray box; Jeronimo and Robert 2014) and refed Q cells (Supplemental Fig. S4C; Cucinotta et al. 2021), in which TFIIB localizes near to but not at Rpb3-FLAG peaks.
The detection of Rpb1-Ser5P and TFIIB subunit Sua7 at intergenic Rpb3 peaks is indicative of active transcription. However, recently synthesized transcripts (4tU-seq) (Cucinotta et al. 2021) are rarely found directly under the strongest summits (42/513). The absence of 4tU signal could stem from the lack of sensitivity to detect short or unstable transcripts. Yet, among all 1940 promoters showing Rpb3-FLAG peak summits in quiescence, half (945) are found upstream of genes with detectable levels of newly synthesized transcripts (class I, P-value 2.23 × 10⁻³; class III genes, P-value 1.23 × 10−43) (Fig. 4B,D).
In summary, RNAPII is found at noncanonical loci in the quiescent genome. At these sites, it associates with PIC components and bears marks indicative of activity.
RNAPII accumulates at upstream activating sequences during quiescence entry
Summits of strong peaks fall more often than expected within promoters bearing a fuzzy and or fragile nucleosome positioning (hypergeometric test, P-value = 2.1 × 10−36) (Tirosh and Barkai 2008; Kubik et al. 2015). Among the different classes of TF bound promoters defined by Rossi et al. (2021), strong peaks are enriched at those endowed with SAGA, Mediator, or TUP cofactors (STM; hypergeometric test, P-value = 3.7 × 10−190) and at ribosomal protein (RP) genes (hypergeometric test, P-value = 6.2 × 10⁻²⁰). This was not the case at promoters with TF organization lacking STM cofactors and bound by insulators (P-value = 0.19). RNAPII is thus enriched at inducible promoters in Q cells.
The binding of RNAPII skews toward the 3′ end of all three classes (RP, STM, and TFO) after cells undergo DS, reminiscent of the pattern reported for SP cells by the Osley laboratory (Young et al. 2017). This is followed by a virtual depletion over the gene body that is accompanied by a progressive accumulation at the promoter of STM and RP genes but not at TFO genes from late postdiauxie to quiescence (Fig. 5A).
Quiescence-specific intergenic RNAPII accumulates at noncanonical binding sites in promoters. (A) RNAPII distribution over coding sequences at 137 ribosomal protein (RP); 938 SAGA, Mediator, or TUP- bound (STM); and 1783 TF organization lacking STM cofactors but bound by insulators (TFO) genes (Rossi et al. 2021). Rpb3-FLAG signal (z-score) is rescaled over transcription start site (TSS)–TES. (B) Distribution of summits falling in promoter-bearing intergenes relative to TSSs. TSS positions are corrected using CRAC-seq from cycling cells (Candelli et al. 2018). Locations of mapped upstream activated sequences (Schofield and Hahn 2023) are shown as dark red lines. (C) Transcription factor binding sites (TFBSs; from the JASPAR 2022 fungi database) (Castro-Mondragon et al. 2022) found in the vicinity (100 bp) of strongest RNAPII intergenic summits, with a fold enrichment over control greater than three (SEA, MEME suite) (Bailey and Grant 2021). (D) Clustering of Rpb3-FLAG at Q summits ±1 kb. (Top) Average profile plot of RNAPII ChIP-seq (Rpb3-FLAG; this study). Signals are centered at the summits of RNAPII (Rpb3-FLAG) in quiescence falling in promoter-bearing intergenes. Summits are clustered (k-means) into three groups: 437 summits with signal present throughout the kinetics of Q entry, 601 summits with signal locally depleted during growth phase, and 404 summits appearing de novo in the later stages of quiescence entry. (Bottom) Snapshots of Rpb3-FLAG mapping ([*] this study) in fermentation (Log), respiration (postdiauxie, day 1 HD; day 2 HD), or quiescence induced by abrupt starvation (Q-like) or nutrient exhaustion (Q, 6d-HD). Typical examples are shown below each group. Dotted lines indicate the position of the peak summit for each intergene, and gray boxes indicate the region over which the signal was clustered.
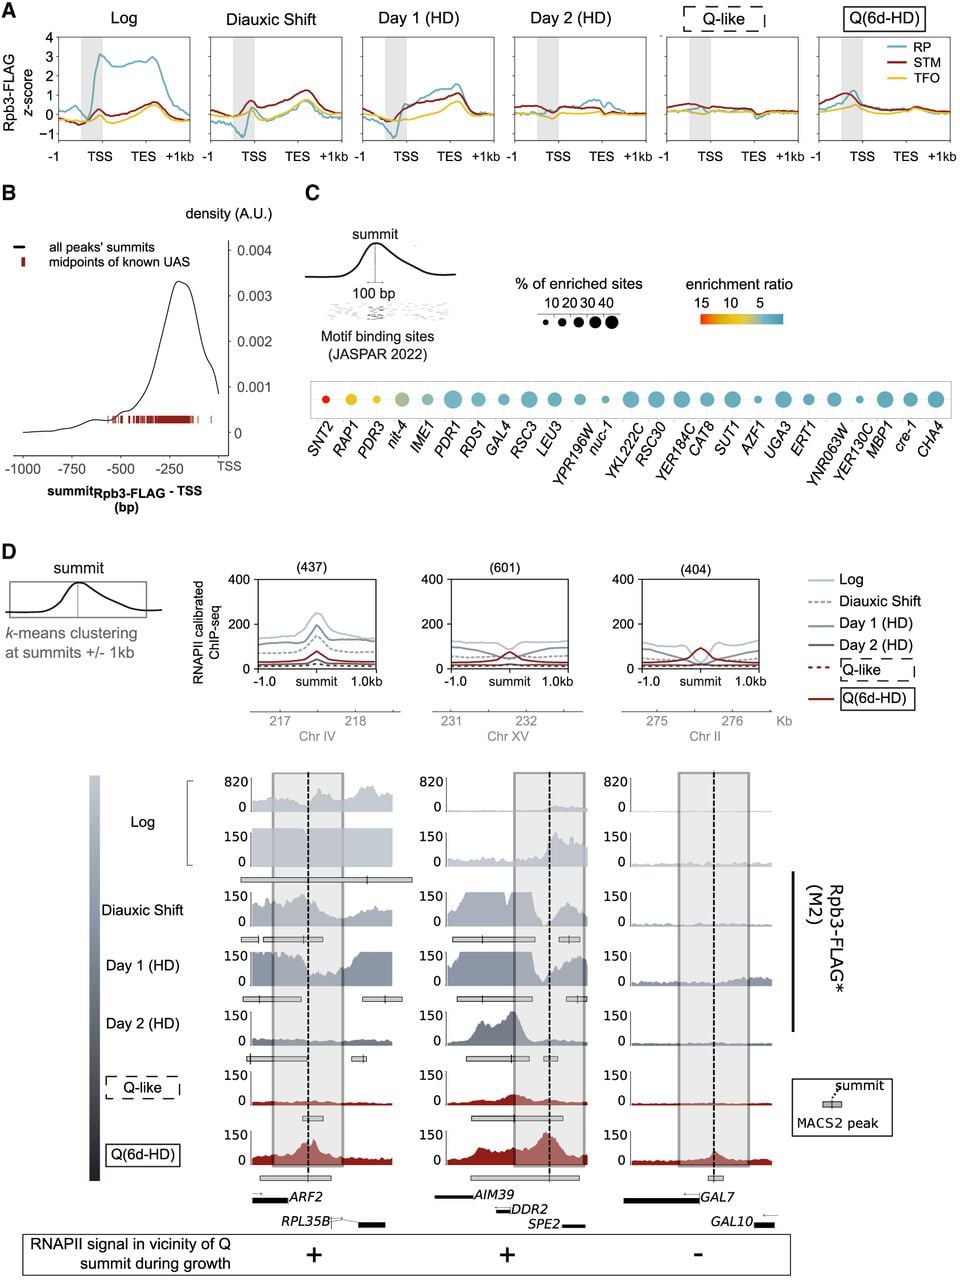
The strongest RNAPII enrichment lies at 250 bp from TSS in quiescence, where upstream activating sequences (UASs) are often found (Fig. 5B; Supplemental Fig. S5A). Indeed, ∼25% (125/513) of summits of strong peaks falling in promoters coincide with annotated UAS. Similarly, 111 binding motifs, encompassing a variety of functions (Methods), are found to be enriched in the vicinity (100 bp) of the strongest RNAPII summits.
Thus, RNAPII quiescent enrichment does not seem to result from a previously known program driven by a small set of regulators. Those motifs with a fold enrichment over the control greater than three are shown in Figure 5C. Some sites are well positioned near but not immediately under the RNAPII summit in quiescence (e.g., Rap1, Pdr3) (Supplemental Fig. S5C) and correspond to known regulators of genes highly expressed during growth (Rap1) or to factors involved in chromatin modifications associated with the shutdown of transcription upon quiescence entry (e.g., Snt2, recruiting factor for Rpd3) (Baker et al. 2013; McKnight et al. 2015) or the remodeling of chromatin/maintenance of the NFR (e.g., Rsc3, Rsc30) (Badis et al. 2008).
Some of the TFBSs we found are puzzling, like those recognized by proteins of uncharacterized function (YPR196W, YKL222C, YER184C, YNR063W, and YER130C) but also that of Gal4, as cells were presumably not exposed to galactose. In total, 220 genes with a significantly enriched RNAPII peak show virtually no sign of transcription during quiescence and quiescence entry. These include GAL genes (Supplemental Fig. S5A).
We next used k-means clustering to study the dynamics of RNAPII around all summits in promoter-bearing intergenes during quiescence entry (Methods). The first group comprises 437 summits in Q cells (Fig. 5D; Supplemental Fig. S5B), in which polymerase is enriched throughout the kinetics, starting from exponentially growing cells. The second group (601 summits) show weaker levels of RNAPII at the summit in Log and early respiration phase (day 1). Note that one such Rpb3-FLAG summit is found at the intergene upstream of ADY2, together with the initiation Ser5-P modification (Supplemental Fig. S4C). The third group (404 summits) is depleted of signal in all growing phases (Log through day 1) and only starts increasing after day 2, as illustrated with GAL7 (Fig. 5D; Supplemental Fig. S5C). Binding motifs highly enriched under summits of the third group of peaks include binding factors known to be active upon glucose derepression (e.g., Adr1, Mig1,2,3) (Carlson 1999; Schüller 2003) but also include a variety of factors involved in various responses, including, again, Gal4 (Fig. 5C; Supplemental Fig. S5C). Abruptly starved cells either show a lower enrichment of RNAPII at these regions (e.g., at DDR2 promoter) (Fig. 5C; Supplemental Fig. S5B) or none (e.g., at GAL7 promoter) (Fig. 5D; Supplemental Fig. S5A,B).
In summary, in contrast to genic binding of RNAPII in Q, which was already present as cells were growing, one-third of the intergenic enrichment found in starved cells is Q specific, increasing only after cells have been in culture for >2 days.
Upstream RNAPII predicts strength of transcriptional restart upon release
We next asked whether promoter-bound RNAPII in quiescent chromatin would relate to the swift restart of transcription observed upon return to growth. We performed k-means clustering to categorize 5778 genes based on the dynamics of newly synthesized transcript abundance 10 min after nutrient restoration (Fig. 6A; Cucinotta et al. 2021), thus identifying four groups: The first one comprises class I and class III genes with transcripts in Q cells that show a decrease in relative labels of 4tU incorporation upon release (Ø, 101 genes) (Fig. 6A; Supplemental Fig. S6A).
Upstream RNAPII predicts strength of transcriptional restart upon release. (A) k-means clustering of recently synthesized transcripts data ([**] Cucinotta et al. 2021) over TSS–TES. Shown are the number of genes per cluster. Pie charts show the proportion of genes per cluster bearing an upstream RNAPII summit (black). Outer ring shows the proportion of ribosomal protein genes (blue). (***) Gene clusters significantly enriched in RNAPII at promoter. Hypergeometric test; (R-I) 1.14 × 10⁻⁴, (R-II) 2.32 × 10⁻²⁷, (R-III) 3.75 × 10−39, (R-IV) ns. (B) Heatmap of RNAPII enrichment at promoter per decile of expression in single-cell RNA transcriptomes performed 30 min after release in media containing different carbon sources. RNAPII enrichment at promoter was estimated by a hypergeometric test on the proportion of genes with a Rpb3-FLAG peak summit falling in the upstream intergene (P-values shown in Supplemental Fig. S6F). Deciles of expression are based on the number of cells expressing the gene per sample (cells released on media containing either glucose [2%] or lactate and ethanol [0.5%, 2%] as carbon source). Pie charts represent the proportion of genes with (black) or without (gray) a summit in their promoter among the 10% most frequently expressed genes in either condition. Outer ring shows the proportion of ribosomal protein genes (blue), as in A. (***) Significant enrichment in RNAPII summits at the promoter.
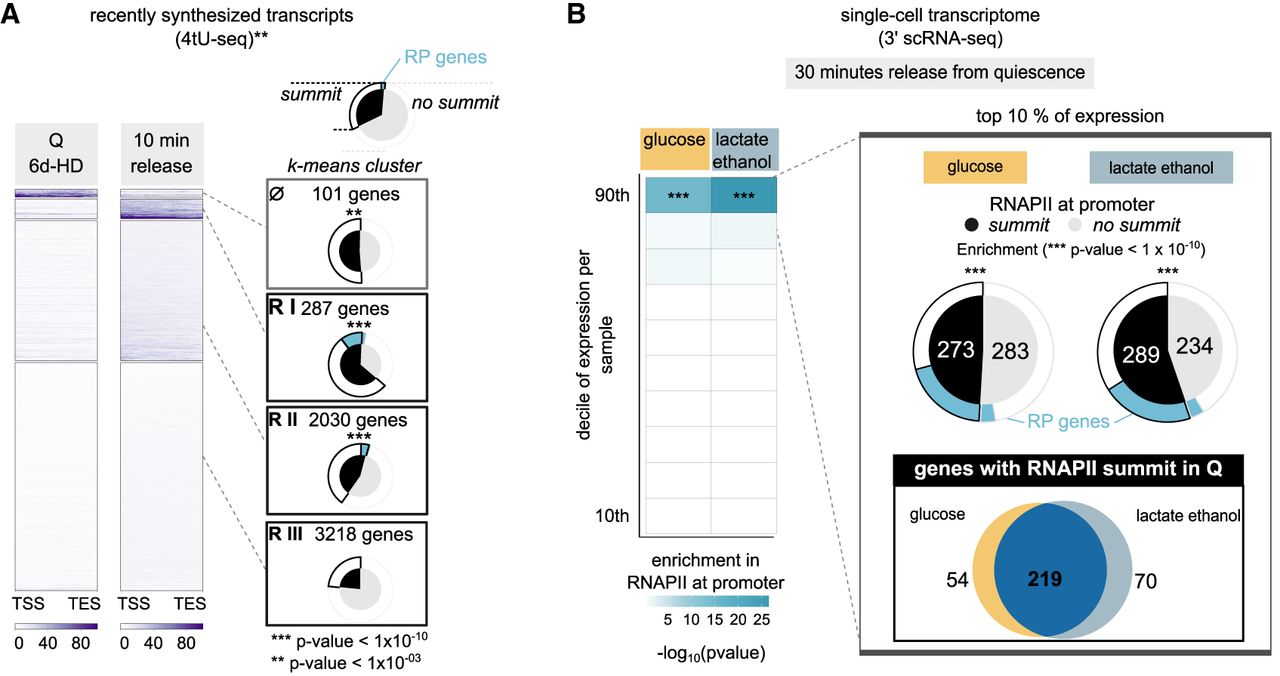
The other three groups (RI, 287 genes; RII, 2030 genes; RIII 3218 genes) show decreasing levels of release probability (Supplemental Fig. S6B). The genes that more robustly restart (categories RI and RII) show the highest enrichment for genes with an upstream RNAPII summit, among which are found most RP genes (Fig. 6A). Conversely, genes with a stronger upstream enrichment (with a RNAPII peak overlapping with their promoter) show higher 4tU counts upon release compared with those with a milder one or with no detectable enrichment (Supplemental Fig. S6C).
Although 738 genes with upstream RNAPII summit show a milder upregulation 10 min after release with glucose, it is stronger than those without a RNAPII summit (cluster RIII) (Fig. 6A; Supplemental Fig. S6D). These are mostly enriched in functions related to the metabolism of galactose and various alcohols, to which cells are not exposed in these feeding conditions (Supplemental Fig. S6E). In short, although not predicting the transcriptional program upon release, promoter-bound RNAPII predicts the strength of potential reignition of downstream genes.
To assess the heterogeneity of transcriptional activation across the cells and across release conditions, we performed single-cell transcriptomes 30 min after diluting cells either in rich glucose (2%) or lactate (0.5%) and ethanol (2%) medium. For both conditions, we found that genes with a RNAPII summit in their promoter in Q cells are highly enriched among the 10% most frequently expressed genes (Fig. 6B; Supplemental Fig. S6F) corresponding to genes detected in 32%–98% of cells in glucose and 22%–97% of cells in lactate–ethanol (Supplemental Fig. S6G). This suggests that promoter-bound RNAPII marks genes that can be pervasively transcribed in the population when Q cells are refed.
Pervasively transcribed genes with a RNAPII peak in their promoter highly overlap (Fig. 6B) between the two conditions, suggesting that, regardless of the available sugar, cells engage in a common program in the early stages of quiescence release. These common genes are enriched in protein synthesis functions (Supplemental Fig. S6H), including Ribi and RP genes. However, 24% of the promoter-bound RNAPII showing pervasive transcription upon release in lactate ethanol are not pervasively expressed in glucose. These are enriched for functions related to respiration (Supplemental Fig. S6H) and include the gluconeogenesis gene PYC1. Therefore, RNAPII peaks in promoter regions mark genes that can be mobilized differently to adapt to distinct environments.
Discussion
We investigated the relationship between telomere clustering and transcriptional dynamics during quiescence entry and return to growth. We show that transcriptional shutdown is partial and precedes telomere hyperclustering during quiescence entry. Similarly, transcriptional upregulation occurs before the dismantling of telomere hyperclustering upon return to growth. Yet, we show that these two dynamics are independent. This is reminiscent of rod cell nuclei of nocturnal mammals, which show a similar internalization of heterochromatin that is not accompanied by notable effects on genome expression (Solovei et al. 2009).
We also report a distinct, transcriptionally idle quiescent chromatin landscape, holding at promoters the potential for prompt restart in the form of RNAPII accumulation.
Quiescent chromatin is not transcriptionally inert
We report a twofold increase in RNAPII binding at the rDNA, together with a threefold decrease in the rest of the genome. Our calibrated ChIP-seq study, integrated with metabolically labeled transcriptomic data (Cucinotta et al. 2021), provides strong evidence for active transcription of 3% of protein-coding genes (class I), thus showing that Q cells are not transcriptionally inert. The sensitivity of 4tU-labeled transcript detection and RNAPII ChIP might cause an underestimation, and the actual figure could be up to 35.7% if considering only 4tU-signal.
RNAPII redistributes to promoter-bearing intergenes over several days
Although transcriptional shut down is observed after 2 days of culture, RNAPII binding continues to evolve at least until day 6, with different gene body association of RNAPII and its progressive accumulation at UASs of RP genes and inducible STM genes. Consistently, we observe a stronger intergenic RNAPII accumulation in Q cells resulting from medium exhaustion than in Q cells resulting from post-DS starvation.
Previous assessments of polymerase binding to quiescent chromatin were conflicting, with recent studies reporting a lack of enrichment at intergenes. Unlike Radonjic et al. (2005), who detected intergenic enrichment in unsorted SP populations, Young et al. (2017) found a bias toward the 3′ of CDS. This distribution correlates best with our early post-DS samples, suggesting a difference in the kinetics of quiescence entry, likely owing to differences in growth conditions such as aeration and medium pH (Opalek et al. 2023; Greenlaw et al. 2024). Data from the Tsukiyama laboratory, however, agree with our findings (Supplemental Fig. S4C; Swygert et al. 2019). Some of the reported discrepancies (Cucinotta et al. 2021) could be attributed to differential efficiency in immunoprecipitation, as tagged epitopes can lead to better enrichments, as previously reported (Jeronimo and Robert 2014; Hu et al. 2015). Finally, we observed the enrichment of the condensin subunit Brn1 (Swygert et al. 2019) at RNAPII Q peaks, in good agreement with published data showing the accumulation of condensin at RNAPII bound sites in other conditions (D'Ambrosio et al. 2008).
Bookmarking genes in quiescent yeast
Evidence for RNAPII pausing in budding yeast is limited, leading to the general belief that it does not occur. Although the negative elongation factor (NELF), absent in budding yeast, is linked to stable transcriptional pausing, it is not essential as shown in Schizosaccharomyces pombe (Booth et al. 2018; Core and Adelman 2019). To our knowledge, few reports of promoter-proximal seemingly inactive RNAPII, with the potential to reactivate, exist in budding yeast. RNAPII remains at the INO1 promoter for hours postrepression, enhancing reactivation upon reinduction and indicating epigenetic memory (Brickner and Walter 2004; Brickner et al. 2007; Light et al. 2010). Such bookmarking may explain the RNAPII presence upstream of genes transcribed during quiescence entry.
However, 220/1910 genes with an upstream RNAPII peak are not transcribed during quiescence entry, including GAL genes. This is reminiscent of RNAPII found together with PIC components, at promoters made accessible by the absence of Hda1 and Rpd3 deacetylases, in a state favorable for activation under Snf1 control (Tachibana et al. 2005, 2007).
Such an activation-prone state is consistent with our observation of RNAPII mostly upstream of genes seemingly ready to be highly transcribed within minutes of refeeding in at least two different conditions.
Inhibiting Kin28 using ATP analog-sensitive mutants (kin28-as) (Tietjen et al. 2010; Bataille et al. 2012; Jeronimo and Robert 2014) or anchor-away depletion (Wong et al. 2014) results in RNAPII accumulation at core promoters. RNAPII accumulation in quiescence, however, tends to occur 250 bp upstream of the TSS, further upstream (Steinmetz et al. 2006; Mayer et al. 2010; Bataille et al. 2012; Jeronimo and Robert 2014; Pelechano et al. 2014; Kubik et al. 2019) and rather coincides with reported locations for Mediator at UASs (Andrau et al. 2006; Fan et al. 2006; Ansari et al. 2009; Jeronimo and Robert 2014). Possibly related to our finding, Mediator subunits also accumulate at UASs of RP genes upon heat-shock (Sarkar et al. 2022).
Although our cross-linked chromatin mapping cannot exclude some enzyme proximity rather than DNA binding, recent studies using improved detection methods for engaged polymerase and small transcripts have mapped RNAPII at similar distances from the canonical PIC assembly (Xi et al. 2024), suggesting RNAPII recruitment may occur at UASs in cycling cells. Consistently, RNAPII intergenic signal can be detected at two-thirds of the quiescent peaks in growing cells, although not forming well-defined peaks. Furthermore, we detect some Ser5-P CTD phosphorylation at some of these intergenic peaks in Q cells, suggesting that at least some RNAPII might be active at these loci.
These observations are in agreement with in vitro studies showing transient RNA pol II interaction at activator-bound UASs before loading into the core promoter (Baek et al. 2021). Although RNAPII binding is not detected at UASs by ChIP in exponentially growing cells, it is clearly detected by ChEC-Seq2 at active STM genes (VanBelzen et al. 2024). The weak general levels of transcription in Q cells may uncover binding sites otherwise difficult to detect by ChIP in growing cells.
RSC was proposed to enable newly recruited RNAPII to progress into gene bodies upon release (Cucinotta et al. 2021). Furthermore, re-entry into cell cycle is delayed (Cucinotta et al. 2021) in the absence of the general transcription elongation factor TFIIS (Dst1) (Kettenberger et al. 2003; Wery et al. 2004; Kireeva and Kashlev 2009). Our results indicate that these factors favor transcription from RNAPII accumulated upstream of genes during quiescence.
We hypothesize that the odd RNAPII ChIP profile at these genes stems from altered dynamics of the transcription cycle, wherein RNAPII would bind UAS, only rarely engaging in transcription along the gene body. This idea is well supported with the recently published kinetic model of RNAPII transcription (VanBelzen et al. 2024). Such idle, minimal activity would occur stochastically in the population, contributing to maintain a responsive quiescent chromatin, which can be mobilized differently to adapt to distinct environments.
Methods
Strains and growth conditions
All S. cerevisiae strains used in this study, haploid (mating type a) and isogenic to the W303 background, are listed in Supplemental Table S1. Gene targeting for gene deletion and gene tagging was performed as previously described (Longtine et al. 1998). Cells were inoculated in yeast–peptone–dextrose 2% (YPD) and grown overnight before diluting to 0.1 OD600/mL to start the kinetics of entry into quiescence. Cells were grown at 30°C (except rpb1-1 strains, which were grown at 25°C), shaking at 250 rpm, at 1/10 volume in glass flasks with aeration caps. DS samples were harvested 2 h after glucose was no longer detectable in the medium, when transcriptional changes are detectable (Brauer et al. 2008). To induce quiescence by nutrient exhaustion (Q 6d-HD), cells were grown to reach SP (50–60 OD600/mL) at 30°C and then gradient-enriched in HD cells (see below). To induce quiescence by abrupt starvation (Q-like), cells were grown in YPD as described above for 24 h and then gradient-sorted (see below), and the recovered HD fraction was resuspended in sterile H2O and then incubated at 30°C, shaking, for another 24 h. The S. pombe strain used as spike-in for ChIP-seq was grown in yeast extract supplemented (YES) medium to mid-Log phase, in parallel to mid-Log phase S. cerevisiae samples (0.4–0.7 OD600/mL). For release from quiescence experiments, HD cells were enriched from a 6-day SP culture, washed in H2O, and incubated overnight at 30°C, under shaking. Then, they were resuspended at 1 OD/mL in fresh YPD at 1:10 volume:air ratio for the indicated times. For single-cell experiments, cells were released in either YPD (2% glucose) or YPLE (0.5% lactate, 2% ethanol). To recover mainly the HD population as cells progress into SP in the nutrient exhaustion kinetics, all samples after DS (24 h, 48 h, Q-like, Q6d) were gradient-sorted based on principles described previously (Allen et al. 2006). A detailed procedure is described in Supplemental Materials and Methods.
Transcription inhibition experiments
Transcription inhibition experiments were carried out on SP culture (7 days) or HD-enriched (quiescent) culture, as indicated in the corresponding figure. rpb1-1 cells were grown to SP at 25°C. Cells were pretreated for 2 h with the inhibitor (thiolutin SIGMA, final concentration at 10 µg/mL, or phenanthroline 100 µg/mL final, stock solutions in DMSO) or preincubated for 1 h at 37°C for the rpb1-1 strain. For each condition, 6 × 10⁷ cells (1 OD/mL) were released in fresh YPD only or in the presence of the corresponding inhibitor or temperature. Then, cultures were sampled after 30, 60, and 120 min of incubation, shaking, at 25°C, 30°C, or 37°C as indicated in the figure legend. For wash-out, all samples, including controls, were washed three times in 1× PBS and resuspended in fresh YPD only and then imaged after 30, 90, 120, and 240 min.
Imaging and Rap1-GFP foci quantification
Samples were harvested at the indicated time points, rinsed in H2O, and placed on a 4% agarose patch before imaging. Image acquisition was performed as described by Guidi et al. (2015), with modifications described in the Supplemental Materials and Methods. Image analysis relied on our custom-made software (https://github.com/mgPICT/NuFoQ), which was adapted from Guidi et al. (2015) to enable three-dimensional (3D) segmentation and quantification of nuclear foci. Further details can be found in the Supplemental Materials and Methods.
Sample harvesting for ChIP
For every time point in the kinetics of quiescence entry, 100 OD600 of cells was harvested for ChIP. An aliquot from the same sample was washed in H2O and placed on a 4% agarose patch before imaging. For each of the two biological replicates, WT Rpb3 (yAT1684) and FLAG-tagged (yAT3239, yAT3555) strains were grown with the same batch of YPD and processed together for ChIP and imaging. ChIP experiments, described in detail in the Supplemental Materials and Methods, were performed as previously described (Guidi et al. 2015; Ruault et al. 2021). qPCR primers are listed in Supplemental Table S2.
ChIP-seq data processing
Rpb3-FLAG ChIP-seq libraries were sequenced (single-end 50; HiSeq-rapid run) at the Institut Curie NGS platform. WT samples (yAT1684 and yAT3239) were sequenced together. WT IP samples for Log and Q (6d-HD) were resequenced together with sir3Δ samples in a different run. Thus, they were treated separately for analysis. For mapping, reads were competitively aligned to a hybrid S. pombe (ASM294v2.28) and S. cerevisiae genome (Engel et al. 2025) with Bowtie 2 (bowtie2-align-s -p 8) (Langmead and Salzberg 2012). To visualize subtelomeric genes, filtering was performed to allow up to three mismatches (grep -E “(^@|XM:i:[0-3])”).
To calibrate the ChIP signal, an occupancy ratio (OR) was calculated based on the number of uniquely mapped reads to either genome (experimental: S. cerevisiae; spike-in: S. pombe), present in IP and INPUT samples of the Rpb3-FLAG-tagged (yAT3239) and Rpb3-untagged (yAT1684) strains, as described previously (Hu et al. 2015). OR was used as a scaling factor to generate coverage tracks from IP samples (see below) (shown in all Genome Browser snapshots, and average profile plots, except when compared to other mappings, in Fig. 4D; Supplemental Fig. S4C), using deepTools (3.5.0) (Ramírez et al. 2016) BamCoverage with RPKM normalization. The coverage for all IP and INPUT samples is depicted in Supplemental Figure S4B.
scRNA-seq experiments
Single-cell encapsulation and library preparation were performed using the SingleCell3′-10x technology. For cell harvesting and counting, we adapted the 10x demonstrated protocol for methanol fixation (available upon request from 10x Genomics) (for more detail, see Supplemental Materials and Methods). For cell encapsulation, steps 1.2d and 1.2e of the 10x Genomics single-cell protocol version v3.1 were modified as follows: a gel beads and zymolyase suspension was prepared. A 100× stock of zymolyase (100 mg/mL, MP Biomedicals 8320932) solution was added to the gel bead suspension to reach 1.7× final concentration before loading on the chip. Note that previous studies in growing cells (Jariani et al. 2020; Vermeersch et al. 2022) have used 1× concentration, but that, for Q cells, this was not sufficient. Then, 50 µL of gel beads and zymolyase suspension was dispensed as indicated into row labeled 2 of the chip, before proceeding with library preparation according to the protocol. Samples were sequenced in a NovaSeq (PE28-10-10-90).
RNA-seq experiments
An equivalent of 25 OD600 nm of the cells was harvested, pelleted, flash-frozen, and stored at −70°C before processing with Ribopure yeast RNA (Invitrogen AM1926). Directional mRNA libraries (poly(A) enrichment) were processed and paired-end sequenced by Novogene Europe.
Data processing
ChIP-seq, scRNA-seq, and RNA-seq data processing details are described in the Supplemental Materials and Methods. Promoter-bearing intergenes (Fig. 4) overlapped by RNAPII peaks are listed in Supplemental Table S3. Rpb3-FLAG peaks’ summits falling in promoter-bearing intergenes (Fig. 4) are listed in Supplemental Table S4. TFBSs enriched in the vicinity (100 bp) of the strongest RNAPII summits (Fig. 5) are listed in Supplemental Table S5. R packages used for analyses are listed in Supplemental Table S6.
Data access
The Rpb3-FLAG ChIP-seq, scRNA-seq, and RNA-seq data generated in this study have been submitted to EMBL-EBI ArrayExpress (https://www.ebi.ac.uk/biostudies/arrayexpress) under accession numbers E-MTAB-14337 (ChIP-seq), E-MTAB-14980 (scRNA-seq), and E-MTAB-14983 (RNA-seq).
Competing interest statement
The authors declare no competing interests.
Acknowledgments
We thank the members of the Taddei laboratory and of UMR3664 for helpful discussions. The A.T. team was financially supported by funding from Labex DEEP (ANR-11-LABEX-0044 DEEP and ANR-10IDEX-0001-02 PSL), from Agence Nationale de la Recherche DNA-Life (ANR-15-CE12-0007), and DeSynLE (ANR-22-CE12-0013-01). M.B.P. was supported in part by a fellowship from Institut Curie (IC3i 2019) and by Labex DEEP (ANR-11-LABEX-0044 DEEP). Most bioinformatic analyses were performed on the core cluster of the Institut Français de Bioinformatique (IFB; ANR-11-INBS-0013), using an estimated 4762.68 h per CPU. We also thank the PICT-IBiSA@Pasteur imaging facility of the Institut Curie, a member of the France Bioimaging National Infrastructure (ANR-10-INBS-04).
Author contributions: I.L., M.B.P., and M.R. generated strains. M.B.P. and M.R. performed ChIP-seq experiments. M.B.P., M.R., and I.L. carried out imaging and ChIP-qPCR experiments. M.G. generated the software to quantify microscopy images. M.B.P. and U.S. processed ChIP-seq data. M.B.P. and G.L. performed scRNA-seq experiments. G.L. carried out scRNA-seq analyses and performed RNA-seq experiments. M.B.P. carried out all other bioinformatic analyses. A.T., M.R., A.M., G.L., and M.B.P. contributed to the design of the experiments. A.T. and A.M. obtained funding. A.T. and M.B.P. contributed to the interpretation of the data, the drafting of the figures, and the writing/revision of the manuscript.
Notes
[1] Supplementary material [Supplemental material is available for this article.]
[2] Article published online before print. Article, supplemental material, and publication date are at https://www.genome.org/cgi/doi/10.1101/gr.279874.124.
References
- ↵Abruzzi KC, Belostotsky DA, Chekanova JA, Dower K, Rosbash M. 2006. 3′-end formation signals modulate the association of genes with the nuclear periphery as well as mRNP dot formation. EMBO J 25: 4253–4262. 10.1038/sj.emboj.7601305
- ↵Allen C, Büttner S, Aragon AD, Thomas JA, Meirelles O, Jaetao JE, Benn D, Ruby SW, Veenhuis M, Madeo F, 2006. Isolation of quiescent and nonquiescent cells from yeast stationary-phase cultures. J Cell Biol 174: 89–100. 10.1083/jcb.200604072
- ↵Andrau J-C, van de Pasch L, Lijnzaad P, Bijma T, Koerkamp MG, van de Peppel J, Werner M, Holstege FCP. 2006. Genome-wide location of the coactivator mediator: binding without activation and transient Cdk8 interaction on DNA. Mol Cell 22: 179–192. 10.1016/j.molcel.2006.03.023
- ↵Ansari SA, He Q, Morse RH. 2009. Mediator complex association with constitutively transcribed genes in yeast. Proc Natl Acad Sci 106: 16734–16739. 10.1073/pnas.0905103106
- ↵Aragon AD, Quiñones GA, Thomas EV, Roy S, Werner-Washburne M. 2006. Release of extraction-resistant mRNA in stationary phase Saccharomyces cerevisiae produces a massive increase in transcript abundance in response to stress. Genome Biol 7: R9. 10.1186/gb-2006-7-2-r9
- ↵Aragon AD, Rodriguez AL, Meirelles O, Roy S, Davidson GS, Tapia PH, Allen C, Joe R, Benn D, Werner-Washburne M. 2008. Characterization of differentiated quiescent and nonquiescent cells in yeast stationary-phase cultures. Mol Biol Cell 19: 1271–1280. 10.1091/mbc.e07-07-0666
- ↵Badis G, Chan ET, van Bakel H, Pena-Castillo L, Tillo D, Tsui K, Carlson CD, Gossett AJ, Hasinoff MJ, Warren CL, 2008. A library of yeast transcription factor motifs reveals a widespread function for Rsc3 in targeting nucleosome exclusion at promoters. Mol Cell 32: 878–887. 10.1016/j.molcel.2008.11.020
- ↵Baek I, Friedman LJ, Gelles J, Buratowski S. 2021. Single-molecule studies reveal branched pathways for activator-dependent assembly of RNA polymerase II pre-initiation complexes. Mol Cell 81: 3576–3588.e6. 10.1016/j.molcel.2021.07.025
- ↵Bailey TL, Grant CE. 2021. SEA: simple enrichment analysis of motifs. bioRxiv 10.1101/2021.08.23.457422
- ↵Baker LA, Ueberheide BM, Dewell S, Chait BT, Zheng D, Allis CD. 2013. The yeast Snt2 protein coordinates the transcriptional response to hydrogen peroxide-mediated oxidative stress. Mol Cell Biol 33: 3735–3748. 10.1128/MCB.00025-13
- ↵Bataille AR, Jeronimo C, Jacques P-É, Laramée L, Fortin M-È, Forest A, Bergeron M, Hanes SD, Robert F. 2012. A universal RNA polymerase II CTD cycle is orchestrated by complex interplays between kinase, phosphatase, and isomerase enzymes along genes. Mol Cell 45: 158–170. 10.1016/j.molcel.2011.11.024
- ↵Booth GT, Parua PK, Sansó M, Fisher RP, Lis JT. 2018. Cdk9 regulates a promoter-proximal checkpoint to modulate RNA polymerase II elongation rate in fission yeast. Nat Commun 9: 543. 10.1038/s41467-018-03006-4
- ↵Bourbousse C, Barneche F, Laloi C. 2020. Plant chromatin catches the sun. Front Plant Sci 10: 1728. 10.3389/fpls.2019.01728
- ↵Brauer MJ, Huttenhower C, Airoldi EM, Rosenstein R, Matese JC, Gresham D, Boer VM, Troyanskaya OG, Botstein D. 2008. Coordination of growth rate, cell cycle, stress response, and metabolic activity in yeast. Mol Biol Cell 19: 352–367. 10.1091/mbc.e07-08-0779
- ↵Brickner JH, Walter P. 2004. Gene recruitment of the activated INO1 locus to the nuclear membrane. PLoS Biol 2: e342. 10.1371/journal.pbio.0020342
- ↵Brickner DG, Cajigas I, Fondufe-Mittendorf Y, Ahmed S, Lee P-C, Widom J, Brickner JH. 2007. H2A.Z-mediated localization of genes at the nuclear periphery confers epigenetic memory of previous transcriptional state. PLoS Biol 5: e81. 10.1371/journal.pbio.0050081
- ↵Candelli T, Challal D, Briand J-B, Boulay J, Porrua O, Colin J, Libri D. 2018. High-resolution transcription maps reveal the widespread impact of roadblock termination in yeast. EMBO J 37: e97490. 10.15252/embj.201797490
- ↵Carlson M. 1999. Glucose repression in yeast. Curr Opin Microbiol 2: 202–207. 10.1016/S1369-5274(99)80035-6
- ↵Casolari JM, Brown CR, Komili S, West J, Hieronymus H, Silver PA. 2004. Genome-wide localization of the nuclear transport machinery couples transcriptional status and nuclear organization. Cell 117: 427–439. 10.1016/S0092-8674(04)00448-9
- ↵Castro-Mondragon JA, Riudavets-Puig R, Rauluseviciute I, Berhanu Lemma R, Turchi L, Blanc-Mathieu R, Lucas J, Boddie P, Khan A, Manosalva Pérez N, 2022. JASPAR 2022: the 9th release of the open-access database of transcription factor binding profiles. Nucleic Acids Res 50: D165–D173. 10.1093/nar/gkab1113
- ↵Cioci F, Vu L, Eliason K, Oakes M, Siddiqi IN, Nomura M. 2003. Silencing in yeast rDNA chromatin: reciprocal relationship in gene expression between RNA polymerase I and II. Mol Cell 12: 135–145. 10.1016/s1097-2765(03)00262-4
- ↵Core L, Adelman K. 2019. Promoter-proximal pausing of RNA polymerase II: a nexus of gene regulation. Genes Dev 33: 960–982. 10.1101/gad.325142.119
- ↵Cucinotta CE, Dell RH, Braceros KC, Tsukiyama T. 2021. RSC primes the quiescent genome for hypertranscription upon cell-cycle re-entry. eLife 10: e67033. 10.7554/eLife.67033
- ↵D'Ambrosio C, Schmidt CK, Katou Y, Kelly G, Itoh T, Shirahige K, Uhlmann F. 2008. Identification of cis-acting sites for condensin loading onto budding yeast chromosomes. Genes Dev 22: 2215–2227. 10.1101/gad.1675708
- ↵Dang NX, Hincha DK. 2011. Identification of two hydrophilins that contribute to the desiccation and freezing tolerance of yeast (Saccharomyces cerevisiae) cells. Cryobiology 62: 188–193. 10.1016/j.cryobiol.2011.03.002
- ↵Davidson GS, Joe RM, Roy S, Meirelles O, Allen CP, Wilson MR, Tapia PH, Manzanilla EE, Dodson AE, Chakraborty S, 2011. The proteomics of quiescent and nonquiescent cell differentiation in yeast stationary-phase cultures. Mol Biol Cell 22: 988–998. 10.1091/mbc.e10-06-0499
- ↵DeRisi JL. 1997. Exploring the metabolic and genetic control of gene expression on a genomic scale. Science 278: 680–686. 10.1126/science.278.5338.680
- ↵Engel SR, Aleksander S, Nash RS, Wong ED, Weng S, Miyasato SR, Sherlock G, Cherry JM. 2025. Saccharomyces Genome Database: advances in genome annotation, expanded biochemical pathways, and other key enhancements. Genetics 229: iyae185. 10.1093/genetics/iyae185
- ↵Eshleman N, Luo X, Capaldi A, Buchan JR. 2020. Alterations of signaling pathways in response to chemical perturbations used to measure mRNA decay rates in yeast. RNA 26: 10–18. 10.1261/rna.072892.119
- ↵Fan X, Chou DM, Struhl K. 2006. Activator-specific recruitment of mediator in vivo. Nat Struct Mol Biol 13: 117–120. 10.1038/nsmb1049
- ↵Feodorova Y, Falk M, Mirny LA, Solovei I. 2020. Viewing nuclear architecture through the eyes of nocturnal mammals. Trends Cell Biol 30: 276–289. 10.1016/j.tcb.2019.12.008
- ↵Fleischer TC, Weaver CM, McAfee KJ, Jennings JL, Link AJ. 2006. Systematic identification and functional screens of uncharacterized proteins associated with eukaryotic ribosomal complexes. Genes Dev 20: 1294–1307. 10.1101/gad.1422006
- ↵Fuge EK, Braun EL, Werner-Washburne M. 1994. Protein synthesis in long-term stationary-phase cultures of Saccharomyces cerevisiae. J Bacteriol 176: 5802–5813. 10.1128/jb.176.18.5802-5813.1994
- ↵Galitski T, Saldanha AJ, Styles CA, Lander ES, Fink GR. 1999. Ploidy regulation of gene expression. Science 285: 251–254. 10.1126/science.285.5425.251
- ↵Gasch AP, Werner-Washburne M. 2002. The genomics of yeast responses to environmental stress and starvation. Funct Integr Genomics 2: 181–192. 10.1007/s10142-002-0058-2
- ↵Gray JV, Petsko GA, Johnston GC, Ringe D, Singer RA, Werner-Washburne M. 2004. “Sleeping beauty”: quiescence in Saccharomyces cerevisiae. Microbiol Mol Biol Rev 68: 187–206. 10.1128/MMBR.68.2.187-206.2004
- ↵Greenlaw A, Dell R, Tsukiyama T. 2024. Initial acidic media promotes quiescence entry in Saccharomyces cerevisiae. MicroPublication Biol 2024: 10.17912/micropub.biology.001071. 10.17912/micropub.biology.001071
- ↵Guidi M, Ruault M, Marbouty M, Loïodice I, Cournac A, Billaudeau C, Hocher A, Mozziconacci J, Koszul R, Taddei A. 2015. Spatial reorganization of telomeres in long-lived quiescent cells. Genome Biol 16: 206. 10.1186/s13059-015-0766-2
- ↵Hu B, Petela N, Kurze A, Chan K-L, Chapard C, Nasmyth K. 2015. Biological chromodynamics: a general method for measuring protein occupancy across the genome by calibrating ChIP-seq. Nucleic Acids Res 43: e132. 10.1093/nar/gkv670
- ↵Jariani A, Vermeersch L, Cerulus B, Perez-Samper G, Voordeckers K, Van Brussel T, Thienpont B, Lambrechts D, Verstrepen KJ. 2020. A new protocol for single-cell RNA-seq reveals stochastic gene expression during lag phase in budding yeast. eLife 9: e55320. 10.7554/eLife.55320
- ↵Jeronimo C, Robert F. 2014. Kin28 regulates the transient association of mediator with core promoters. Nat Struct Mol Biol 21: 449–455. 10.1038/nsmb.2810
- ↵Jona G, Choder M, Gileadi O. 2000. Glucose starvation induces a drastic reduction in the rates of both transcription and degradation of mRNA in yeast. Biochim Biophys Acta 1491: 37–48. 10.1016/S0167-4781(00)00016-6
- ↵Kettenberger H, Armache K-J, Cramer P. 2003. Architecture of the RNA polymerase II-TFIIS complex and implications for mRNA cleavage. Cell 114: 347–357. 10.1016/S0092-8674(03)00598-1
- ↵Kireeva ML, Kashlev M. 2009. Mechanism of sequence-specific pausing of bacterial RNA polymerase. Proc Natl Acad Sci 106: 8900–8905. 10.1073/pnas.0900407106
- ↵Klosinska MM, Crutchfield CA, Bradley PH, Rabinowitz JD, Broach JR. 2011. Yeast cells can access distinct quiescent states. Genes Dev 25: 336–349. 10.1101/gad.2011311
- ↵Kobayashi N, McClanahan TK, Simon JR, Treger JM, McEntee K. 1996. Structure and functional analysis of the multistress response gene DDR2 from Saccharomyces cerevisiae. Biochem Biophys Res Commun 229: 540–547. 10.1006/bbrc.1996.1840
- ↵Komarnitsky P, Cho E-J, Buratowski S. 2000. Different phosphorylated forms of RNA polymerase II and associated mRNA processing factors during transcription. Genes Dev 14: 2452–2460. 10.1101/gad.824700
- ↵Kubik S, Bruzzone MJ, Jacquet P, Falcone J-L, Rougemont J, Shore D. 2015. Nucleosome stability distinguishes two different promoter types at all protein-coding genes in yeast. Mol Cell 60: 422–434. 10.1016/j.molcel.2015.10.002
- ↵Kubik S, Bruzzone MJ, Challal D, Dreos R, Mattarocci S, Bucher P, Libri D, Shore D. 2019. Opposing chromatin remodelers control transcription initiation frequency and start site selection. Nat Struct Mol Biol 26: 744–754. 10.1038/s41594-019-0273-3
- ↵Langmead B, Salzberg SL. 2012. Fast gapped-read alignment with Bowtie 2. Nat Methods 9: 357–359. 10.1038/nmeth.1923
- ↵Laporte D, Courtout F, Salin B, Ceschin J, Sagot I. 2013. An array of nuclear microtubules reorganizes the budding yeast nucleus during quiescence. J Cell Biol 203: 585–594. 10.1083/jcb.201306075
- ↵Lauinger L, Li J, Shostak A, Cemel IA, Ha N, Zhang Y, Merkl PE, Obermeyer S, Stankovic-Valentin N, Schafmeier T, 2017. Thiolutin is a zinc chelator that inhibits the Rpn11 and other JAMM metalloproteases. Nat Chem Biol 13: 709–714. 10.1038/nchembio.2370
- ↵Light WH, Brickner DG, Brand VR, Brickner JH. 2010. Interaction of a DNA zip code with the nuclear pore complex promotes H2A.Z incorporation and INO1 transcriptional memory. Mol Cell 40: 112–125. 10.1016/j.molcel.2010.09.007
- ↵Longtine MS, Mckenzie AIII, Demarini DJ, Shah NG, Wach A, Brachat A, Philippsen P, Pringle JR. 1998. Additional modules for versatile and economical PCR-based gene deletion and modification in Saccharomyces cerevisiae. Yeast 14: 953–961. 10.1002/(SICI)1097-0061(199807)14:10<953::AID-YEA293>3.0.CO;2-U
- ↵Martinez MJ, Roy S, Archuletta AB, Wentzell PD, Anna-Arriola SS, Rodriguez AL, Aragon AD, Quiñones GA, Allen C, Werner-Washburne M. 2004. Genomic analysis of stationary-phase and exit in Saccharomyces cerevisiae: gene expression and identification of novel essential genes. Mol Biol Cell 15: 5295–5305. 10.1091/mbc.e03-11-0856
- ↵Mayer A, Lidschreiber M, Siebert M, Leike K, Söding J, Cramer P. 2010. Uniform transitions of the general RNA polymerase II transcription complex. Nat Struct Mol Biol 17: 1272–1278. 10.1038/nsmb.1903
- ↵McKnight JN, Boerma JW, Breeden LL, Tsukiyama T. 2015. Global promoter targeting of a conserved lysine deacetylase for transcriptional shutoff during quiescence entry. Mol Cell 59: 732–743. 10.1016/j.molcel.2015.07.014
- ↵Miles S, Li L, Davison J, Breeden LL. 2013. Xbp1 directs global repression of budding yeast transcription during the transition to quiescence and is important for the longevity and reversibility of the quiescent state. PLoS Genet 9: e1003854. 10.1371/journal.pgen.1003854
- ↵Miles S, Bradley GT, Breeden LL. 2021. The budding yeast transition to quiescence. Yeast 38: 30–38. 10.1002/yea.3546
- ↵Miralles VJ, Serrano R. 1995. A genomic locus in Saccharomyces cerevisiae with four genes up-regulated by osmotic stress. Mol Microbiol 17: 653–662. 10.1111/j.1365-2958.1995.mmi_17040653.x
- ↵Ocampo J, Chereji RV, Eriksson PR, Clark DJ. 2019. Contrasting roles of the RSC and ISW1/CHD1 chromatin remodelers in RNA polymerase II elongation and termination. Genome Res 29: 407–417. 10.1101/gr.242032.118
- ↵Opalek M, Tutaj H, Pirog A, Smug BJ, Rutkowska J, Wloch-Salamon D. 2023. A systematic review on quiescent state research approaches in S. cerevisiae. Cells 12: 1608. 10.3390/cells12121608
- ↵Pelechano V, Wei W, Jakob P, Steinmetz LM. 2014. Genome-wide identification of transcript start and end sites by transcript isoform sequencing. Nat Protoc 9: 1740–1759. 10.1038/nprot.2014.121
- ↵Qiu C, Arora P, Malik I, Laperuta AJ, Pavlovic EM, Ugochukwu S, Naik M, Kaplan CD. 2024. Thiolutin has complex effects in vivo but is a direct inhibitor of RNA polymerase II in vitro. Nucleic Acids Res 52: 2546–2564. 10.1093/nar/gkad1258
- ↵Radonjic M, Andrau J-C, Lijnzaad P, Kemmeren P, Kockelkorn TTJP, van Leenen D, van Berkum NL, Holstege FCP. 2005. Genome-wide analyses reveal RNA polymerase II located upstream of genes poised for rapid response upon S. cerevisiae stationary phase exit. Mol Cell 18: 171–183. 10.1016/j.molcel.2005.03.010
- ↵Ramírez F, Ryan DP, Grüning B, Bhardwaj V, Kilpert F, Richter AS, Heyne S, Dündar F, Manke T. 2016. deepTools2: a next generation web server for deep-sequencing data analysis. Nucleic Acids Res 44: W160–W165. 10.1093/nar/gkw257
- ↵Rossi MJ, Kuntala PK, Lai WKM, Yamada N, Badjatia N, Mittal C, Kuzu G, Bocklund K, Farrell NP, Blanda TR, 2021. A high-resolution protein architecture of the budding yeast genome. Nature 592: 309–314. 10.1038/s41586-021-03314-8
- ↵Ruault M, Scolari VF, Lazar-Stefanita L, Hocher A, Loïodice I, Koszul R, Taddei A. 2021. Sir3 mediates long-range chromosome interactions in budding yeast. Genome Res 31: 411–425. 10.1101/gr.267872.120
- ↵Sarkar D, Zhu ZI, Knoll ER, Paul E, Landsman D, Morse RH. 2022. Mediator dynamics during heat shock in budding yeast. Genome Res 32: 111–123. 10.1101/gr.275750.121
- ↵Schäfer G, McEvoy CRE, Patterton H-G. 2008. The Saccharomyces cerevisiae linker histone Hho1p is essential for chromatin compaction in stationary phase and is displaced by transcription. Proc Natl Acad Sci 105: 14838–14843. 10.1073/pnas.0806337105
- ↵Schofield JA, Hahn S. 2023. Broad compatibility between yeast UAS elements and core promoters and identification of promoter elements that determine cofactor specificity. Cell Rep 42: 112387. 10.1016/j.celrep.2023.112387
- ↵Schüller H-J. 2003. Transcriptional control of nonfermentative metabolism in the yeast Saccharomyces cerevisiae. Curr Genet 43: 139–160. 10.1007/s00294-003-0381-8
- ↵Solovei I, Kreysing M, Lanctôt C, Kösem S, Peichl L, Cremer T, Guck J, Joffe B. 2009. Nuclear architecture of Rod photoreceptor cells adapts to vision in mammalian evolution. Cell 137: 356–368. 10.1016/j.cell.2009.01.052
- ↵Steinmetz EJ, Warren CL, Kuehner JN, Panbehi B, Ansari AZ, Brow DA. 2006. Genome-wide distribution of yeast RNA polymerase II and its control by Sen1 helicase. Mol Cell 24: 735–746. 10.1016/j.molcel.2006.10.023
- ↵Swygert SG, Kim S, Wu X, Fu T, Hsieh T-H, Rando OJ, Eisenman RN, Shendure J, McKnight JN, Tsukiyama T. 2019. Condensin-dependent chromatin compaction represses transcription globally during quiescence. Mol Cell 73: 533–546.e4. 10.1016/j.molcel.2018.11.020
- ↵Swygert SG, Lin D, Portillo-Ledesma S, Lin P-Y, Hunt DR, Kao C-F, Schlick T, Noble WS, Tsukiyama T. 2021. Local chromatin fiber folding represses transcription and loop extrusion in quiescent cells. eLife 10: e72062. 10.7554/eLife.72062
- ↵Tachibana C, Yoo JY, Tagne J-B, Kacherovsky N, Lee TI, Young ET. 2005. Combined global localization analysis and transcriptome data identify genes that are directly coregulated by Adr1 and Cat8. Mol Cell Biol 25: 2138–2146. 10.1128/MCB.25.6.2138-2146.2005
- ↵Tachibana C, Biddick R, Law GL, Young ET. 2007. A poised initiation complex is activated by SNF1. J Biol Chem 282: 37308–37315. 10.1074/jbc.M707363200
- ↵Taddei A, Van Houwe G, Hediger F, Kalck V, Cubizolles F, Schober H, Gasser SM. 2006. Nuclear pore association confers optimal expression levels for an inducible yeast gene. Nature 441: 774–778. 10.1038/nature04845
- ↵Teytelman L, Thurtle DM, Rine J, van Oudenaarden A. 2013. Highly expressed loci are vulnerable to misleading ChIP localization of multiple unrelated proteins. Proc Natl Acad Sci 110: 18602–18607. 10.1073/pnas.1316064110
- ↵Tietjen JR, Zhang DW, Rodríguez-Molina JB, White BE, Akhtar MS, Heidemann M, Li X, Chapman RD, Shokat K, Keles S, 2010. Chemical-genomic dissection of the CTD code. Nat Struct Mol Biol 17: 1154–1161. 10.1038/nsmb.1900
- ↵Tirosh I, Barkai N. 2008. Two strategies for gene regulation by promoter nucleosomes. Genome Res 18: 1084–1091. 10.1101/gr.076059.108
- ↵VanBelzen J, Sakelaris B, Brickner DG, Marcou N, Riecke H, Mangan NM, Brickner JH. 2024. Chromatin endogenous cleavage provides a global view of yeast RNA polymerase II transcription kinetics. eLife 13: RP100764. 10.7554/eLife.100764
- ↵Vermeersch L, Jariani A, Helsen J, Heineike BM, Verstrepen KJ. 2022. Single-cell RNA sequencing in yeast using the 10x genomics chromium device. In Yeast functional genomics: methods and protocols. Methods in molecular biology (ed. Devaux F), pp. 3–20. Springer, New York.
- ↵Werner-Washburne M, Braun EL, Crawford ME, Peck VM. 1996. Stationary phase in Saccharomyces cerevisiae. Mol Microbiol 19: 1159–1166. 10.1111/j.1365-2958.1996.tb02461.x
- ↵Wery M, Shematorova E, Van Driessche B, Vandenhaute J, Thuriaux P, Van Mullem V. 2004. Members of the SAGA and mediator complexes are partners of the transcription elongation factor TFIIS. EMBO J 23: 4232–4242. 10.1038/sj.emboj.7600326
- ↵Wong KH, Jin Y, Struhl K. 2014. TFIIH phosphorylation of the Pol II CTD stimulates mediator dissociation from the preinitiation complex and promoter escape. Mol Cell 54: 601–612. 10.1016/j.molcel.2014.03.024
- ↵Xi S, Nguyen T, Murray S, Lorenz P, Mellor J. 2024. Size fractionated NET-seq reveals a conserved architecture of transcription units around yeast genes. Yeast 41: 222–241. 10.1002/yea.3931
- ↵Young CP, Hillyer C, Hokamp K, Fitzpatrick DJ, Konstantinov NK, Welty JS, Ness SA, Werner-Washburne M, Fleming AB, Osley MA. 2017. Distinct histone methylation and transcription profiles are established during the development of cellular quiescence in yeast. BMC Genomics 18: 107. 10.1186/s12864-017-3509-9