
Abstract
Many essential cellular processes require RNA to interact with protein(s) to form ribonucleic protein complexes (RNPs). For example, all cellular proteins are produced by the ribosome, a large and stable RNP. Gene splicing requires a choreography of numerous small and large RNPs; even the replication of telomeric DNA requires an RNP. All these examples are stable RNPs that exhibit specific sedimentation rates (e.g., in a sucrose gradient) based on the composition of RNA and protein. In this study, we aimed to identify RNA components of discrete RNPs on a transcriptome-wide scale. Using sucrose gradient sedimentation followed by sequencing, we identified 1057 RNA transcripts, both coding and noncoding, that are likely to be components of cellular RNPs. We named these transcripts gradient-enriched transcripts (GETs). GETs were predominantly nuclear, metabolically stable, and they were not the major splice isoforms, but instead they were mostly retained-intron isoforms, each containing a specific retained intron, and this intron retention phenomenon is conserved in humans and mice. Collectively, our study reveals a widespread phenomenon of a specific intron being retained in a stable nuclear RNPs.
Almost all known regulatory RNAs function via forming RNA-protein complexes (RNPs). RNPs are formed through highly stable intermolecular interactions between RNA and protein(s). It is also known that RNPs form biomolecular subcompartments separated by liquid phase in the eukaryotic cell nucleus to optimize gene expression (Shine et al. 2024). Therefore, RNP formation is known to be essential to core cellular processes such as splicing, RNA degradation, translation, and telomere elongation, among many more examples (Wahl et al. 2009; Blackburn and Collins 2011; Decker et al. 2022). However, RNPs and/or their constituent RNA components are limited to a few known examples; thus, we do not yet know the diversity and spectrum of RNPs on a transcriptome-wide scale.
RNPs can be characterized in vitro by their specific sedimentation properties. For example, the ribosomal RNAs (rRNAs) form two discrete RNPs with specific rate-zonal sedimentation properties. When cellular extracts are run through a gradient of sucrose concentrations (sucrose gradient), the ribosomal RNPs stay intact and form characteristic sedimentation profiles—indicative of mono-ribosomes and polysomes. Importantly, the rRNA is present across the gradient, but the stable complexes migrate together, resulting in rRNA enrichment in specific fractions. Thus, the ribosome is an essential RNP that can be identified by a characteristic sedimentation profile.
We set out to identify novel RNPs transcriptome-wide using sucrose gradient sedimentation coupled with RNA sequencing (RNA-seq). We also wanted to test whether known nuclear lncRNAs will appear as discrete RNPs. Specifically, we sedimented native human induced pluripotent cell (hiPSC) extracts and collected 10 distinct fractions of each sucrose gradient. This was followed by extensive RNA-seq (∼120 M reads per sample) of each fraction across three independent cellular extracts. Together, these samples represent more than 1 billion reads per cell extract. This approach enabled us to reliably measure sedimentation profiles for over 76,000 transcripts in hiPSCs. Our study identifies a wide diversity of cellular RNPs, many of which retain a specific intron and form discrete RNPs that are nuclear and also resistant to decay in hiPSCs.
Results
To identify stable ribonucleoproteins that exhibit a discrete and specific sedimentation property, we used a sucrose gradient sedimentation approach coupled with RNA sequencing. Specifically, we used native human induced pluripotent stem cell extracts as input into an optimized sucrose gradient ranging from 30% to 60% sucrose in the gradient. After centrifugation, gradients were fractionated into 12 uniformly defined sedimentation zones or “fractions.” This process was repeated for three independently grown hiPSC extracts and three independent sucrose gradient fractionations. As a positive control for our approach, the absorbance (254 nm) traces of our gradient fractions identified ribosomal monosome (40, 60, and 80S on fractions 3–6) to polysome fractions (fractions 7–12) (Supplemental Fig. S1A).
After fractionation of native RNPs in 12 distinct fractions of cellular extracts, we performed RNA-seq on 10 of the fractions (fractions 2–11, to avoid run off at beginning or end of fractionation) for all three replicates (Fig. 1A). Sequencing libraries were constructed after ribosomal RNA depletion, which allowed the sequencing of both polyadenylated and non-polyadenylated RNAs. For each RNA-seq sample, we obtained ∼120 million reads per sample (gradient fraction). Notably, because each fraction is, in effect, 10-fold enriched for a given RNA population in a cell, this amounts to a total of 3.6 billion reads of RNA across independent extracts, thus giving us a comprehensive look into the RNA populations and their sedimentation properties. Our approach is similar to that used in two other studies termed GradSeq (gradient-seq) in bacteria and ATLAS-seq in liver tissue (Adekunle and Wang 2020; Hör et al. 2020). The same gradient approach but with a slightly different protocol has also been used to study translational initiation and decay (Schneider et al. 2022). As such and for simplicity, we will refer to our approach as GRADseq after the original publication for identifying small bacterial RNAs.
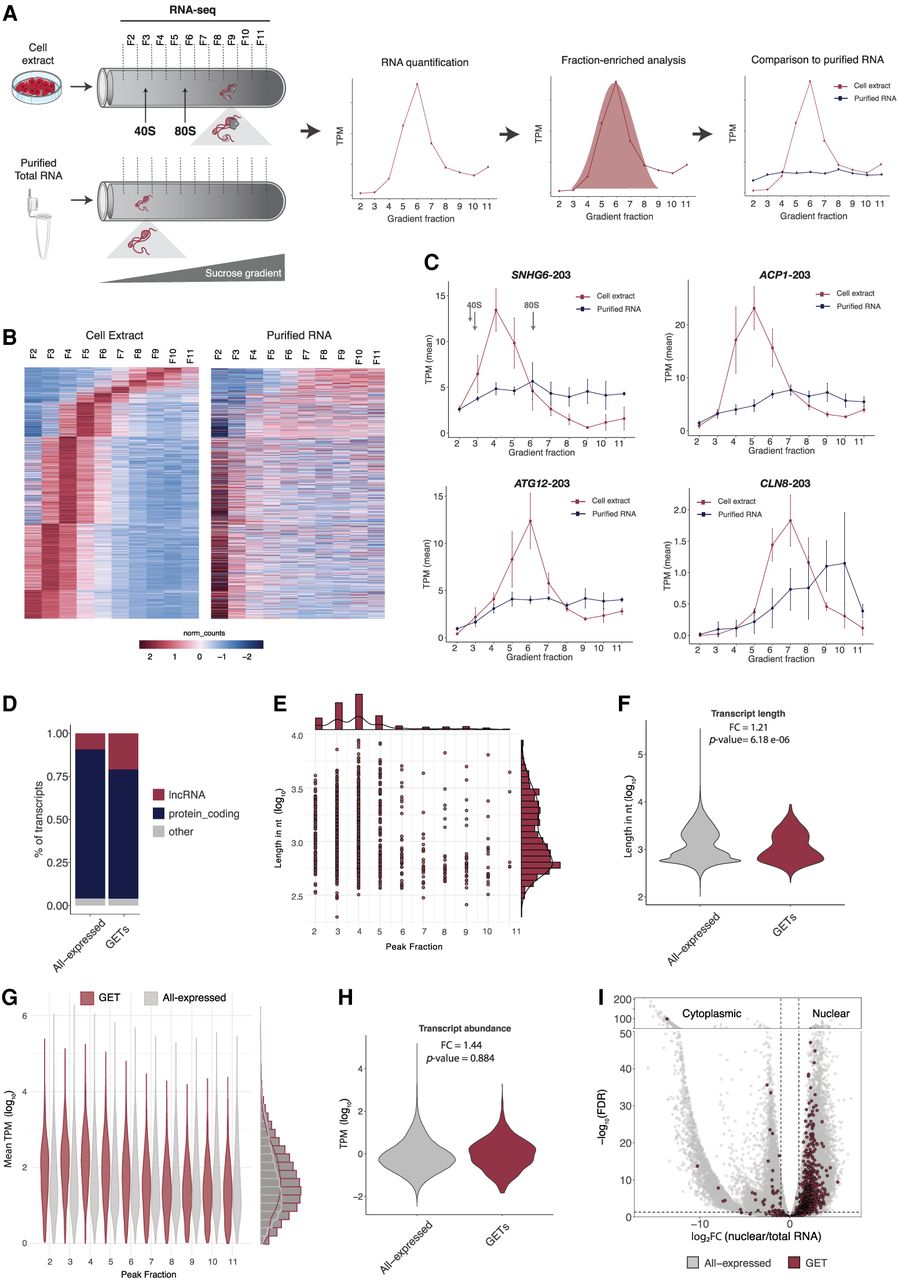
Identification of gradient-enriched transcripts. (A) Schematic representation of experimental approach. Cell extracts or purified total RNA were loaded onto 30%–60% sucrose gradients, followed by centrifugation, fractionation, and RNA sequencing of each gradient fraction. 40S and 80S sedimentation coefficients are indicated for reference. TPM (transcripts per million) gives abundance of a particular RNA transcript per gradient fraction. Distribution of a particular RNA in cell extract (red) and in purified total RNA (blue). (B) Heat map representing the abundance (normalized counts) of RNA transcripts in each gradient fraction of cell extracts and purified RNA gradients. Columns are gradient fractions; rows are RNA transcripts. (C) Examples of GETs and their RNA abundance throughout the gradient. 40S and 80S sedimentation coefficients are indicated for reference. (D) Bar plot of percentage of lncRNAs and protein coding genes in All-expressed and GETs. (E) GET length in nucleotides (log10) in each gradient fraction where GETs showed maximum abundance (peak fraction). On the top and side, bar plots represent the number of events. (F) Distribution of GET length in nucleotides (log10) compared to the other expressed transcripts in the cell (All-expressed). FC: Fold change of median values, P-value: two-sided t-test. (G) GET abundance in TPM (log10) in peak gradient fraction compared to other expressed transcripts in the cell (All-expressed). On the side, bar plots representing the number of events. (H) Distribution of GET abundance in TPM (log10) compared to the other expressed transcripts in the cell (All-expressed). P-value: two-sided t-test. (I) Scatterplot representing the nuclear to total ratio of RNA abundance and indication of nuclear or cytoplasmic localization. Fisher's exact test: P-value < 2.2 × 10⁻¹⁶.
GRADseq: identification of gradient-enriched transcripts (GETs)
Our goal is to purify native RNPs using GRADseq that exhibit discrete and specific sedimentation profiles. However, this biophysical property could also be composed of RNA-RNA only interactions forming a stable complex. We note that it is unlikely that RNA-DNA interactions are driving sedimentation in the fractions we purified—these would be in much larger fractions, as sonication was not applied to cell extracts.
We reasoned that a good control for RNA-RNA interactions (without the participation of proteins) is performing the same GRADseq procedure with native RNA purified from cell extracts, in contrast to total cellular extracts. This would reduce complex formation to RNA-RNA only interactions, as cellular components (proteins, DNA, etc.) are extracted from these samples. To this end, we isolated total cellular extracts the same as above, then purified total RNA using phenol-based methods (e.g., TRIzol). Next, purified RNA was run through the same GRADseq procedure and sequenced to a similar sequencing “depth.” In this scenario, any given RNA that has a similar sedimentation profile in cell extracts and purified RNA would not be an RNP component (would most likely participate in RNA-RNA only interaction) and, therefore, would be filtered out (Fig. 1A).
To identify which RNA species exhibit specific sedimentation profiles, we quantified all RNAs across the 10 fractions (F2–F11) for both cell extract samples and purified, deproteinized RNA (Fig. 1A). This provides a transcript level quantification (y-axis) across each gradient fraction (x-axis). We reason that, like the ribosome, any other discrete, stable RNP would have a peak of abundance in a specific fraction, followed by low to no abundance in other fractions. This would represent a peak in abundance for a given transcript in a specific fraction and a low standard deviation of abundance across other fractions (or width of the Gaussian model). Moreover, this “Gaussian” abundance pattern across gradient fractions would not occur in RNA purified away from cellular extracts.
Based on this logic, we developed a stringent bioinformatics pipeline to identify RNA transcripts (of any kind) that are enriched or vastly more abundant in a specific fraction. Briefly, our statistical approach has three steps: (1) the abundance throughout the gradient fractions should fit a Gaussian distribution (peak in one fraction, followed by distribution of lower abundances across the other fractions); (2) the difference between the highest (peak) and the lowest abundance gradient fraction should be at least 10-fold; and (3) the abundance throughout the purified RNA gradient fractions cannot have the properties mentioned in (1) and (2) (Fig. 1A).
The analysis was performed at the transcript/isoform level from GENCODE/Ensembl annotation (version 38) (Mudge et al. 2025), and it was initially filtered for those transcripts that were considered reliably detected in the cells (sum of TPM throughout 10 fractions >1). From the 76,989 unique transcripts expressed in the cells, only 2702 (3.5%) had abundance levels fitting a Gaussian distribution across the gradient fractions. Comparing the higher abundance gradient fraction (peak fraction) to the lower abundance gradient fraction gave us the estimated enrichment of a particular RNA in a specific fraction (peak fraction). When a cutoff of 10-fold was applied to the 2702 Gaussian forming transcripts, 1258 transcripts (46.5%) were at least 10-fold enriched in a specific fraction. Finally, we removed any transcript that formed a Gaussian in the purified RNA samples (201 transcripts, 16%). As a result, we found 1057 RNA transcripts, comprising 909 genes, that showed robust, reproducible and specific sedimentation profiles in native cell extracts and not in RNA only samples (Fig. 1B,C). These transcripts contained both lncRNAs and protein coding genes (Fig. 1D; Supplemental Fig. S1B). The distribution pattern of RNA abundance throughout the gradient was specific to each transcript, revealing the diversity of sedimentation profiles of native RNPs. We now refer to these stringently defined RNAs with discrete sedimentation profiles as gradient-enriched transcripts.
To investigate if GETs are conserved, we performed the same set of experiments using mouse stem cells (mESCs) (Supplemental Fig. S3). After applying the same analysis described above, we found 1108 RNA transcripts (959 genes) with specific sedimentation profiles. The majority of these transcripts were protein-coding genes and some lncRNAs. Similar to human, mouse transcripts showed a diversity of sedimentation profiles of native RNPs (Supplemental Fig. S3A–C).
Basic properties of gradient-enriched transcripts
We next sought to investigate the properties of GETs relative to non-GETs to address several questions:
Does RNA transcript length correlate with the sedimentation profile? Because the sedimentation coefficient S increases linearly with a molecule's mass, a simple expectation would be for larger RNAs to form larger RNPs and have a larger S, just as the 60S ribosomal subunit (5300 nt of RNA) sediments more rapidly than the 40S subunit (1800 nt of RNA). To address this question, we compared transcript length to the fraction number where the GET was enriched (Fig. 1E). Contrary to our hypothesis, we did not observe a significant correlation between transcript length and fraction number (r: −0.04, P-value: 0.2). Notably, in some cases, transcripts over 7 kb in length (as in NHLH2-202 and TTC34-201) were enriched in the upper fractions (F2–F3, respectively). Conversely, transcripts with <400 nt in length were enriched in the bottom fractions (F10–F11). Thus, a transcript 18× longer can end up in the upper fraction and one 18× times smaller in the bottom fraction measured. Additionally, we compared the overall transcript length of GETs and all transcripts expressed (called “All-expressed”) using whole cell RNA-seq data. The results showed that the distribution of length (bp) of GETs did not strongly differ from “All-expressed” (Fig. 1F). We also observed that the GETs identified in the mouse data did not have a transcript length and fraction number correlation, nor did GETs’ transcript length differ from “All-expressed” transcripts (Supplemental Fig. S3D,E). Ttc8-204, for example, peaks at fraction 10, and it has 800 nt in length, whereas Phtf1os-201 peaks at fraction 2 and has >4000 nt in spliced length. Overall, we do not observe a significant correlation between GET length and sedimentation profile.
Are GETs represented only by highly abundant RNAs? Ribosomal RNAs are examples of an RNA that forms RNPs with a very specific sedimentation profile, and they are highly abundant in the cell. Thus, we tested if GETs identified here were also highly abundant relative to non-GETs in the same sucrose gradient fraction. To this end, we measured the abundance of GETs in a given fraction relative to non-GETs and performed a fold change analysis to see if GET TPM values were more abundant than other transcripts in general. We observe that GETs do not have higher abundance than non-GETs (fold change: 0.34, P-value: 0.06). Thus, we observe many low abundance transcripts (e.g., lncRNAs) that form GETs in fraction numbers where other transcripts of much higher abundance do not form GETs (Fig. 1G; Supplemental Fig. S1B). We also compared the overall transcript abundance in cells of GETs to “All-expressed” using whole-cell RNA-seq data. The results showed that the distribution of abundance (TPM) of GETs did not differ from all other transcripts in both human (Fig. 1H) and mouse stem cells (Supplemental Fig. S3F,G).
What is the subcellular localization of GETs? We next wanted to determine if GETs were more nuclear, cytoplasmic, or equally distributed. Specifically, we fractionated hiPSCs into nuclear and total cellular fractions and performed RNA-seq in three replicates. Nuclear to total RNA ratios were calculated for all transcripts and compared between GETs and “All-expressed” transcripts. We observed a striking enrichment (Fisher's exact test P-value < 2.2 × 10⁻¹⁶) of GETs in the nucleus (Fig. 1I). Specifically, 93.9% of GETs are more enriched in the nucleus than in the cytoplasm.
What is the diversity of sedimentation profiles for GETs? We observed GETs in all 10 fractions measured (Fig. 1B,C; Supplemental Fig. S1C). Notably, most GETs showed peak sedimentation in fractions F3 and F4, corresponding to 40 and 60S (278 and 367 transcripts, respectively, 61% in total). We further note that this trend of enrichment in F3–F4 was similar for lncRNA and mRNA transcript types (Supplemental Fig. S1B).
Collectively, we observed that GETs are not due to length of transcript nor transcript abundance, and they are diverse in sedimentation profiles and enriched in the nucleus.
Isoform level properties of gradient-enriched transcripts
It is well known that many RNA isoforms of the same gene, due to alternative RNA splicing and transcription, co-exist in the same cell (Kornblihtt et al. 2013). Thus, we hypothesized that GETs may be derived from a specific isoform, whereas the other isoforms do not form GETs. Indeed, our sedimentation protocol was able to identify different isoforms transcribed from the same gene enriched in distinct gradient fractions. For example, the protein-coding gene SUPT7L produced two isoforms that differ by one exon (Fig. 2A,B). Isoform SUPT7L-204 was a GET, although isoform SUPT7L-203 was not. Moreover, this was due to the inclusion of a specific exon in the GET isoform (Fig. 2A). This exemplifies how two isoforms from the same gene, even when mostly similar in sequence, can have discrete and nondiscrete sedimentation profiles in the same cell extract. Similarly, GET isoform Akap8-203 was found in mouse cell extracts as a GET whereas isoform Akap8-216 was not (Supplemental Fig. S3H).
GET isoforms and their properties. (A) Genome browser tracks of gradient fractions RNA-seq data at SUPT7L locus. Dashed line indicates exon inclusion and accumulation of reads peaking in F4. (B) RNA abundance throughout the gradient for SUPT7L isoforms. (C) Distribution of GET length in bases and abundance in TPM (log10) compared to non-GET isoforms from the same genes. P-value: two-sided t-test. (D) Distribution of cell localization of GETs and non-GET from the same gene based on nuclear/total RNA abundance (logFC). Fisher's exact test: P-value < 2.2 × 10⁻¹⁶. The RNAs falling between the two dashed lines occur in both nucleus and cytoplasm. (E) Distribution of GET length in bases and (F) abundance in TPM (log10) compared to MANE isoform from the same gene. P-value: two-sided t-test. (G) Distribution of cell localization of GETs and MANE isoform from the same gene based on nuclear/total RNA abundance (logFC). Fisher's exact test: P-value < 2.2 × 10⁻¹⁶.
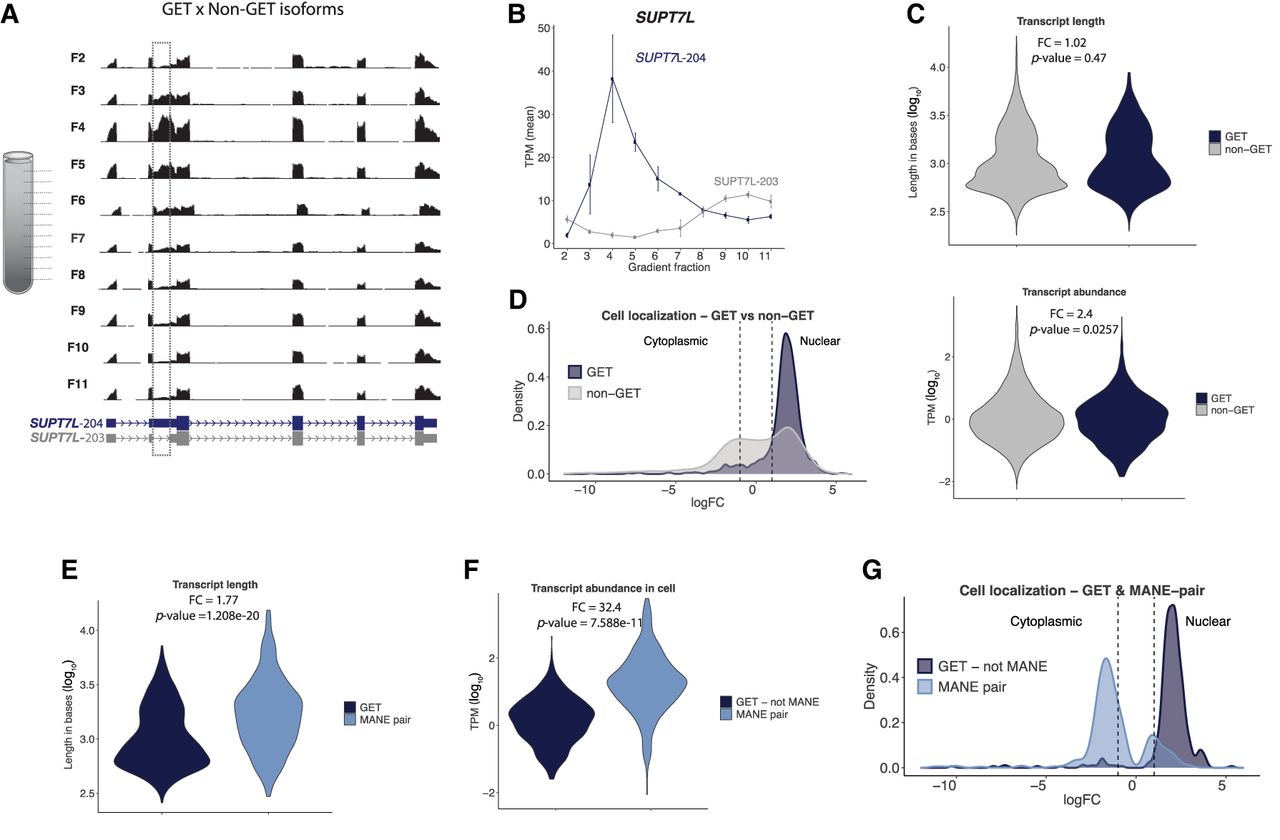
Based on the above results, we wanted to further investigate what was unique to GET isoforms versus non-GET isoforms. Specifically, we compared transcript length, abundance, and subcellular localization of GETs to the non-GET isoforms from the same gene (Fig. 2C,D). Whereas the transcript length did not show any difference, the abundance of non-GET isoforms was slightly higher than of GETs (average TPM 17.3 for non-GETs and 7.2 for GETs, P-value = 0.0257). We note that, distinct to what was shown for the entire group of GETs and non-GETs (Fig. 1H) where there was not a significant difference in abundance, when we compare only transcripts from the same gene, abundance might play a role. GETs were enriched in the nucleus compared to non-GETs (Fig. 2D).
To look deeper into the transcript isoforms, we needed a consensus isoform annotation for human genes. An international collaboration, the Matched Annotation Project (MANE), was established to define a genome-wide set of representative transcripts and corresponding proteins (when applicable) for human genes (https://www.ncbi.nlm.nih.gov/refseq/MANE/). The result is the MANE-isoform that is a consensus well-observed “representative isoform” for a given gene, usually the constitutive isoform. This means that each gene has only one representative isoform in this list, which is believed to be the main RNA isoform for that gene. We used the MANE-isoform annotation to interrogate if GET transcripts were considered the “representative isoform” of a gene or not.
Notably, most GETs (>98%) are not part of the MANE-isoform list. This specifically included 771 out of 792 protein-coding GETs that are not part of the MANE-isoform list. Next, we compared transcript length, abundance, and subcellular localization of each GET to the MANE-isoform from the same gene. GETs are shorter transcripts (fold change 1.77) and much less abundant (fold change 32.4) when compared to their MANE counterpart isoform (Fig. 2E,F). GET isoforms are also more nuclear-enriched than the MANE-isoform for the same gene (Fig. 2G). Therefore, the MANE-isoform is cytoplasmic-enriched and less likely to form a Gaussian distribution in a sedimentation gradient. There is not a MANE transcript list for the mouse transcriptome, so instead we used the RefSeq-select subset of all mice transcripts. Following MANE rationale, RefSeq-select is a representative group of transcripts for the main biology of that gene based on expression levels and exon conservation. The mice GETs were also shorter (fold change 0.55) and present in lower abundance (fold change 2.23) when compared to the RefSeq-select isoform for the same gene (Supplemental Fig. S3I,J). Collectively, these results suggest that GETs could represent alternative isoforms of genes (not MANE nor RefSeq-select) and are not being translated because they are biased to nuclear localization and this property is conserved in humans and mice.
Specific introns are retained in GETs
Transcript isoforms are annotated as retained introns versus nonretained introns by GENCODE or nonsense-mediated decay and other varieties (Mudge et al. 2025). We used these “isoform subcategories” to determine if there was a specific subcategory enriched in GETs versus all transcripts expressed. We found that the most enriched category, representing 482 transcripts (45.2% of GETs), was annotated as retained-intron isoforms (Fig. 3A; Supplemental Fig. S2). In sharp contrast, the mRNA isoforms (those without retained introns, called protein-coding isoforms) represented only 17.3% of GETs, despite their high abundance in the cell (43% in the “All-expressed” group). This suggests that mRNAs are prevented from forming GETs (17.3% GET vs. 43% expressed) and intron-retained isoforms are far more likely to form GETs (45.2% GET vs. 23.2% expressed). We observed that the same enrichment for intron-retained isoforms was observed in the mouse data set. We observed 49% of GETs as intron-retained isoforms, whereas they only represented 27% in the “All-expressed” group (Supplemental Fig. S3K,L). Among the 909 GET genes in humans and 861 GET genes in mice, we observed 113 genes in common. This suggests that intron retention and sedimentation patterns are conserved properties likely related to the formation of stable RNPs by specific RNA isoforms.
Intron retention events in GETs. (A) Relative amount of transcript isoform classes based on GENCODE/Ensembl annotation in All-expressed transcripts and in GETs. (B) Schematic representation of intron retention event and its quantification using IRFinder to calculate the IRratio. (C) Representative retained-intron events of GETs compared to the nonretained-intron isoform. IRratios values are indicated for retained intron (RI) and neighbor intron (NI) (not-retained). (D) Distribution of IRratio values for neighbor introns and retained introns. Dashed line represents IRratio = 0.1. (E) Genome browser tracks of RNA-seq data at CENPT locus for the various gradient fractions. Dashed line indicates intron retention and accumulation of reads peaking in F3–F4. (F) RNA abundance throughout the gradient for CENPT isoforms. CENPT-233 is a retained-intron isoform and GET, whereas CENPT-235 is a fully spliced mRNA and not a GET.
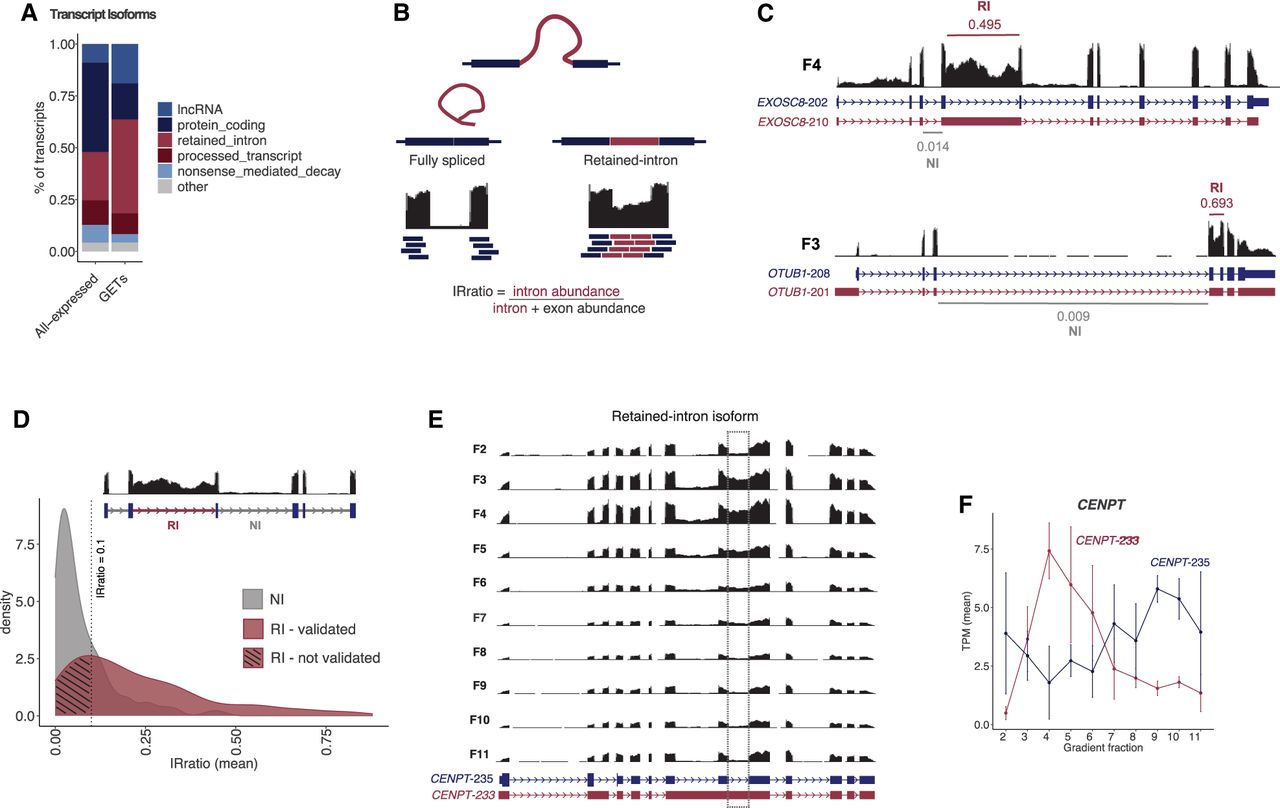
So far, our results reveal that GETs are mostly intron-retained transcripts and enriched in the nucleus. Next, we wanted to determine which intron(s) are retained in an annotation-unbiased manner. To this end, we used the software IRFinder (Middleton et al. 2017), which was developed specifically for identifying specific retained-intron events. This is computed as the proportion of reads aligning to introns relative to neighboring exons (Fig. 3B). An IRratio of 1 means that 100% of the transcripts contain that intron.
We performed the IRFinder analysis in all cell extract gradient data sets to confirm that the identified GET retained-intron (GET-RI) isoforms were true retained-intron events. Initially, from the IRFinder output results, we selected those GET-RIs that had a corresponding IRratio value for the neighbor introns (NI; non-retained intron) of the same gene (275 out of 482 transcripts). The IRratio of a retained intron (RI) was compared to the IRratio average of the neighbor introns (non-retained intron) in the same transcript to validate the enrichment of such a retained intron and to exclude the possibility of poor splicing or background sequencing. For example, EXOSC8-210 is a retained-intron GET that peaks in gradient fraction F4. Its retained intron showed an IRratio of 0.495, whereas a neighboring intron showed an IRratio of 0.014—a 35-fold enrichment of that intron being retained (Fig. 3C). Similarly, IRFinder identified the retained intron of OTUB1-201 with an IRratio = 0.693, whereas its neighbor intron had an IRratio = 0.009 (77-fold enrichment). Next, to establish a cutoff value of IRratio enrichments, we compared the distribution of IRratios between the RIs and neighbor introns of all GETs (Fig. 3D). The majority of all detected neighboring introns showed an IRratio <0.0819 (z score > 0.05), which corroborates the literature that considers retained-intron events higher than 10% (IRratio > 0.1) as true retention (Middleton et al. 2017).
Based on our analyses, we chose the IRFinder parameters of RI IRratio ≥ 0.1 and neighbor intron <0.1 to best represent valid retained intron events. Based on this criterion, 28% (135 out of 482 GET-RIs) of the GETs have a specific intron retention event (called validated GET-RI). For example, CENPT-233 is a validated GET-RI, where its retained intron leads to its accumulation in the gradient fraction F4 (Fig. 3E,F). Thus far, we have observed that the most prominent property of GETs is a specific intron retention event that, in turn, retains the transcript isoform in the nucleus. Because of the several limitations in GENCODE annotation, such as incomplete coverage of retained intron events, we provide all unannotated introns that were called by IRFinder and manually curated from our deep RNA-seq resource of hIPSCs (Supplemental Table S3).
GET-RI transcripts are resistant to RNA decay
After identifying a high-confidence list of GET-RI isoforms, we investigated if they would have other distinct features that could make them GETs. We first tested how RNA stability could be influenced by the retention of an intron. We used publicly available RNA-seq data (Melé et al. 2017) of human pluripotent cells (HUES9) treated with actinomycin D for 0.5 h, 2 h, 4 h, and 8 h. Actinomycin D blocks transcription and allows the evaluation of RNA stability through time: short lived transcripts will rapidly decay, whereas more stable transcripts will accumulate throughout the time. Importantly, once more we took advantage of the IRFinder analysis. The calculation of the IRratio is extremely valuable to evaluate the persistence of retained-intron isoforms compared to their non-RI isoform counterparts. In the case of a similar decay of RI and non-RI isoform pairs, the IRratio will stay the same. However, if the RI isoform is more stable, its IRratio will increase through time, because the intron's abundance relative to the neighboring exons will increase (Fig. 4A).
GETs are resistant to RNA decay. (A) Schematic representation of how actinomycin D can affect IRratio values. Higher IRratio values might indicate resistance to RNA decay. (B) Time course of actinomycin D treatment effect in retained intron (All-expressed-RI) and nonretained-intron isoforms. Values represent log2FC in comparison to 0 h of actinomycin D treatment. Statistics using Kolmogorov-Smirnov (KS-test). (C) Analysis of properties that could influence intron retention. GET-RI and validated GET-RI groups were compared to All-expressed-RI. (D) Genome browser tracks of actinomycin D-treated cells at CENPT loci. (E) Heat map of RNA decay-resistant GETs showing log2FC values of IRratio during actinomycin D treatment. Columns are actinomycin D treatment time points; rows are specific retained introns for the indicated gene. Repeated genes indicate more than one intron per gene, indicated by 1 or 2.
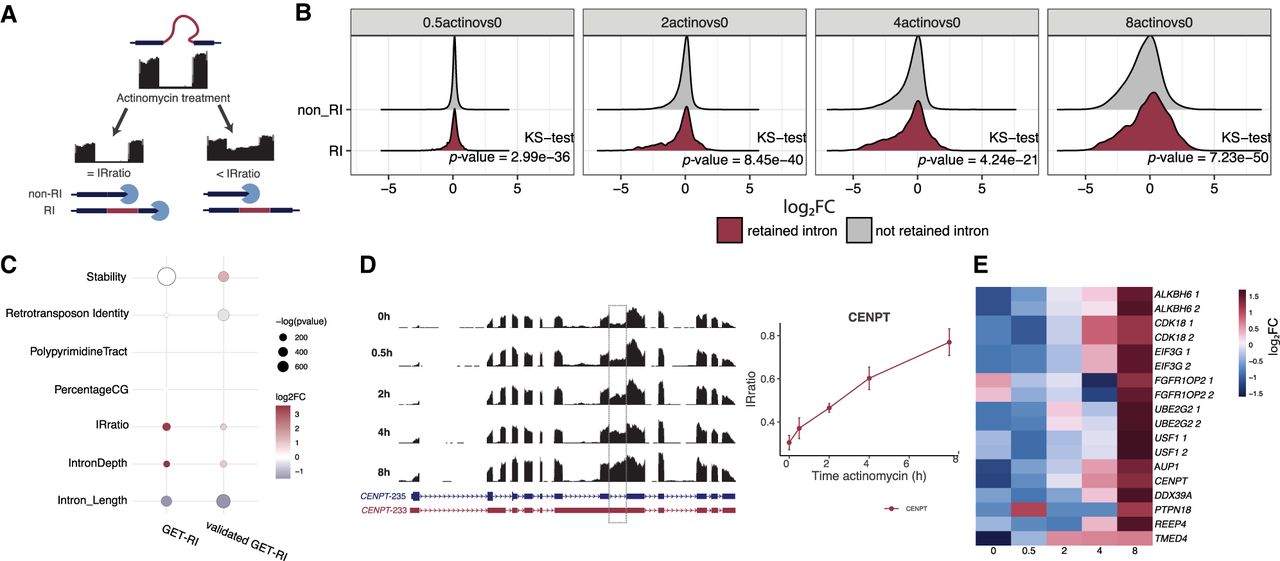
We observed that there was a tendency for All-expressed-RI transcripts to persist longer after actinomycin D treatment relative to non-RI transcripts, illustrated by the increased log2FC of IRratios through time (Fig. 4B). Specifically, when we compared GET-RIs (482 transcripts) and the validated GET-RIs (135 transcripts) to all other retained intron isoforms expressed in the cell (All-expressed-RI), we observed that both GET-RIs and validated GET-RIs were more resistant to decay than other retained-intron transcripts (Fig. 4C). Additionally, validated GET-RIs were more resistant to decay than the non-RI and non-GET isoforms. For example, the validated GET-RI CENPT-233 showed an increased IRratio after actinomycin D treatment, suggesting higher stability than the non-GET CENPT-235 isoform (Fig. 4D,E).
We also compared GET-RIs and the validated GET-RIs to All-expressed-RIs to test many other properties that are known to directly influence intron retention such as: polypyrimidine tract, presence of mobile elements (transposons), intron percentage CG, intron length, and other nucleotide motifs associated with alternative splicing (Fig. 4C). Most of these properties were not specific to GET-RIs nor to validated GET-RIs when compared to All-expressed-RIs (all statistics in Supplemental Table S1). Thus, the only distinct features of GET-RIs are: being highly resistant to decay (GET-RI t-test P-value = 1.23 × 10−319; log2FoldChange: 0.53; validated GET-RI t-test P-value = 4.87 × 10−62; log2FoldChange: 1.36), and having a slightly shorter intron when compared to All-expressed-RIs (GET-RI t-test P-value = 1.88 × 10−66; log2FoldChange: −1.52; validated GET-RI t-test P-value = 1.51 × 10−143; log2FoldChange: −1.06).
Next, we used public ENCODE eCLIP (enhanced crosslinking immunoprecipitation) data sets (The ENCODE Project Consortium 2012) to investigate if each retained intron would have an enrichment in protein binding at retained introns compared to the non-retained introns in the same gene (Supplemental Fig. S4). In total, we found 8617 events exclusive to GET introns, 9940 events shared between GET introns and other introns of the same gene, and 10,527 events exclusive to other introns of the same gene. We tested if GETs had a higher chance of binding events compared to non-GETs, which showed GETs are enriched for RBP binding events (hypergeometric P-value: 8.4 × 10−101). To test if specific RBPs were enriched in GETs, we used a machine learning approach with random forest classification. The model was designed to identify which RBPs were the most important to distinguish GET introns from all the other introns within the same genes. The model identified several candidates (Supplemental Fig. S5A), but no strong enrichment emerged, with both variable importance metrics not reaching strong prediction values. Gene Ontology enrichment was performed in genes containing GETs both in human and mouse data, and results show strong concordance among the species. The top 15 terms included ribosome and RNA processing-associated terms (Supplemental Fig. S5B).
Two independent recent studies using two different proximity-ligation approaches have observed that nuclear speckles are enriched for stable RNA transcripts with specific retained introns (Barutcu et al. 2022; Wu et al. 2024). Because these features are similar to those we observe for GETs, we tested if the GET and the GET-RI genes were enriched in their data sets (despite being of different cell origin). The GET genes do not show significant enrichment in proximity label of speckle markers (SRSF7, SRSF1, and RNPS1) in HEK293 cells (binomial test P-value: 0.15), although GET-RI genes do (binomial test P-value: 1.69 × 10⁻¹⁹). In the other approach for detection of proximity-ligation, in situ reverse transcription, both GET genes (HeLa binomial test P-value: 7.83 × 10−52, HEPG2 binomial test P-value: 3.76 × 10⁻¹⁵) and GET-RI genes are enriched (HeLa binomial test P-value: 9.60 × 10−58, HEPG2 binomial test P-value: 2.94 × 10−52), with over 40% of all GET-RIs present in nuclear speckle proximity. These findings suggest that GET genes, even across different cell types and experimental approaches, consistently demonstrate a significant association with nuclear speckles, highlighting their link to speckle-proximal transcription regulation (Bhat et al. 2024).
Discussion
In this study, we identify numerous cases of specific introns being retained in the nucleus within stable RNPs. This was discovered by mapping the sedimentation rate profiles of individual transcripts in human and mice pluripotent cells. As such, our approach has produced, to our knowledge, the deepest sequencing of the pluripotent transcriptome, represented by >3.6 billion RNA sequencing reads in each cell line. In fact, we were able to detect 76,000 transcripts (>1 TPM) expressed in human iPSCs and over 41,000 in mouse. Thus, we have been able to identify the sedimentation profiles of the vast majority of isoforms expressed in these PSCs.
Despite measuring 76,000 transcripts, we only observed 1057 (1.4%) forming discrete RNPs (GETs) under native conditions. This could be due to the stringent statistical parameters used to identify GETs. The most stringent filtering step was the abundance throughout the gradient to fit a Gaussian distribution. Moreover, because our approach was under native conditions, any RNP detected would have to remain stable through cell extraction and sedimentation through a sucrose gradient—conditions that could cause some complexes to dissociate.
The other 98.6% of RNAs, which are presumably in complexes with proteins but do not form discrete complexes, might exist in RNPs with variable protein composition (therefore differing in mass) and/or they might assume a variety of conformations (therefore differing in rate-zonal sedimentation properties), which would cause them to spread out in the gradient. Therefore, we hypothesize that we may have only observed the most stable cellular RNPs, which is a limitation of this approach. Consistent with this hypothesis, we observed intact ribosomes, ranging from monosomes to polysomes—which are known to be highly stable. Overall, this study identified >1000 RNPs highly stable under native cellular extraction and sedimentation.
We further defined the properties of these highly stable RNPs/GETs (resilient to extraction and sedimentation): (1) The sedimentation coefficients of GETs do not scale with the length of the transcript; (2) GETs do not represent particularly abundant transcripts—in fact, most GETs are lower abundant isoforms relative to MANE isoforms; (3) GETs are typically nuclear; (4) GETs are predominantly comprised of isoforms with a single and specific intron retained; and (5) GET-RI RNAs are highly stable or long-lived isoforms of a gene.
There are many possible explanations why the S values of GETs do not scale with transcript length. First, the mass of an RNP depends not just on the RNA but on the protein components, and it's possible that shorter RNAs have a higher protein/RNA ratio. Second, the S value is inversely proportional to the frictional factor F, and longer RNAs may form RNPs with higher F values, thereby decreasing their sedimentation. The majority of the GETs were in sucrose gradient fractions 3 and 4 (645 GETs in human and 611 in mouse), corresponding to an S value from 40 to 60S. This S value is similar to that of the 40S ribosomal subunit, which contains a 1900-nt RNA and 33 proteins. However, the GETs in these fractions vary from 200 to 8000 nt (mean 1517 nt, median 1057 nt) in human and from 100 to 6900 nt (mean 1341 nt, median 882 nt) in mouse, so they may have a lower protein/RNA ratio to achieve the same overall mass. F could differ, too, depending on biophysical and structural properties of proteins bound.
What is striking is how specific and reproducible the intron is for retention in GETs. Our more stringent IRFinder statistical analysis observed that GETs retain very specific introns in the transcript (Fig. 3). This suggests that intron retention is a highly specified or regulated event and not just due to inefficient splicing—as IRFinder would have detected more RI-events across the introns of a given transcript. Thus, most introns are efficiently spliced, and, in turn, this one RNA isoform that retains specific introns remains in a stable-nuclear RNP resistant to degradation. In sharp contrast, the MANE isoform of the same gene, lacking this specific intron retention event, is localized in the cytoplasm, does not form an RNP, and is typically less stable.
This raises a fundamental question of what is the role of intron-retained isoforms remaining in stable nuclear-complexes? One possibility is that GETs represent nuclear “storage” of a pre-mRNA in preparation for a specific cellular signal or condition. In this case, these RNAs are “poised” to be fully spliced and subsequently translated to protein. This would be consistent with what has already been observed for some specific intron-retained nuclear transcripts. For example, the KCNMA1 gene has an RI isoform that responds to calcium. When the cell senses the calcium, the i17a intron is spliced out, allowing mRNA export to the cytoplasm and translation into the full-length calcium-activated big potassium channel (Bell et al. 2010). S-adenosylmethionine (SAM) depletion by methionine starvation also enhances the splicing of a 3′-UTR region in the MAT2A pre-mRNA. This results in full-length MAT2A isoforms being transcribed and then translated, increasing SAM production (Pendleton et al. 2017). The telomerase reverse transcriptase gene (TERT) is transcribed into a main isoform that retains intron 11. During mitosis, this intron is signaled to be spliced out, and the mature transcript is translated in the cytoplasm (Dumbović et al. 2021).
The common theme to these few known cases is that specific intron(s) are retained for a considerable time and then, upon some signal, they are spliced, resulting in the mRNA being exported and translated. Now, our study has identified hundreds more GETs with specific retained introns in the nucleus—perhaps indicating this phenomenon of intron retention and “storage” is more widespread. This could also explain why GET-RIs are more resistant to degradation to ensure proper “storage.”
Another possibility is that GETs represent nuclear speckles. Two recent studies (Barutcu et al. 2022; Wu et al. 2024), using different proximity labeling approaches of nuclear speckles, observed specific retained introns being localized within nuclear speckles. Indeed, a significant fraction (over 30%) of our GETs overlap with transcripts identified to reside in nuclear speckles by prior studies—despite using different cell types. This would imply that nuclear speckles consist of a diversity of transcripts with specific retained introns, each forming a discrete RNP particle. Finally, these ideas are not mutually exclusive, because storing mRNA isoforms in nuclear speckles could “poise” them for subsequent splicing in response to cellular conditions. Collectively, GETs, particularly in speckle-associated compartments, suggest a potential role as regulatory reserves. This could allow the cell to dynamically access and utilize these transcripts as needed, providing a versatile regulatory layer in gene expression control.
It remains tantalizing to speculate that GETs could also represent nuclear noncoding RNPs. Because the intron retention interrupts the open reading frame, these isoforms are, in some respects, noncoding RNAs (ncRNAs) (Mattick 2023). Thus, these nc-isoforms of otherwise protein-coding mRNAs could be “moonlighting” as functional nuclear ncRNAs to scaffold larger RNPs. This would indicate an underlying specific intron retention code that converts cytoplasmic mRNAs into nuclear ncRNAs of unknown function.
In summary, our study has identified a widespread phenomenon of 1057 GETs that form stable, discrete RNPs and have conserved defining features of being nuclear, retaining specific introns, and being resistant to degradation. Future studies of the GET RNPs will be needed to dissect their biogenesis and their functional roles in cellular processes.
Methods
Cell culture
Human episomal iPSCs (Gibco, A18945) were cultured on Geltrex-coated (Gibco, A1413302) dishes using mTeSR Plus (Stem Cell Technologies, 100-0276). The medium was replaced following the manufacturer's instructions until cells were 70%–80% confluent.
mESCs were maintained on 0.1% gelatin in KnockOut DMEM (Thermo Fisher Scientific, 10829018) supplemented with 12.5% FCS (MilliporeSigma, ES-009-B), 1× GlutaMAX supplement (Thermo Fisher Scientific, 35050061), 1× nonessential amino acids (Thermo Fisher Scientific, 11140050), 100 U/mL penicillin/streptomycin (Thermo Fisher Scientific, 15140122), 100 µM 2-mercaptoethanol (Thermo Fisher Scientific, 31350010), 1 µM PD0325901 (MilliporeSigma, PZ0162-5MG), 3 µM CHIR99021 (MilliporeSigma, SML1046-5MG), and 100 U/mL LIF (MilliporeSigma, ESG1107). Cells were maintained at 37°C and 5% CO2.
Sucrose gradient fractionation
Sucrose gradients were prepared using 30% and 60% sucrose solutions in gradient buffer (20 mM Tris HCl [pH 8], 20 mM Tris HCl [pH 7], 3 mM MgCl2, 150 mM KCl) and Gradient Master program SHORT SUCR 30%–60% ww 2St (BioComp, model 108) in 14 × 89 mm polypropylene tubes. Ten to fifteen million cells were harvested and resuspended in 400 µL of cell lysis buffer (1× gradient buffer, 1% NP-40, 4 U/µL RNaseOut, 1 mM NaF, 0.5 mM DTT, and 1× Protease Inhibitor Cocktail), incubated for 30 min on ice and lysed using a needle (10 cycles). To separate cell debris, the suspensions were centrifuged at 12,000g for 10 min at 4°C. For total RNA gradients, total RNA was purified from 10–15 million cells using the Directzol RNA Miniprep kit (ZymoResearch, R2062) in parallel to the cell extract preparation. —Seventy to one hundred micrograms of total RNA were loaded on top of the gradients. Gradient ultracentrifugation was performed at 30,000 rpm (SW41 rotor) for 18 h at 4°C. Sucrose gradients were fractionated using an ISCO gradient fractionation system (ISCO Model 160 Gradient Former Foxy Jr. Fraction Collector) into 12 fractions of 900 µL. RNA was purified from sucrose fractions using Directzol RNA Miniprep kit, following the manufacturer's instructions.
Nuclei isolation
Nuclei were purified by washing cells twice with cold PBS and incubating them in ice-cold swelling buffer (10 mM Tris-HCl [pH 7.5], 2 mM MgCl2, 3 mM CaCl2) on ice for 15 min. Cells were collected in 5 mL swelling buffer using a cell scraper and centrifuged at 1000g for 10 min at 4°C. Cell pellets were resuspended in 1 mL of lysis buffer (10 mM Tris HCl [pH 7.5], 2 mM MgCl2, 3 mM CaCl2, 0.5% IGEPAL, 10% glycerol, RNase Inhibitor) using a wide-orifice pipette tip. An additional 9 mL of lysis buffer was added, and the mixture was centrifuged at 600g for 5 min at 4°C. This resuspension step was repeated once. The nuclei pellets were then resuspended in 1 mL of freezing buffer (50 mM Tris HCl [pH 8.3], 5 mM MgCl2, 40% glycerol, 0.1 mM EDTA [pH 8.0]) and transferred to low-bind microcentrifuge tubes. After centrifugation at 600g at 4°C for 5 min, nuclei pellets were resuspended in 500 µL of freezing buffer and centrifuged at 600g for 5 min at 4°C. Nuclei pellets were finally resuspended in 110 µL of freezing buffer for counting and visual confirmation. TRIzol was added to nuclei suspension for RNA purification using the Directzol RNA Miniprep kit (ZymoResearch, R2062), in parallel to RNA purification of total RNA from the same batch of cells for whole cell (total RNA) preparation.
RNA-seq
RNA-seq libraries were prepared using rRNA removal and sequenced paired-end (PE150) on the NovaSeq platform. All raw data and codes used for the analysis are available (see Data access).
Gradient-enriched transcript analysis
Quality control, read mapping, and quantification were performed using nf-core/rnaseq v3.8. Reads were aligned to GRCh38 (human) and mapped with Salmon (Patro et al. 2017) v1.5.2 using the GENCODE v38 (human) and vm25 (mouse) annotation. For comparison, all libraries were also mapped using Salmon (version 1.10.2) separately with softclip, position bias, sequence, bias GC bias, Gibbs sampling bootstrap of 100, and equivalence classes calling arguments. The equivalence classes were then used to run Terminus (Sarkar et al. 2020) group and collapse phases using min-spread of 0.1 and tolerance of 0.001. Terminus is used to group transcripts that are too similar to be distinguished with Salmon quantification algorithms. Transcripts outputted from this Terminus grouping were then excluded from downstream analyses. Libraries were also aligned using STAR (version 2.7.10b) (Dobin et al. 2013) in default mode to generate unsorted BAM files for intron retention calling in IRFinder. Alignment was done using GRCh38.p13 human genome and GENCODE version 38 with scaffolds annotation file. Differential expression was performed with edgeR (Robinson et al. 2010). To get the final GET list, we established stringent cutoffs after testing different iterations (Supplemental Table S2).
Public actinomycin D–treated libraries
Actinomycin D-treated human embryonic stem cells (HUES9) in multiple time courses were acquired from the NCBI BioProject database (https://www.ncbi.nlm.nih.gov/bioproject/) under accession number PRJNA318241 (Melé et al. 2017) and re-aligned, mapped, and quantified following subsequent methods.
Isoform specific visualization by transcript type
Visualization was performed using Isoformic (version 0.2.1) (https://github.com/luciorq/isoformic) together with ggplot and transcript types called from GENCODE. All processed data for genes and transcripts are available (see Data access).
Intron retention confirmation
IRFinder (version 2.0.1) (Middleton et al. 2017) was used for unbiased intron retention calling from the libraries aligned BAM files. It compares read alignment from an intron to the exons around it and with the subsequent introns in the same genomic region. The program was run building a reference using GENCODE version 38 with scaffolds and the previously used STAR index. Intron retention was called using the unsorted BAM as input. In its normal use, IRFinder only considers transcripts annotated as protein_coding and processed_transcript. Because our goal was confirming intron retention and also predicting nonannotated retention into transcripts of any type, we edited the input annotation file so that transcripts that did not belong to those two types (mostly lncRNA and retained introns) would be called as processed_transcript, and IRFinder would try to predict intron retentions on them.
Intron character calling
Polypyrimidine tract was assessed by selecting the last 30 characters on each intron and counting the number of pyrimidine bases on that sequence. Major spliceosome splicing was checked by matching the CG AG consensus to the start and end nucleotides of each intron. Possible retrotransposon sequences were found performing a BLASTN using a database of all human repeats from the UCSC Repeat Browser against all the introns detected by IRFinder. Repeats with the highest percent identity against that intron were selected, and introns which yielded no BLASTN results were given a score of zero for comparison. CG content was assessed counting all the C and G bases present in our introns in comparison to the intron length.
eClip analysis
Methods are similar to those used in Dumbović et al. (2021). In summary, processed eCLIP data sets from K562 and HepG2 cells were downloaded from ENCODE (The ENCODE Project Consortium 2012) and matched against the ranges with the GET introns. The random forest model treated RBP binding (present/absent) as the binary outcome variable, with intron length, strand, and the gene name as covariates. MeandecreaseAccuracy and MeandecreaseGini were then computed to try to distinguish which RBPs most strongly contributed to the classification.
Data access
All raw and processed sequencing data generated in this study have been submitted to the NCBI Gene Expression Omnibus (GEO; https://www.ncbi.nlm.nih.gov/geo/) under accession number GSE284687. The RNA-seq data generated in this study have been submitted to the NCBI BioProject database (https://www.ncbi.nlm.nih.gov/bioproject/) under accession number PRJNA1197257. All codes used for the analysis are available at GitHub (https://github.com/iza-mcac/Gradseq) and as Supplemental Code.
Competing interest statement
J.L.R. is a cofounder of Lincswitch Therapeutics (with no competing interest for this study). All other authors declare no competing interests.
Acknowledgments
We thank Michael J. Smallegan for his initial guidance in analyzing the gradient enrichment data. We also thank Roy Parker and his lab for access to the gradient fractionator. We acknowledge the support of Theresa Nahreini and Emily Proksch at the Biochemistry Cell Culture Facility, and Annette Erbse for access to and training of the shared instruments at the Department of Biochemistry, CU Boulder. Part of the computational analyses were performed on the Gloriosos clusters, at Laboratory of Genetics Biochemistry Universidade Federal de Minas Gerais. I.M. is supported by a fellowship from Conselho Nacional de Pesquisa (CnPQ), Brazil.
Author contributions: J.L.R. designed the study. I.T.P. and I.M. performed bioinformatic analyses. I.T.P. performed sample handling and RNA-seq. G.R.F. and J.L.R. provided access to resources. I.T.P. and I.M. wrote the original draft. P.P.A., G.R.F., and J.L.R. supervised the study. All authors reviewed and approved the manuscript.
Notes
[1] Supplementary material [Supplemental material is available for this article.]
[2] Article published online before print. Article, supplemental material, and publication date are at https://www.genome.org/cgi/doi/10.1101/gr.280431.125.
References
- ↵Adekunle DA, Wang ET. 2020. Transcriptome-wide organization of subcellular microenvironments revealed by ATLAS-seq. Nucleic Acids Res 48: 5859–5872. 10.1093/nar/gkaa334
- ↵Barutcu AR, Wu M, Braunschweig U, Dyakov BJA, Luo Z, Turner KM, Durbic T, Lin ZY, Weatheritt RJ, Maass PG, 2022. Systematic mapping of nuclear domain-associated transcripts reveals speckles and lamina as hubs of functionally distinct retained introns. Mol Cell 82: 1035–1052.e9. 10.1016/j.molcel.2021.12.010
- ↵Bell TJ, Miyashiro KY, Sul JY, Buckley PT, Lee MT, McCullough R, Jochems J, Kim J, Cantor CR, Parsons TD, 2010. Intron retention facilitates splice variant diversity in calcium-activated big potassium channel populations. Proc Natl Acad Sci 107: 21152–21157. 10.1073/pnas.1015264107
- ↵Bhat P, Chow A, Emert B, Ettlin O, Quinodoz SA, Strehle M, Takei Y, Burr A, Goronzy IN, Chen AW, 2024. Genome organization around nuclear speckles drives mRNA splicing efficiency. Nature 629: 1165–1173. 10.1038/s41586-024-07429-6
- ↵Blackburn EH, Collins K. 2011. Telomerase: an RNP enzyme synthesizes DNA. Cold Spring Harb Perspect Biol 3: a003558. 10.1101/cshperspect.a003558
- ↵Decker CJ, Burke JM, Mulvaney PK, Parker R. 2022. RNA is required for the integrity of multiple nuclear and cytoplasmic membrane-less RNP granules. EMBO J 41: e110137. 10.15252/embj.2021110137
- ↵Dobin A, Davis CA, Schlesinger F, Drenkow J, Zaleski C, Jha S, Batut P, Chaisson M, Gingeras TR. 2013. STAR: ultrafast universal RNA-seq aligner. Bioinformatics 29: 15–21. 10.1093/bioinformatics/bts635
- ↵Dumbović G, Braunschweig U, Langner HK, Smallegan M, Biayna J, Hass EP, Jastrzebska K, Blencowe B, Cech TR, Caruthers MH, 2021. Nuclear compartmentalization of TERT mRNA and TUG1 lncRNA is driven by intron retention. Nat Commun 12: 3308. 10.1038/s41467-021-23221-w
- ↵The ENCODE Project Consortium. 2012. An integrated encyclopedia of DNA elements in the human genome. Nature 489: 57–74. 10.1038/nature11247
- ↵Hör J, Di Giorgio S, Gerovac M, Venturini E, Förstner KU, Vogel J. 2020. Grad-seq shines light on unrecognized RNA and protein complexes in the model bacterium Escherichia coli. Nucleic Acids Res 48: 9301–9319. 10.1093/nar/gkaa676
- ↵Kornblihtt AR, Schor IE, Alló M, Dujardin G, Petrillo E, Muñoz MJ. 2013. Alternative splicing: a pivotal step between eukaryotic transcription and translation. Nat Rev Mol Cell Biol 14: 153–165. 10.1038/nrm3525
- ↵Mattick JS. 2023. A Kuhnian revolution in molecular biology: most genes in complex organisms express regulatory RNAs. Bioessays 45: e2300080. 10.1002/bies.202300080
- ↵Melé M, Mattioli K, Mallard W, Shechner DM, Gerhardinger C, Rinn JL. 2017. Chromatin environment, transcriptional regulation, and splicing distinguish lincRNAs and mRNAs. Genome Res 27: 27–37. 10.1101/gr.214205.116
- ↵Middleton R, Gao D, Thomas A, Singh B, Au A, Wong JJL, Bomane A, Cosson B, Eyras E, Rasko JEJ, 2017. IRFinder: assessing the impact of intron retention on mammalian gene expression. Genome Biol 18: 51. 10.1186/s13059-017-1184-4
- ↵Mudge JM, Carbonell-Sala S, Diekhans M, Martinez JG, Hunt T, Jungreis I, Loveland JE, Arnan C, Barnes I, Bennett R, 2025. GENCODE 2025: reference gene annotation for human and mouse. Nucleic Acids Res 53: D966–D975. 10.1093/nar/gkae1078
- ↵Patro R, Duggal G, Love MI, Irizarry RA, Kingsford C. 2017. Salmon provides fast and bias-aware quantification of transcript expression. Nat Methods 14: 417–419. 10.1038/nmeth.4197
- ↵Pendleton KE, Chen B, Liu K, Hunter OV, Xie Y, Tu BP, Conrad NK. 2017. The U6 snRNA m6A methyltransferase METTL16 regulates SAM synthetase intron retention. Cell 169: 824–835.e14. 10.1016/j.cell.2017.05.003
- ↵Robinson MD, McCarthy DJ, Smyth GK. 2010. edgeR: a Bioconductor package for differential expression analysis of digital gene expression data. Bioinformatics 26: 139–140. 10.1093/bioinformatics/btp616
- ↵Sarkar H, Srivastava A, Bravo HC, Love MI, Patro R. 2020. Terminus enables the discovery of data-driven, robust transcript groups from RNA-seq data. Bioinformatics 36: I102–I110. 10.1093/bioinformatics/btaa448
- ↵Schneider C, Erhard F, Binotti B, Buchberger A, Vogel J, Fischer U. 2022. An unusual mode of baseline translation adjusts cellular protein synthesis capacity to metabolic needs. Cell Rep 41: 111467. 10.1016/j.celrep.2022.111467
- ↵Shine M, Gordon J, Schärfen L, Zigackova D, Herzel L, Neugebauer KM. 2024. Co-transcriptional gene regulation in eukaryotes and prokaryotes. Nat Rev Mol Cell Biol 25: 534–554. 10.1038/s41580-024-00706-2
- ↵Wahl MC, Will CL, Lührmann R. 2009. The spliceosome: design principles of a dynamic RNP machine. Cell 136: 701–718. 10.1016/j.cell.2009.02.009
- ↵Wu J, Xiao Y, Liu Y, Wen L, Jin C, Liu S, Paul S, He C, Regev O, Fei J. 2024. Dynamics of RNA localization to nuclear speckles are connected to splicing efficiency. Sci Adv 10: eadp7727. 10.1126/sciadv.adp7727