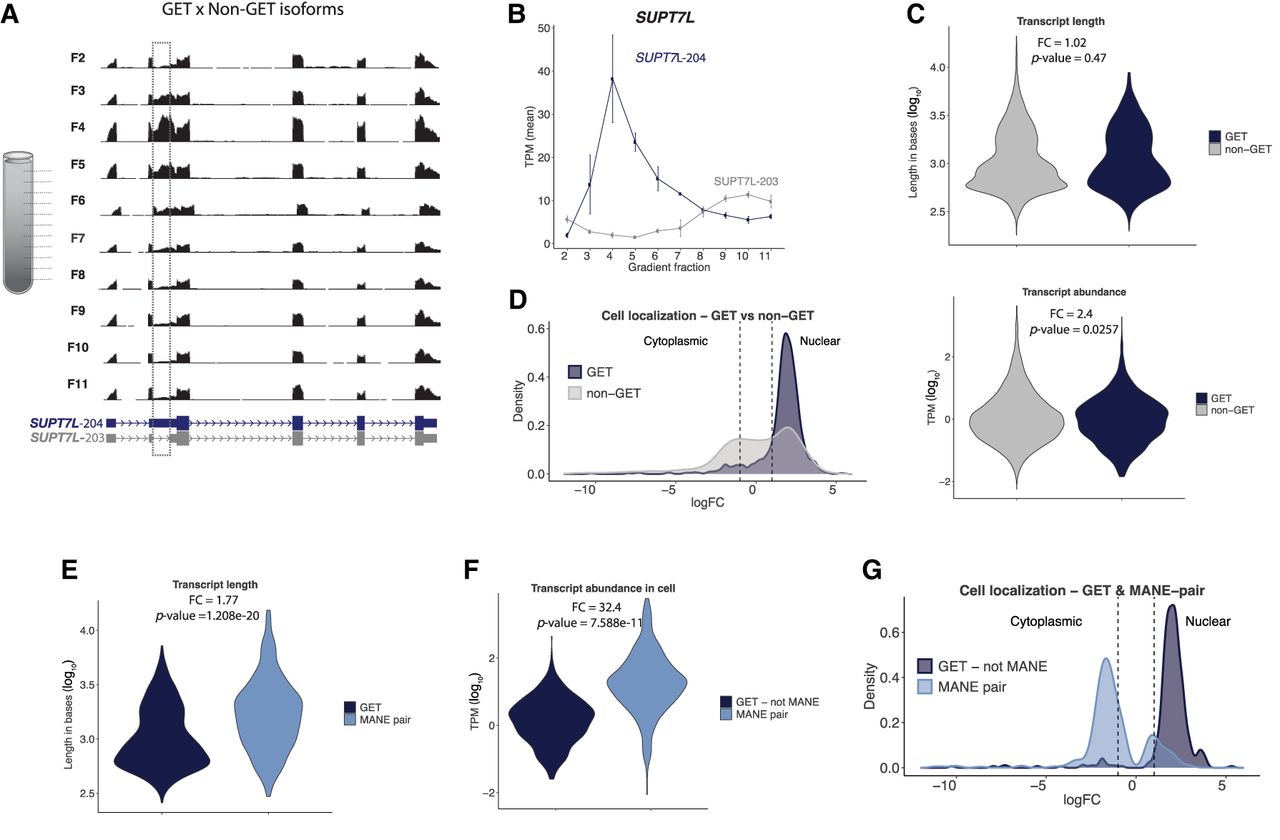
GET isoforms and their properties. (A) Genome browser tracks of gradient fractions RNA-seq data at SUPT7L locus. Dashed line indicates exon inclusion and accumulation of reads peaking in F4. (B) RNA abundance throughout the gradient for SUPT7L isoforms. (C) Distribution of GET length in bases and abundance in TPM (log10) compared to non-GET isoforms from the same genes. P-value: two-sided t-test. (D) Distribution of cell localization of GETs and non-GET from the same gene based on nuclear/total RNA abundance (logFC). Fisher's exact test: P-value < 2.2 × 10⁻¹⁶. The RNAs falling between the two dashed lines occur in both nucleus and cytoplasm. (E) Distribution of GET length in bases and (F) abundance in TPM (log10) compared to MANE isoform from the same gene. P-value: two-sided t-test. (G) Distribution of cell localization of GETs and MANE isoform from the same gene based on nuclear/total RNA abundance (logFC). Fisher's exact test: P-value < 2.2 × 10⁻¹⁶.