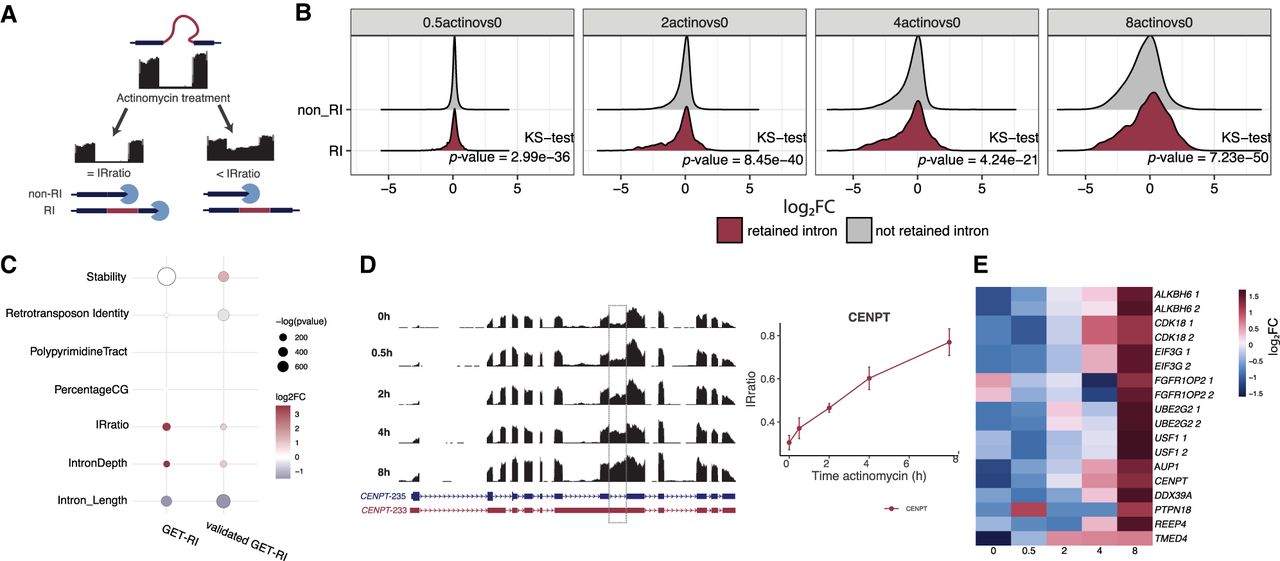
GETs are resistant to RNA decay. (A) Schematic representation of how actinomycin D can affect IRratio values. Higher IRratio values might indicate resistance to RNA decay. (B) Time course of actinomycin D treatment effect in retained intron (All-expressed-RI) and nonretained-intron isoforms. Values represent log2FC in comparison to 0 h of actinomycin D treatment. Statistics using Kolmogorov-Smirnov (KS-test). (C) Analysis of properties that could influence intron retention. GET-RI and validated GET-RI groups were compared to All-expressed-RI. (D) Genome browser tracks of actinomycin D-treated cells at CENPT loci. (E) Heat map of RNA decay-resistant GETs showing log2FC values of IRratio during actinomycin D treatment. Columns are actinomycin D treatment time points; rows are specific retained introns for the indicated gene. Repeated genes indicate more than one intron per gene, indicated by 1 or 2.