
Characterization of transcript enrichment and detection bias in single-nucleus RNA-seq for mapping of distinct human adipocyte lineages
- Anushka Gupta1,
- Farnaz Shamsi2,
- Nicolas Altemose1,
- Gabriel F. Dorlhiac3,
- Aaron M. Cypess4,
- Andrew P. White5,
- Nir Yosef6,7,8,9,
- Mary Elizabeth Patti10,
- Yu-Hua Tseng2,11 and
- Aaron Streets1,3,8
- 1University of California at Berkeley–University of California at San Francisco Graduate Program in Bioengineering, Berkeley, California 94720, USA;
- 2Section on Integrative Physiology and Metabolism, Joslin Diabetes Center, Harvard Medical School, Boston, Massachusetts 02115, USA;
- 3Biophysics Graduate Group, University of California at Berkeley, Berkeley, California 94720, USA;
- 4Diabetes, Endocrinology, and Obesity Branch, National Institute of Diabetes and Digestive and Kidney Diseases (NIDDK), National Institutes of Health, Bethesda, Maryland 20892, USA;
- 5Department of Orthopedic Surgery, Beth Israel Deaconess Medical Center, Harvard Medical School, Boston, Massachusetts 02115, USA;
- 6Center for Computational Biology, University of California, Berkeley, Berkeley, California 94720, USA;
- 7Department of Electrical Engineering and Computer Sciences, University of California at Berkeley, Berkeley, California 94720, USA;
- 8Chan Zuckerberg Biohub, San Francisco, California 94158, USA;
- 9Ragon Institute of Massachusetts General Hospital, Massachusetts Institute of Technology, and Harvard University, Cambridge, Massachusetts 02139, USA;
- 10Research Division, Joslin Diabetes Center, Boston, Massachusetts 02115, USA;
- 11Harvard Stem Cell Institute, Harvard University, Cambridge, Massachusetts 02138, USA
Abstract
Single-cell RNA sequencing (scRNA-seq) enables molecular characterization of complex biological tissues at high resolution. The requirement of single-cell extraction, however, makes it challenging for profiling tissues such as adipose tissue, for which collection of intact single adipocytes is complicated by their fragile nature. For such tissues, single-nucleus extraction is often much more efficient and therefore single-nucleus RNA sequencing (snRNA-seq) presents an alternative to scRNA-seq. However, nuclear transcripts represent only a fraction of the transcriptome in a single cell, with snRNA-seq marked with inherent transcript enrichment and detection biases. Therefore, snRNA-seq may be inadequate for mapping important transcriptional signatures in adipose tissue. In this study, we compare the transcriptomic landscape of single nuclei isolated from preadipocytes and mature adipocytes across human white and brown adipocyte lineages, with whole-cell transcriptome. We show that snRNA-seq is capable of identifying the broad cell types present in scRNA-seq at all states of adipogenesis. However, we also explore how and why the nuclear transcriptome is biased and limited, as well as how it can be advantageous. We robustly characterize the enrichment of nuclear-localized transcripts and adipogenic regulatory lncRNAs in snRNA-seq, while also providing a detailed understanding for the preferential detection of long genes upon using this technique. To remove such technical detection biases, we propose a normalization strategy for a more accurate comparison of nuclear and cellular data. Finally, we show successful integration of scRNA-seq and snRNA-seq data sets with existing bioinformatic tools. Overall, our results illustrate the applicability of snRNA-seq for the characterization of cellular diversity in the adipose tissue.
Adipose tissue is a complex, heterogenous organ responsible for maintaining energy balance in animals by storing energy during nutritional excess and providing energy during nutritional deprivation. This regulation of whole-body energy homeostasis is primarily maintained by two functionally different types of fat: white adipose tissue (WAT), the primary site of lipid storage, and brown adipose tissue (BAT), which specializes in thermogenic energy expenditure. An imbalance in the metabolic activity or expansion of WAT and BAT is implicated in the pathogenesis of lipodystrophy or obesity and associated comorbidities like cardiovascular diseases and type 2 diabetes (Jo et al. 2009; Carobbio et al. 2011; Levelt et al. 2016). Further complexity arises from the heterogeneity within WAT, which also includes a cellular subtype called beige adipocytes with greater oxidative capacity (Pfeifer and Hoffmann 2015). Therefore, understanding the molecular pathways of adipose tissue expansion (adipogenesis) in humans and identifying resident cell types that regulate adipocyte activity are necessary for understanding the tissue's contribution in the pathology of such metabolic diseases. Consequently, recent studies are beginning to elucidate cellular heterogeneity and developmental pathways in distinct adipose tissue lineages at the single-cell level (Deutsch et al. 2020; Ferrero et al. 2020; Shamsi et al. 2021).
Over the last decade, single-cell RNA sequencing (scRNA-seq), combined with microfluidic technologies, has proven to be a powerful tool for transcriptomic profiling of complex tissues in an unbiased fashion (Trapnell 2015; Birnbaum 2018; Chen et al. 2018). Indeed, multiple recent studies using microfluidic scRNA-seq approaches have investigated the heterogeneity of adipocyte precursors (referred to as preadipocytes in the text) in mice (Ferrero et al. 2020; Rondini and Granneman 2020). However, transcriptomic profiling of single mature adipocytes has been challenging (Shinoda et al. 2015; Xue et al. 2015; Min et al. 2016; Spaethling et al. 2016; Gao et al. 2017; Lee et al. 2019; Song et al. 2020), in part because of the technical barriers associated with isolating intact adipocytes, which are marked with fragile nature, high buoyancy, and large size (Deutsch et al. 2020). Consequently, single-nucleus RNA sequencing (snRNA-seq) is emerging as an alternative approach for transcriptomic profiling of cellular heterogeneity within adipose tissue (Rajbhandari et al. 2019; Sun et al. 2020; Sárvári et al. 2021). However, a single nucleus contains 10- to 100-fold less mRNA than whole cells, raising the question of whether the composition of mRNA transcripts in the nucleus is sufficient to enable identification of the same cell populations as whole cells. Indeed, previous comparisons of single-cell and single-nucleus approaches have shown that the relationship between nuclear and cytoplasmic mRNA is tissue specific (Habib et al. 2017; Lake et al. 2017; Bakken et al. 2018; Wu et al. 2019; Selewa et al. 2020; Thrupp et al. 2020). Therefore, there is a need to understand the transcriptomic similarities and differences between single-cell and single-nucleus profiles in the context of human adipose tissue, for which there is growing need to rely on snRNA-seq.
In this study, we explored the ability of snRNA-seq to recapitulate the transcriptional profiles observed by scRNA-seq in the human adipose tissue white and brown lineages. We focused our study on a well-controlled in vitro system of human white and brown adipogenesis (Fig. 1A; Xue et al. 2015; Kriszt et al. 2017). In this in vitro model, paired white and brown primary preadipocytes were isolated from a defined region (the neck depot) of a single individual. This system allowed us to measure cell-to-cell transcriptomic variations within and between lineages, while controlling for inter-individual variabilities that are typically associated with transcriptomic profiling of primary human adipose tissue, such as body mass index, genotype, and gender. Preadipocytes from both lineages were isolated while preserving their intrinsic cellular heterogeneity and were then immortalized to allow for long-term in vitro cell culture. Previously reported data showed that the preadipocyte populations could be differentiated into mature adipocytes with gene expression profiles that correspond to the adipogenic and thermogenic function of primary tissue from human neck BAT and WAT (Xue et al. 2015). Moreover, the in vitro cell-culture system allows for the isolation of intact nuclei as well as intact single cells across well-defined stages of adipogenesis, including mature, lipid-laden white and brown adipocytes. Overall, using this model system, we aimed to characterize the accuracy with which snRNA-seq can identify cell types and recover biology relevant to the adipose tissue, compared with scRNA-seq.
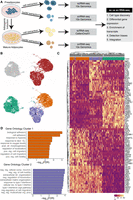
scRNA-seq reveals transcriptional and compositional landscapes of white and brown preadipocytes. (A) A schematic representation of scRNA-seq versus snRNA-seq characterizations performed in our study. Comparisons were performed at both the preadipocyte stage and the mature adipocyte stage using an in vitro system of human preadipocytes. For the cell culture maintenance and differentiation protocol, see the Supplemental Methods. (B) UMAP visualization of white and brown preadipocytes either annotated manually to reflect the sample of origin (top panel) or annotated based on unsupervised clustering (bottom panel); 2578 white and 4055 brown cells were detected. Of these cells, 2558 were in cluster 0, 2062 in cluster 1, and 2013 in cluster 2. (C) Heat map of the top 20 differentially expressed genes between white and brown preadipocytes, as well as cluster 1 and cluster 2 preadipocytes based on log fold change values. Both genes (rows) and cells (column) underwent unsupervised clustering, with the top row reflecting cluster assignment as in B. (D) Top 10 Gene Ontology biological processes terms enriched in brown preadipocyte cluster 1 (top panel) and cluster 2 (bottom panel). (decr.) Decreased, (anat. str.) anatomical structure, (pos. reg.) positive regulation, (neg. reg) negative regulation, (str.) structural.
Results
scRNA-seq reveals transcriptional landscape of white and brown preadipocytes
Unsupervised clustering of the white and brown preadipocyte scRNA-seq library grouped the cells into three clusters, referred to as populations 0, 1, and 2 (Fig. 1B). White preadipocytes organized into a single homogeneous cell population, cluster 0, whereas brown preadipocytes revealed two cell populations, cluster 1 and cluster 2 (Fig. 1B). As expected, clusters of white and brown preadipocytes were highly concordant with molecular features of respective primary preadipocytes (Supplemental Fig. S1C,D; Tews et al. 2014). All populations were devoid of endothelial (CD31) and hematopoietic marker genes (PTPRC [previously known as CD45]) (Supplemental Fig. S1E,F) and reflected a preadipocyte state on the basis of their high expression for the common mesenchymal stem cell markers ITGB1 (also known as CD29), THY1 (also known as CD90), CD44, and ENG (Supplemental Fig. S1G–J; Cawthorn et al. 2012; Mildmay-White and Khan 2017). All populations also had positive expression for adipogenesis regulators CEBPB & PPARG (Ghaben and Scherer 2019), as well as ZEB1 (Gubelmann et al. 2014), further verifying an adipogenic fate for these cells (Supplemental Fig. S1K–M).
Differential gene expression (DGE) analysis confirmed that white preadipocytes showed enrichment of genes that are reported to be involved in establishing white preadipocytes’ identity (Supplemental Table S1B) such as TCF21 (de Jong et al. 2015), PAX3 (Sanchez-Gurmaches et al. 2016), and PDGFRA (Berry and Rodeheffer 2013). The most up-regulated gene in white preadipocytes was ID1 (Fig. 1C), which is known to maintain the progenitor state in preadipocytes by positively regulating the progression of cell cycle for sustained growth and proliferation (Satyanarayana et al. 2012; Patil et al. 2014). Consequently, enriched expression of ID1 in white preadipocytes suggested ongoing signaling for the maintenance of cellular proliferation. In brown preadipocytes, the top up-regulated genes included ANKRD1 and CCN2 (Fig. 1C), which are well-characterized YAP target genes (Yu et al. 2012). YAP/TAZ are mechanosensitive transcriptional coactivators that regulate proliferation and differentiation at the precursor state (Dupont et al. 2011; Hansen et al. 2015; Zhang et al. 2018), while also maintaining thermogenic activity at mature adipocyte state in brown lineage (Tharp et al. 2018). Therefore, our results suggest that brown preadipocytes may have ongoing YAP/TAZ activity for maintenance of brown-lineage progenitor state. DGE analysis also revealed up-regulation of smooth-muscle lineage marker genes in brown preadipocytes, such as TAGLN (Fig. 1C), ACTA2, MYL9, and CNN1 (Supplemental Table S1B). These findings are consistent with a recent study that showed abundant expression of smooth-muscle lineage–selective genes in clonal human brown preadipocytes (Shinoda et al. 2015), suggesting that brown preadipocytes derived from human neck depot may share this lineage.
Of note, we identified two distinct cell populations within brown preadipocytes (cluster 1 and cluster 2) (Fig. 1B). Gene Ontology (GO) analysis identified cellular adhesion and regulation of cellular motility as the most enriched terms in cluster 1 (Fig. 1D), suggesting the prevalence of stem cell–like migratory behavior in these cells. Transforming growth factor superfamily genes (BMP4 and TGFB2) were also enriched in cluster 1 (Supplemental Table S1C), which play an important role in regulating adipocyte commitment in mesenchymal stem cells (Modica and Wolfrum 2017; Li and Wu 2020). Investigating differential activity of transcription factors (TFs) in cluster 1, transcription factor enrichment analysis (TFEA) identified FOX (FOXC2 and FOXL1) and FOSL1 TFs with high activity (Supplemental Table S1D). FOXC2 participates in the early regulation of preadipocyte differentiation (Gerin et al. 2009; Lidell et al. 2013), whereas FOSL1 proteins have been implicated as regulators of cell differentiation and transformation (Luther et al. 2011, 2014). Therefore, our results indicate that cluster 1 cells may show migratory behavior with ongoing signaling similar to adipogenic fate commitment in mesenchymal stem cells, a behavior we refer to here as stem cell–like. Enrichment of multiple regulators of adipose tissue development was also detected in cluster 1, such as SEMA5A (Giordano et al. 2001), NPPB (Villarroya and Vidal-Puig 2013), MEST (Karbiener et al. 2015), and FST (Braga et al. 2014), further suggesting the existence of adipogenic commitment activity in this cell population.
Cluster 2 cells were marked by the expression of the S100A4 gene, also known as the fibroblast-specific protein-1 (FSP1) (Fig. 1C; Supplemental Fig. S2D,F), which is considered a reliable marker of fibroblasts (Strutz et al. 1995). GO analysis showed enrichment of immune response, extracellular structure, and matrix organization, as well as negative regulation of cell migration terms, in this cell population (Fig. 1D). Multiple genes encoding for extracellular matrix (ECM) components such as MFAP5, ECM1, COL6A2, and ACAN were also enriched in cluster 2 (Supplemental Table S1C). Recent investigations have reported the presence of S100A4+ fibroblasts in the adipogenic niche, with a potential role in maintaining adipose homeostasis (Hou et al. 2018; Zhang et al. 2018; Vijay et al. 2020). The markers identified for fibroblasts in these investigations—FBN1, IGFBP6, MFAP5, S100A4, and PI16—were some of the most enriched markers of cluster 2 cells (Supplemental Fig. S2A–F). Therefore, these results indicate that cluster 2 cells are fibroblast-like, with negative regulation of cellular migration and an ongoing activity for ECM organization. The existence of two phenotypically distinct brown preadipocytes was further corroborated by performing single-molecule fluorescent in situ hybridization (smFISH) imaging of the cluster 2–enriched gene MMP1 (Supplemental Note S2; Supplemental Fig. S3).
Recently, snRNA-seq of primary human WAT harvested from the same region as our model system (neck) identified a single white preadipocyte population (Sun et al. 2020), whereas multiple scRNA-seq studies identified two to three adipocyte progenitor populations in adult murine abdominal WAT (Ferrero et al. 2020). These differences in WAT preadipocyte composition could arise from species-specific and/or depot-specific variation. In contrast to our findings, snRNA-seq of primary human neck BAT also revealed a homogenous brown preadipocyte population (Sun et al. 2020), possibly because of differences during tissue biopsy collection or because of poor cell-capture efficiencies during single-nuclei isolation.
snRNA-seq identifies the same preadipocyte populations as scRNA-seq and detects biologically relevant differential expression
To evaluate the efficacy of snRNA-seq for recovering transcriptional heterogeneity, we sequenced the nuclear transcriptome of single preadipocytes from the white and brown lineages. Unsupervised clustering of the two lineages grouped nuclei into four clusters, referred to as populations 0, 1, 2, and 3 (Supplemental Fig. S4A,B). Cluster 3 nuclei, however, had enriched expression for stress-response genes and mitochondrial genes, along with high background RNA contamination (Supplemental Fig. S4D) and, hence, were removed from downstream analyses. In the remaining clusters, brown nuclei were primarily grouped into clusters 1 and 2, whereas white nuclei grouped into a single cluster, 0 (Fig. 2A). Similarity between clusters identified in snRNA-seq and scRNA-seq was assessed using the concept of transcriptional signatures (DeTomaso and Yosef 2016; Gaublomme et al. 2019), defined as genes differentially expressed in either white vs brown preadipocytes, or cluster 1 versus cluster 2, in the scRNA-seq data set (Supplemental Table S1B,C). As expected, the transcriptional signature scores, calculated using Vision (DeTomaso et al. 2019), were enriched in the corresponding preadipocyte-type/clusters in the snRNA-seq data set (Fig. 2B), thereby showing a high concordance between transcriptional features uncovered by the two techniques.
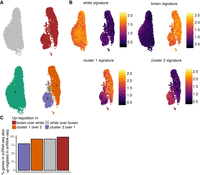
snRNA-seq identifies the same preadipocyte populations as scRNA-seq and detects biologically relevant differential expression. (A) UMAP visualization of white and brown preadipocytes either annotated manually to reflect the sample of origin (top) or annotated based on unsupervised clustering (bottom); 6556 white and 3891 brown nuclei were detected. Of these nuclei, 6578 were in cluster 0, 2716 in cluster 1, and 1153 in cluster 2. (B) Heat map of transcriptional signature scores for white preadipocyte (top left), brown preadipocyte (top right), brown preadipocyte cluster 1 (bottom left), and brown preadipocyte cluster 2 (bottom right) as plotted on the UMAP visualization of snRNA-seq data. (C) Bar plot of percentage of top 50 genes differentially enriched (DE) in the scRNA-seq data set that are also DE in the snRNA-seq data set. The top 50 genes were evaluated based on log fold change values using the scRNA-seq data set.
As was observed with scRNA-seq, white nuclei were enriched for the genes TCF21, PAX3, and PDGFRA (Supplemental Table S2A), and brown nuclei were enriched for the YAP/TAZ target genes ANKRD1 and CCN2 (Supplemental Table S2A) and the smooth-muscle lineage marker genes TAGLN, MYL9, CNN1, and MYH11 (Supplemental Table S2A). Gene ID1, however, was not differentially enriched in white nuclei because of a lack of differential enrichment in the nuclear compartment between white and brown preadipocyte (Supplemental Note S3; Supplemental Fig. S5). In scRNA-seq data set, we had classified certain DE genes as markers for white and brown preadipocytes based on their highly enriched and specific expression (Supplemental Note S6). All such white preadipocyte– and brown preadipocyte–specific marker genes were also enriched in white and brown nuclei, respectively (Supplemental Table S2A). Of the 50 genes with maximum enrichment (ordered by logFC) in white and brown preadipocytes in the scRNA-seq data set, >94% were also differentially expressed in white and brown nuclei, respectively (Fig. 2C). This analysis shows that snRNA-seq has sufficient sensitivity to recover the same molecular differences as scRNA-seq between white and brown preadipocytes.
GO analysis identified enrichment of cellular adhesion and regulation of cellular localization terms in brown cluster 1 nuclei, corresponding with the findings in scRNA-seq data set (Supplemental Fig. S4E). Transforming growth factor superfamily genes BMP4 and TGFB2 were also enriched in cluster 1, along with regulators of adipose tissue development SEMA5A, MEST, and FST (Supplemental Table S2B). All six cluster 1–specific marker genes (Supplemental Note S6) identified were also enriched in cluster 1 nuclei (Supplemental Table S2B). Of the 50 genes with maximum enrichment (ordered by logFC) in cluster 1 cells in the scRNA-seq data set, 94% were also differentially expressed in the nuclear data set (Fig. 2C). In cluster 2 brown nuclei, enrichment of S100A4 was observed (Supplemental Table S2B), as well as regulation of ECM organization terms based on GO analysis (Supplemental Fig. S4F). Genes encoding for the ECM components COL6A2, MFAP5, ACAN, and ECM1 were all up-regulated in cluster 2 (Supplemental Table S2B). Of the 50 genes with maximum enrichment (logFC) in cluster 2 brown preadipocytes (scRNA-seq data set), 80% were also differentially expressed in the nuclear data set (Fig. 2C). All cluster 2–specific marker genes (Supplemental Note S6) identified were also enriched in cluster 2 nuclei (Supplemental Table S2B). Overall, our snRNA-seq analyses indicated the emergence of stem cell–like behavior in cluster 1 and fibroblast-like behavior in cluster 2, in agreement with the whole-cell data set. Finally, preadipocyte-/cluster-specific transcriptional signatures now defined using the snRNA-seq data set revealed enrichment in the corresponding preadipocyte-type/clusters in the scRNA-seq data set, thereby validating that markers derived from snRNA-seq can be used to identify the same populations in whole-cell analysis (Supplemental Fig. S4H).
Gene length–associated detection bias in snRNA-seq
Typical scRNA-seq data analysis pipelines often filter intronic reads for downstream count matrix generation. More recently, however, evidence has suggested that intronic reads originate from nascent transcripts (Ameur et al. 2011; Gray et al. 2014; Hendriks et al. 2014) and, hence, are informative about expression levels in single-cell data. Furthermore, the additional read counts improve gene detection sensitivity and can improve cell-cluster resolution (Bakken et al. 2018; Wu et al. 2019). Multiple recent studies have suggested internal hybridization of poly(T) RT-primer to intronic poly(A) stretches in nascent transcripts as the primary mechanism for the capture and detection of intronic reads (La Manno et al. 2018; Shulman and Elkon 2019; Patrick et al. 2020). Consequently, intronic reads are more readily detected in genes with more intronic poly(A) stretches, which are more likely to be longer in length (Supplemental Fig. S6A). This bias is increased in nuclear libraries where up to 40% of all the reads map to intronic regions compared with only 9% in scRNA-seq (Fig. 3A). Consequently, recent studies have reported enrichment of longer genes (Lake et al. 2017; Bakken et al. 2018) and poor detection of shorter genes (Thrupp et al. 2020) in nuclei.
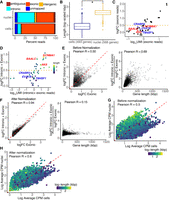
Gene length–associated detection bias in the nuclear transcriptome. (A) Distribution of reads in the scRNA-seq and snRNA-seq preadipocyte data sets. (B) Distribution of gene length for genes enriched in cells (in blue) and nuclei (in yellow) with log fold change > 1 and FDR < 0.05, including both intronic and exonic reads. (C) logFC versus log-UMI counts in white nuclei when using only exonic reads, where each dot represents a white preadipocyte–enriched gene (white vs. brown DE test) detected using the scRNA-seq data set. Horizontal dotted line indicates a logFC cutoff value of 0.5 used as a threshold for DE testing. All genes had a logFC > 0.5 in the scRNA-seq data set. (D) logFC versus log-UMI counts in white nuclei when using both intronic and exonic reads. Each dot is the same as in panel C. Horizontal dotted line indicates a logFC cutoff value of 0.5 used as a threshold for DE testing. Highlighted genes are represented with a square symbol. (E, left): logFC for nuclear-enriched genes when using only exonic reads or both intronic and exonic reads before normalization. Each dot represents a gene enriched in nuclei using exonic-only reads with logFC > 0.25 and FDR< 0.05. Red dotted line indicates y = x axis. (Right) Ratio of y-axis value over x-axis value for genes in left panel, plotted as a function of their length. (F, left) logFC for nuclear-enriched genes when using only exonic reads or both intronic and exonic reads after normalization. Each dot is the same as in panel E. Red dotted line indicates y = x axis. (Right) Ratio of y-axis value over x-axis value for genes in left panel, plotted as a function of their length. (G,H) Average expression of genes in white cells and white nuclei when using both intronic and exonic reads, without normalization (G) and with normalization (H). For normalization strategy, see Supplemental Note S5. Each dot represents a gene with average counts per million (CPM) >1 when using both intronic and exonic reads, without normalization, in both cells and nuclei. White nuclei were randomly selected to have as many barcodes as white cells. Red dotted line has a slope of 1.
To examine the enrichment of long genes in nuclei, we first performed DGE analysis between cells and nuclei in white preadipocytes. Using both intronic and exonic reads, our analysis identified 493 genes enriched in cells and 568 genes enriched in nuclei (logFC > 1 and FDR < 0.05). This analysis revealed nuclear-enriched genes to be significantly longer than genes enriched in whole cells (two-group Mann–Whitney U test, P-value < 0.01) (Fig. 3B). Next, we performed DGE analysis between white and brown nuclei, with and without intronic reads, for genes that are enriched in white preadipocytes in the scRNA-seq data set. Certain long genes such as KCNMA1 (99th percentile), AK5 (96th percentile), and BAALC (85th percentile) were differentially expressed (in white nuclei over brown nuclei; DE) only upon inclusion of intronic reads (non-DE with only exonic reads), likely because of their preferential detection (Fig. 3C,D, highlighted in red). Conversely, we also identified certain short genes such as CRABP2 (32nd percentile), TM4SF1 (40th percentile), and EVA1B (17th percentile) that remain nondifferentially expressed, even with inclusion of intronic reads in the snRNA-seq data set (also non-DE with only exonic reads) (Fig 3C,D, highlighted in blue). We also performed DGE analysis between white cells and white nuclei using only exonic reads (logFC > 0.25 and FDR < 0.05). The logFC differential enrichment for nuclear-enriched genes was poorly correlated with counting exons or exons and introns (Pearson R = 0.50, P-value < 0.01) (Fig. 3E). logFC values for some of the longest genes were artificially inflated, possibly because of their preferential detection upon inclusion of intronic reads (Fig. 3E). Conversely, logFC values for some of the shortest genes were artificially deflated because of their poor detection (Fig. 3E). Consequently, the ratio of the logFC values with counting exons or exons and introns was strongly correlated with gene length (Pearson R = 0.69, P-value < 0.01) (Fig. 3E). Overall, our results show technical artifacts induced by gene length–associated detection bias in snRNA-seq upon inclusion of intronic reads. We therefore developed a normalization strategy to address this technical, length-associated detection bias (Supplemental Note S5; Supplemental Fig. S6). After normalization, the logFC differential enrichment of nuclear-enriched genes was highly correlated with counting exons or exons and introns (Pearson R = 0.94, P-value < 0.01) (Fig. 3F). Moreover, the ratio of the logFC values with counting exons or exons and introns, after normalization, was poorly correlated with gene length (Pearson R = 0.15, P-value < 0.01) (Fig. 3F). Nuclear and cellular transcriptomes were also better correlated after removal of technical biases using our normalization strategy (Fig. 3G,H).
DGE analysis, between white cells and white nuclei, with normalized read counts identified 382 enriched genes in cells and 249 enriched genes in nuclei (logFC > 1 and FDR < 0.05), with nuclear-enriched genes still significantly longer than whole cells (two-group Mann–Whitney U test, P-value < 0.01) (Supplemental Fig. S7A). However, the genes enriched in nuclei were, on average, 14-fold longer than genes enriched in cells (compared with a 32-fold difference before normalization), which is comparable with the difference observed when using only exonic reads (11-fold difference) (Supplemental Fig. S7B), suggesting that after accounting for technical bias, there also exists biological enrichment of longer genes in nuclei. Overall, our observations show that length normalization removes artificial detection biases, thereby improving UMI count estimation accuracy while also preserving improved gene detection sensitivity afforded by inclusion of intronic reads.
To further understand differential transcript enrichment between whole-cell and nuclear transcriptomes, we next focused on genes enriched in whole cells after normalization. GO analysis identified protein translation-associated terms as most enriched in whole cells (Supplemental Fig. S7D). Genes contributing to the enrichment of translational terms primarily included mRNAs encoding for ribosomal proteins. This enrichment of ribosomal-protein mRNAs in whole cells is consistent with their very low cytoplasmic decay rates and selective nuclear export machinery (Wickramasinghe et al. 2014; Chen and van Steensel 2017). Yet, poor detection of ribosomal proteins in the nuclear transcriptome did not affect the ability to resolve cellular populations in snRNA-seq, as evident by the score of the transcriptional signature consisting of the top 100 genes enriched in cells based on logFC values (approximately 53/100 ribosomal protein genes) (Supplemental Fig. S7C).
Nuclear transcriptome is enriched for long noncoding RNAs that regulate adipogenesis and drive cell type differences
Long noncoding RNAs (lncRNAs) function in regulating diverse biological processes, including regulation of transcription, proliferation, pluripotency, and cellular differentiation (Quinodoz and Guttman 2014; Samata and Akhtar 2018; Sherstyuk et al. 2018; Delá et al. 2019). Because of their regulatory function, lncRNAs predominantly remain localized in the nucleus (Cabili et al. 2015; Wen et al. 2018). snRNA-seq intrinsically enriches for nuclear localized transcripts, and previous studies have reported enrichment of lncRNAs in snRNA-seq libraries over scRNA-seq (Grindberg et al. 2013; Zeng et al. 2016). We hypothesized that nuclear enrichment of lncRNAs could be advantageous for characterizing adipose tissue because multiple lncRNAs have also been implicated in regulating adipogenesis (Sun et al. 2013; Wei et al. 2016; Ding et al. 2018; Sun and Lin 2019; Zhou et al. 2020). We tested this hypothesis in our in vitro system by profiling adipogenic regulatory lncRNAs in our whole-cell and nuclear libraries derived from white preadipocytes after normalization. We identified significant enrichment of the lncRNAs NEAT1 (Wei et al. 2016), MEG3 (Li et al. 2017), MIR31HG (Huang et al. 2017), and PVT1 (Zhang et al. 2020) in white nuclei, which are previously reported regulators of adipogenesis (Fig. 4A). All four lncRNAs were also enriched in brown nuclei compared with brown whole cells (Supplemental Fig. S8A–D). Generally, snRNA-seq consistently detected a greater number of lncRNAs at all read depths than did scRNA-seq (P-value < 0.01, two-group Mann–Whitney U test) (Fig. 4B). Of the 111 differentially expressed lncRNAs between white nuclei and white cells, ∼86% (96/111 genes) were up-regulated in nuclei, thereby validating a higher prevalence of this class of genes in the nuclear compartment. Seven out of 15 lncRNAs that were enriched in white cells were snoRNA host genes (SNHGs), which have been shown to have various functions in cytoplasm such as repressing mRNA translation, miRNA sponging, and protein ubiquitination (Zimta et al. 2020). Overall, our results suggest a higher likelihood to deconstruct the functional roles of adipogenic regulatory lncRNAs (and other lncRNAs in general) using snRNA-seq.
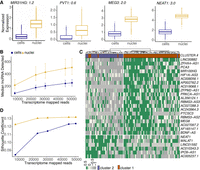
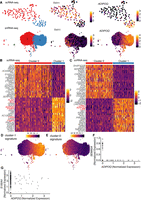
Nuclear transcriptome is enriched for lncRNAs that regulate adipogenesis and drive cell type differences. (A) Box plots of lncRNAs reported as regulators of adipogenesis. Black text indicates logFC value for white nuclei versus white cell DE test in preadipocytes with a FDR< 0.05 after normalization. (B) Median lncRNAs detected as a function of read depth across single cells and nuclei (both white and brown lineages). Error bars indicate the interquartile range. (C) Hierarchical clustering using scaled expression values of the top-20 up-regulated lncRNAs in brown cluster 1 and cluster 2 in the snRNA-seq data set. One-hundred random barcodes were chosen for this analysis. Top row reflects original cluster assignment for the selected barcodes. (D) Cluster separation resolution quantification between brown cluster 2 versus cluster 1 in the scRNA-seq and snRNA-seq data set. Only lncRNAs were considered for PCA manifold generation. Both data sets were subsampled to have the same number of cells/nuclei and same number of mean transcriptome mapped reads.
Next, we evaluated the sensitivity of snRNA-seq for detection of lncRNAs driving molecular heterogeneity between brown preadipocyte cluster 1 and 2, two cell types most closely related to each other. At approximately 50,000 reads per cell/nuclei, DGE analysis identified more than 40 lncRNAs distinctively regulated between cluster 1 and 2 in the snRNA-seq data set compared with only 15 lncRNAs in the scRNA-seq data set. Unsupervised hierarchical clustering in the snRNA-seq data set based on the expression of the top 20 up-regulated lncRNAs in cluster 1 and 2 each revealed sorting of nuclei into two distinct groups that predominantly reflected their original cluster assignment (Fig. 4C). Moreover, silhouette coefficient analysis (a method for evaluating clustering performance) revealed better cluster separation performance for snRNA-seq compared with scRNA-seq between cluster 1 and 2 for all down-sampled read depths (Fig. 4D). Silhouette coefficients were calculated based on the Euclidean distance between cells/nuclei in the principal component space generated using only lncRNAs (see Supplemental Material). To validate that the observed performance features were not metric dependent, we quantified two more indices, the Calinski–Harabasz index and the Davies–Bouldin index, to compute inter-cluster separation and found similar trends (Supplemental Fig. S8F,G). A similar analysis performed by normalizing for the same number of mean unique molecules (UMIs) per sample revealed a similar trend for the three separation indices (Supplemental Fig. S8H–J). Together, our results suggest that snRNA-seq is superior for learning heterogeneity governed by lncRNAs compared with scRNA-seq.
snRNA-seq detects relevant transcriptional regulation during adipogenesis in white preadipocytes
After identifying transcriptomic similarities and differences between scRNA-seq and snRNA-seq in the preadipocyte state, we next focused on evaluating molecular correspondence between the two techniques in mature adipocytes. We leveraged our in vitro model of white adipogenesis that enabled us to prepare a single-cell suspension of mature adipocytes without the need of implementing harsh tissue dissociation protocols (see Methods). Following single-cell suspension preparation, one of the most common ways to sort single cells is using flow cytometry. Recently, FACS gating strategies have been tailored to isolate mature adipocytes (Majka et al. 2014; Hagberg et al. 2018), although only a small percentage of adipocytes are able to survive the shear stress associated with flow sorting (Majka et al. 2014). Therefore, to enable gentle sorting of single adipocytes for downstream scRNA-seq, we developed a new protocol using the cellenONE X1 single-cell isolation platform. This automated liquid-handling robot uses gentle piezo-acoustic technology for dispensing cells encapsulated in a picoliter-volume droplet, ensuring minimal cellular perturbation and background RNA contamination. To harvest adipocytes in vitro, human white preadipocytes were cultured and differentiated using a chemical adipogenic induction cocktail for 20 d (Shamsi and Tseng 2017). Coherent antistokes Raman imaging established successful differentiation of white preadipocytes, with distinctly visible signal from round lipid droplets (Supplemental Fig. S9A; Gupta et al. 2019). After creating a single-cell suspension of white adipocytes, 200 cells were spotted using the cellenONE X1 machine onto 96-well plates preloaded with lysis buffer and barcoded poly(T) primer. Library preparation was then performed using mcSCRB-seq chemistry (Bagnoli et al. 2018). Transcriptomic profiles of these cells were then compared with a snRNA-seq library of approximately 12,000 nuclei isolated from 20-d differentiated white adipocytes.
Independent unsupervised clustering revealed organization of both cells and nuclei into primarily two clusters, referred to as clusters 0 and 1 (Fig. 5A). snRNA-seq identified an additional cluster 2, which showed characteristics of mitotic preadipocytes with ongoing cell cycle progression, suggesting that these cells could be preadipocytes that never underwent growth arrest (Supplemental Note S4; Supplemental Fig. S10A–H). Cluster 0 in both data sets was marked by the expression of mesenchymal marker THY1 (Fig. 5A), suggesting that these cells/nuclei were differentiating preadipocytes. Cluster 1, on the other hand, had high expression of the adipogenic gene ADIPOQ, indicating that cells/nuclei in this cluster were mature adipocytes (Fig. 5A). DGE analysis further identified enrichment of other adipogenic marker genes (along with ADIPOQ) in cluster 1 (Fig. 5B,C, highlighted in red), confirming a transition from differentiating preadipocytes to mature adipocytes from cluster 0 to cluster 1 in both data sets. GO analysis identified enrichment of ECM organization terms in cluster 0 and lipid metabolism in cluster 1, independently in both the scRNA-seq and snRNA-seq data sets (Supplemental Fig. S9B–E). Moreover, ∼80% genes (106/133) up-regulated in cluster 1 in the scRNA-seq data set were also differentially expressed in the snRNA-seq data set. Notably, the remaining 20% genes (27/133) that were not differentially expressed in the snRNA-seq data set primarily included genes associated with the mitochondrial respiratory chain process (Supplemental Fig. S9F), suggesting that adipocytes’ enhanced mitochondrial activity may not be captured in the snRNA-seq data set. Correspondingly, the snRNA-seq data set lacked manifestation of mitochondrial biological processes such as oxidative phosphorylation and electron transport chain in cluster 1 upon GO (Supplemental Fig. S9B,D). This observation was also supported by the fact that these 27 genes had a median length of ∼11 kb, the same order of magnitude as the length of genes with poor detection in nuclei over whole cells (Fig. 3B). As expected, scores of the cluster 0 and 1 transcriptional signatures in the scRNA-seq data set were observed to be highly conserved and enriched in corresponding cluster types (Fig. 5D,E), further validating the conservation of information in the nuclear transcriptome. Overall, our results reveal a comparable molecular landscape in white adipocytes between the scRNA-seq and snRNA-seq data sets.
snRNA-seq detects important transcriptional regulation during adipogenesis in white preadipocytes. (A) UMAP visualization of scRNA-seq and snRNA-seq white adipocyte data sets (day 20) after unsupervised clustering (left panels). The scRNA-seq data set had 109 cells in cluster 0 and 38 cells in cluster 1. The snRNA-seq data set had 4859 nuclei in cluster 0, 4546 nuclei in cluster 1, and 31 nuclei in cluster 2. Expression profile for mesenchymal marker THY1 and mature-adipocyte marker ADIPOQ in both scRNA-seq and snRNA-seq data sets (middle and right panels). (B) Heat map of z-scored expression of the top 20 differentially expressed genes between cluster 0 and cluster 1 in the scRNA-seq white adipocyte data set. Highlighted in red are markers of adipogenesis. (C) Heat map of z-scored expression of the top 20 differentially expressed genes between cluster 0 and cluster 1 in the snRNA-seq white adipocyte data set. A random subset of 150 barcodes was used for this visualization. Highlighted in red are markers of adipogenesis. (D) Heat map of transcriptional signature scores for cluster 1 as plotted on the UMAP visualization of snRNA-seq white adipocyte data. (E) Heat map of transcriptional signature scores for cluster 0 as plotted on the UMAP visualization of snRNA-seq white adipocyte data. (F,G) Normalized expression of genes ADIPOQ and SEMA5A (F) and ADIPOQ and S100A4 (G) in differentiating brown preadipocytes (day 20) scRNA-seq data set. Also see Supplemental Figure S2, G–I.
We next looked to investigate any differential adipogenic capacity between the two brown preadipocyte clusters identified in our study (cluster 1 and 2) (Fig. 1B) by performing scRNA-seq on mature brown adipocytes using the cellenONE X1 for gentle isolation of intact mature adipocytes. These adipocytes were derived by differentiating brown preadipocytes for a period of 20 d. After sorting approximately 200 cells, library preparation was performed using the mcSCRB-seq protocol (Bagnoli et al. 2018). Transcriptomic profiling revealed detection of mature brown adipocytes, along with recovery of multiple cells that were not terminally differentiated but rather distributed along a continuum of differentiation states (Supplemental Fig. S2G,H). Consequently, our analysis revealed a range of adipogenic gene expression (ADIPOQ) in our data set (Fig. 5F), which was mutually exclusive from the expression of the cluster 1–enriched gene SEMA5A (Fig. 5F). On the other hand, we identified multiple cells with shared expression of the cluster 2–enriched genes S100A4 and ADIPOQ (Fig. 5G). These results supported the observation of two brown preadipocyte populations and indicate that cluster 2 cells are more likely to differentiate into mature brown adipocytes. Additionally, we also compared transcriptomic similarities between mature brown adipocytes (Supplemental Fig. S2H, highlighted in red) and cluster 1/cluster 2 cells using transcriptional signatures defined for respective clusters using the day-0 scRNA-seq data set (Supplemental Table S1C). Mature adipocytes had a significantly higher score for cluster 2 cells compared with those of cluster 1 (Supplemental Fig. S2I), thereby providing additional evidence that the former cell type is more likely to be adipogenic.
Integration of snRNA-seq and scRNA-seq data sets
A comprehensive cell atlas of the adipose tissue will require joint analyses of data sets generated using both scRNA-seq and snRNA-seq. However, technical biases and differential transcript enrichment in snRNA-seq lead to significant batch effects between snRNA-seq and scRNA-seq experiments, thereby reducing clusterability of cells from these two protocols (Mereu et al. 2020). Multiple bioinformatic tools are now available to remove covariates that lead to technical batch effects and to facilitate integration of scRNA-seq data sets generated across different days, laboratories, individuals, or technologies (Zappia et al. 2018). We used single-cell variational inference (scVI), a deep generative modeling-based tool (Lopez et al. 2018; Gayoso et al. 2021), to explore the possibility of integrating the snRNA-seq and scRNA-seq data sets for joint analysis. Four data sets of white preadipocytes were integrated in total: day-0 scRNA-seq and snRNA seq (cluster 0 in Figs. 1B, 2A) and day-20 scRNA-seq and snRNA-seq (top and bottom left panels in Fig. 5A).
Without batch correction, all four data sets arranged into distinct individual clusters, with no shared population identified at the same time point across different techniques or the same technique but across different time points (Fig. 6A). A dendrogram, based on the Euclidean distance in dimensionally reduced space, grouped clusters first by sequencing chemistry (mcSCRB-seq vs. 10x), followed by technique type (snRNA-seq vs. scRNA-seq), and finally by time point (day 0 vs. day 20) (Fig. 6A). After integration, matching adipocyte populations from day 20 and preadipocyte populations from both day 0 and day 20 in nuclear and whole-cell data sets were primarily nearest neighbors in a dendrogram based on the Euclidean distance in dimensionally reduced space (Fig. 6B). UMAP visualization further revealed proximal placements of similar cell populations (Fig. 6B,C). Of note, we observed that preadipocytes from both the day-0 snRNA-seq and day-0 scRNA-seq data sets localized into two distinct groups, which was driven by differences in proliferation state with one cluster composed of mitotic cells and another composed of growth arrested cells (Supplemental Note S4; Supplemental Fig. S10A–H). Unsupervised clustering of the integrated data set revealed adipocytes, day-20 preadipocytes, and the two groups of day-0 preadipocytes as distinct cell types, illustrating scVI's abilities to remove batch effects while retaining biological variation (Fig. 6C, right panel). Indeed, top marker genes for each cluster recovered previously reported expression trends such as enrichment of ECM components in day-0 preadipocytes (Weiner et al. 1989), enrichment of insulin-binding proteins in day-20 preadipocytes (Gleason et al. 2010), and enrichment of adipogenic genes in mature adipocytes (Supplemental Fig. S10J). Although multiple markers for each cluster had conserved expression across scRNA-seq and snRNA-seq, some markers were exclusively enriched in either one of the data sets (Supplemental Fig. S10J), thereby highlighting the importance of performing joint analysis. Finally, integration of the same four data sets using Seurat (Stuart et al. 2019) revealed minimal overlap of single-cell and single-nuclei data sets for both day 0 and day 20 (Supplemental Fig. S10I). Recently, benchmarking of distinct integration methodologies indeed revealed effective performance by scVI on complex integration tasks, with Seurat v3 performing well on simpler tasks with distinct biological signals (Luecken et al. 2022). Overall, our results show scVI's integration abilities by identifying functionally similar preadipocyte and adipocyte populations shared across scRNA-seq and snRNA-seq techniques.
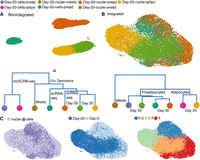
Integration of the snRNA-seq and scRNA-seq data sets. (A, top panel) UMAP visualization of nonintegrated scRNA-seq and snRNA-seq data sets for both white preadipocyte (day 0) and mature adipocyte (day 20), for a total of four batches (total 18,717 barcodes). (Bottom panel) Cluster dendrogram for nonintegrated data sets based on the eigenvalue-weighted Euclidean distance matrix constructed in latent-dimension space inferred using scVI. (B) UMAP visualization and cluster dendrogram of scRNA-seq and snRNA-seq data sets as in A after integration using scVI tools (total 18,717 barcodes). See also Supplemental Note S4 and Supplemental Figure S10. (C) UMAP visualization of scVI integrated data set with barcodes annotated by sequencing technique (left), harvest day (middle), and joint unsupervised clustering (right).
Discussion
In this investigation, we evaluated the ability of snRNA-seq to recapitulate the molecular and compositional landscape of distinct lineages in human adipose tissue. We avoided confounding variability associated with inter-depot and inter-subject transcriptional variation by performing a direct comparison of snRNA-seq and scRNA-seq on a pair of immortalized white and brown human preadipocytes isolated from the neck region of the same individual. We found that snRNA-seq was able to recover the same cell types as scRNA-seq at both the preadipocyte and mature adipocyte states. Furthermore, we provided evidence for recovering similar expression profiles of biologically relevant genes and attributing similar functional annotations to cell types by nuclear transcriptome profiling compared with whole cells.
At the preadipocyte stage, brown preadipocytes were a heterogeneous mix of two distinct cell populations, cluster 1 and cluster 2. However, cell type enrichment followed by differentiation and metabolic assays will need to be further performed to identify their individual functions in maintaining adipose tissue homeostasis. To date, different scRNA-seq studies of mouse stromal vascular fraction (SVF) have identified multiple subpopulations of adipose progenitor cells (APCs) expressing distinct markers (Burl et al. 2018; Hepler et al. 2018; Schwalie et al. 2018; Merrick et al. 2019). Integrated analysis of these data sets primarily identified two common populations of APCs in mice referred to as Asc1 and Asc2 (Ferrero et al. 2020; Rondini and Granneman 2020). Like cluster 2 cells, Asc2 showed proinflammatory and profibrotic phenotype and positive expression of genes PI16 and MFAP5. Functional investigations into the two cell types revealed Asc2 cells inhibiting the differentiation of Asc1 cells in vitro (Rondini and Granneman 2020). This agrees with the proadipogenic nature of cluster 2 cells identified in our study. Therefore, it is plausible that cluster 1 and cluster 2 cells identified in our study may be functioning in a manner like Asc1 and Asc2 to maintain adipocyte turnover.
snRNA-seq is the preferred technique to study samples whose compositional landscape may be biased by the differential efficiency of cell type recovery when using scRNA-seq. Adipose tissue is one such sample in which isolation of intact, single adipocytes is complicated by their fragile nature. Indeed, most adipose scRNA-seq studies to date derive the transcriptomes of the cell types within SVF only, with minimal detection efficiencies for mature adipocytes either in animal models (Burl et al. 2018; Hepler et al. 2018; Schwalie et al. 2018; The Tabula Muris Consortium 2018; Cho et al. 2019; Gu et al. 2019; Jaitin et al. 2019; Merrick et al. 2019; Henriques et al. 2020) or humans (Acosta et al. 2017; Jaitin et al. 2019; Merrick et al. 2019; Vijay et al. 2020). Here, we developed a new single-adipocyte isolation protocol using piezo-acoustic-based gentle dispensing technology for improved recovery with downstream scRNA-seq. Using this strategy, ∼26% barcodes recovered were annotated as adipocytes. However, this adipocyte capture efficiency was still limited compared with snRNA-seq, where ∼48% barcodes were identified as adipocytes. Conversely, at the preadipocyte stage, where cell type recovery is efficient, scRNA-seq recovered equal proportions of the two brown preadipocyte clusters. However, analysis of snRNA-seq data revealed an approximately 1.5-fold enrichment of cluster 1 over cluster 2, suggesting a bias in compositional sampling in snRNA-seq. Therefore, such cell-level sampling biases must be considered when evaluating the composition of complex tissues with snRNA-seq.
Understanding the advantages and drawbacks of using snRNA-seq, a nuclear transcriptome is inherently enriched for nascent transcripts, thereby predominantly reflecting changes in gene expression as a result of differences in transcription rates alone (Gaidatzis et al. 2015). In contrast, a cellular transcriptome is fundamentally enriched for mature transcripts, thereby capturing gene expression changes driven by both transcriptional and post-transcriptional regulatory processes such as mRNA processing and degradation. A higher relative proportion of nascent to mature transcripts in the nucleus also results in a large fraction of intronic reads in snRNA-seq, which, when considered for count matrix generation, gives rise to detection bias against short genes with few intronic poly(A) stretches. Consequently, for a biological system compatible with both techniques, scRNA-seq may be better for identifying cellular subpopulations. scRNA-seq will also be better for assessing gene expression changes because of post-transcriptional regulation. However, nuclear transcriptome is preferentially enriched for lncRNAs, indicating that functional investigations of these genes will be enhanced by sequencing nuclei. Moreover, some studies of specific nuclear functions may be enhanced by directly accessing nuclei, for example, changes in gene expression profile because of targeted transcriptional activation mediated by epigenetic modifications. Therefore, it is important to evaluate each approach depending on the task at hand. However, for tissues such as the adipose tissue, snRNA-seq may be the only option. In our investigation, lncRNAs regulating adipogenesis were enriched in the nuclear transcriptome. lncRNAs driving differences between cluster 1 and 2 in brown preadipocytes were also better detected in the snRNA-seq data set. However, we also identified poor detection of shorter genes in nuclei, some of which were key to driving heterogeneity between distinct cell types.
Including intronic reads for UMI quantification presents researchers with both advantages and drawbacks. poly(A) stretches are found randomly dispersed along the length of the genome, and introns become the predominant site for the localization of such stretches because of their extensive length (21-fold longer than exons) (Piovesan et al. 2016). These poly(A) stretches present additional priming sites (besides the 3′ poly(A) tail) for the poly(T) RT primer, thereby enabling more efficient transcript capture. Conversely, most intronic reads are therefore derived from genes with multiple poly(A) stretches (long genes), thereby introducing technical detection bias. This bias gets further magnified in snRNA-seq libraries that are inherently enriched for nascent transcripts (and hence intronic reads), and filtering such reads would mean reduced gene detection sensitivity, shallower sequencing depth, and underused sequencing cost. Here, we provided a normalization strategy for UMI counts derived from intronic reads that can remove gene length–associated technical biases. Implementation of this normalization strategy removes technical artifacts while retaining true biological features, thereby improving integration and enabling joint analysis of the scRNA-seq and snRNA-seq data sets. In such joint analysis, our normalization strategy would also improve the accuracy of differential expression testing between any technique-specific clusters identified.
Finally, we showed applicability of scVI for integration of scRNA-seq and snRNA-seq data sets. This is critical for the generation of a comprehensive adipose tissue atlas because investigations into the SVF heterogeneity have been performed using scRNA-seq, whereas snRNA-seq is favorable for investigations into the existence of adipocyte subtypes. Therefore, any efforts to identify shared subpopulations across such data sets, and the lineages therein, would demand data integration. However, our findings here are based on an in vitro adipogenic model system, with a less heterogeneous cellular composition than primary tissue. Therefore, integration of the scRNA-seq and snRNA-seq data sets with this in vitro adipogenic model system is likely more robust than in a primary sample. Indeed, multiple previous reports have shown strong batch effects between scRNA-seq and snRNA-seq data sets derived from the same primary tissue, resulting in suboptimal integration performance (Slyper et al. 2020; Andrews et al. 2021; Luecken et al. 2022). Such batch effects are likely rooted in technical differences across the two techniques, such as gene length–associated detection biases and high background mRNA levels in nuclear libraries (Fleming et al. 2019; Alvarez et al. 2020). Therefore, to truly generate a comprehensive human cell atlas across varying tissue types, there is a need for evolved algorithms specifically developed for the task of integrating scRNA-seq and snRNA-seq data sets.
Overall, snRNA-seq provides an effective method for characterizing cellular heterogeneity and functionally relevant gene expression profiles within human preadipocytes and adipocytes. We expect that snRNA-seq will be actively adopted by the adipose community for high-throughput transcriptomic profiling of the tissue and will aid in increasing its representation in initiatives such as the Human Cell Atlas. Ultimately, joint analysis of data sets acquired using multiple sequencing techniques will aid in the creation of a comprehensive human adipose tissue atlas, thereby enabling us to dissect its critical role in health and disease.
Methods
Preadipocyte culture and adipogenic differentiation
The detailed protocol for maintenance, cryopreservation, and differentiation of white and brown preadipocytes is outlined in a different study (Shamsi and Tseng 2017). Briefly, preadipocytes were maintained in DMEM (Corning 10-017-CV) supplemented with 10% (v/v) FBS and 1% vol/vol penicillin–streptomycin at 37°C with 5% CO2. For differentiation, preadipocytes were maintained at 100% confluence for 48 h, after which growth media was replaced with differentiation media every 48 h for the next 20 d (see Supplemental Material).
Harvesting mature adipocyte for scRNA-seq cellenONE X1
Mature adipocytes were washed with PBS and incubated with a monolayer of 0.25% trypsin with 0.1% EDTA (Gibco 25200-056; monolayer obtained by adding and removing 1 mL of trypsin) for 2–3 min in a tissue culture incubator. When adipocytes started to become round and detached from the plate, trypsin was neutralized by adding 1 mL of FBS. Clumps of adipocytes were dislodged using a wide-bore 1-mL pipette tip and filtered using a 70-µm cell strainer. Concentration of adipocyte suspension was adjusted to approximately 200 cells per microliter using FBS for downstream spotting using the cellenONE X1 machine.
Nuclei isolation from preadipocytes and mature adipocytes for snRNA-seq
Nuclei were isolated from white and brown preadipocytes using an NP-40-based lysis buffer (see Supplemental Material). Cells from a 100-mm dish were scraped onto 500 µL of chilled lysis buffer, incubated for 5 min on ice, and washed with ice-cold PBS supplemented with 0.2 U/µL RNase inhibitor (Protector RNase inhibitor; henceforth called wash buffer) four times by centrifuging at 500 rcf for 5 min at 4°C. Nuclei were finally resuspended in the ice-cold wash buffer, filtered using a 40-µm cell strainer, and adjusted for a final concentration of approximately 1000 nuclei per microliter. Nuclei were also stained using 0.08% trypan blue dye to assess nuclear membrane integrity under brightfield imaging. For nuclear isolation at the mature adipocyte stage, the same protocol was implemented as mentioned above with the modification of using 1 mL lysis buffer per 100-mm dish.
scRNA-seq and snRNA-seq library preparation
Sequencing chemistries and metrics for libraries used in our study are listed in Table 1. See Supplemental Methods for more details. Also see Supplemental Note S1 for cell-hashing strategy used for white and brown preadipocytes scRNA-seq data set (Table 1, row 1).
Sequencing chemistries and metric for libraries used in our study
scRNA-seq and snRNA-seq data analysis
All 10x Genomics libraries were mapped and quantified using CellRanger. UMAP visualization for individual libraries was performed using latent space derived from scVI (Lopez et al. 2018) as input. Downstream QC to remove low-quality cells and clusters was performed using Seurat (Butler et al. 2018) in R (R Core Team 2020). Similar steps were performed for analysis of mcSCRB-seq libraries with data processing using zUMIs (Parekh et al. 2018). Vision was used to perform all transcriptional signature analysis. Data integration was performed using scVI-tools (Gayoso et al. 2021) and Seurat (Stuart et al. 2019). For further details, see the Supplemental Material.
RNA smFISH and spot counting analysis
To perform RNA FISH, we followed the protocol of Raj et al. (2008) with minor modifications. We prewashed cells with wash buffer containing 10% formamide and 2× saline-sodium citrate (SSC). We then performed hybridization by adding 1 µL of 6.25 µM probe to 50 µL of hybridization buffer consisting of 10% formamide, 2× SSC, and 10% (w/v) dextran sulfate. The final probe concentration for overnight hybridization was 125 nM. We hybridized the samples overnight in a humidified chamber at 37°C. Following hybridization, we washed the samples twice with wash buffer for 30 min at 37°C. We then washed the samples 2× SSC, antifade buffer. Imaging was performed in antifade buffer supplemented with catalase and glucose oxidase. Quantification of RNA spots per cell was performed using the Find Foci tool (Herbert et al. 2014) in Fiji (see Supplemental Material).
Data access
The sequence data from this study have been submitted to the NCBI database of Genotypes and Phenotypes (dbGaP; http://www.ncbi.nlm.nih.gov/dbgap) under accession number phs002461.v1.p1. The scripts to reproduce the work presented in this study can be found as Supplemental Code.
Competing interest statement
The authors declare no competing interests.
Acknowledgments
This publication was supported by the National Institute of General Medical Sciences of the National Institutes of Health under award number R35GM124916. This publication was also supported by grant number CZF2019-002454 from the Chan Zuckerberg Foundation and grant numbers R01DK102898 and K01DK125608 from the National Institutes of Health. A.S. is a Chan-Zuckerberg Biohub Investigator and a Pew Scholar in the Biomedical Sciences, supported by the Pew Charitable Trusts. A.G. is supported by the University of California at Berkeley Lloyd Fellowship in Bioengineering. We thank Joshua Cantlon from Scienion for lending help with the CellenOne instrument, the Gartner laboratory at University of California at San Francisco for providing us with multi-seq probes, and the Groves laboratory at University of California at Berkeley for access to the smFISH microscope.
Footnotes
-
[Supplemental material is available for this article.]
-
Article published online before print. Article, supplemental material, and publication date are at https://www.genome.org/cgi/doi/10.1101/gr.275509.121.
- Received March 24, 2021.
- Accepted December 10, 2021.
This article is distributed exclusively by Cold Spring Harbor Laboratory Press for the first six months after the full-issue publication date (see https://genome.cshlp.org/site/misc/terms.xhtml). After six months, it is available under a Creative Commons License (Attribution-NonCommercial 4.0 International), as described at http://creativecommons.org/licenses/by-nc/4.0/.


