
Abstract
Thousands of species will be sequenced in the next few years; however, understanding how their genomes work, without an unlimited budget, requires both molecular and novel evolutionary approaches. We developed a sensitive sequence alignment pipeline to identify conserved noncoding sequences (CNSs) in the Andropogoneae tribe (multiple crop species descended from a common ancestor ∼18 million years ago). The Andropogoneae share similar physiology while being tremendously genomically diverse, harboring a broad range of ploidy levels, structural variation, and transposons. These contribute to the potential of Andropogoneae as a powerful system for studying CNSs and are factors we leverage to understand the function of maize CNSs. We found that 86% of CNSs were comprised of annotated features, including introns, UTRs, putative cis-regulatory elements, chromatin loop anchors, noncoding RNA (ncRNA) genes, and several transposable element superfamilies. CNSs were enriched in active regions of DNA replication in the early S phase of the mitotic cell cycle and showed different DNA methylation ratios compared to the genome-wide background. More than half of putative cis-regulatory sequences (identified via other methods) overlapped with CNSs detected in this study. Variants in CNSs were associated with gene expression levels, and CNS absence contributed to loss of gene expression. Furthermore, the evolution of CNSs was associated with the functional diversification of duplicated genes in the context of maize subgenomes. Our results provide a quantitative understanding of the molecular processes governing the evolution of CNSs in maize.
The genomes of a million eukaryote species will likely be sequenced within the next decade (Lewin et al. 2018), but understanding how these genomes work without ENCODE-scale projects and data (The ENCODE Project Consortium 2012) for each species will require that we also use evolutionary approaches to identify key functional regions. In general, noncoding sequences (CNSs) occupy a larger portion of the genome than coding regions. Most genome-wide association hits have been reported to be located in the noncoding regions in, for example, maize and humans, and are enriched in putative gene expression regulatory sequences (Wallace et al. 2014; Zhang and Lupski 2015; Nishizaki and Boyle 2017; Giral et al. 2018). Comparison of noncoding sequences across species can identify regions under purifying selection to reveal functional constraint (Guo and Moose 2003; Vandepoele et al. 2006; Haudry et al. 2013; Finucane et al. 2015; Polychronopoulos et al. 2017; Xiang et al. 2019). However, detection of conserved noncoding sequences in plants is an ongoing challenge (Van de Velde et al. 2016), receiving extensive recent attention in a broad range of species (Inada et al. 2003; Freeling and Subramaniam 2009; Algama et al. 2017; Polychronopoulos et al. 2017; Xie et al. 2018). A genome-wide comparison of features of putative functional elements (Zhang et al. 2012; Rodgers-Melnick et al. 2016; Oka et al. 2017; Wang et al. 2017b; Li et al. 2019; Lu et al. 2019; Ricci et al. 2019; Tu et al. 2020) with CNSs could provide new insight into understudied noncoding fractions of the genome.
Genomes of the grass tribe Andropogoneae provide a valuable and powerful system for the study of conserved sequences. Species of the Andropogoneae tribe have diverged in a relatively short time frame, sharing a common ancestor ∼16–20 million years ago (Vicentini et al. 2008). Andropogoneae species include maize, sorghum, sugarcane, and silvergrass, some of the most productive grain, sugar, and biofuel crops worldwide (Manners 2011; Brosse et al. 2012). Andropogoneae species share the NADP-ME C4 photosynthesis system (Black et al. 1969; Sage and Zhu 2011) and similar development patterns, whereas their genomes are highly diverse with frequent polyploidization (Estep et al. 2014) and extremely active transposable elements (TEs) (Ramachandran et al. 2020). Nevertheless, despite rapid sequence turnover elsewhere in Andropogoneae genomes, functional sequences are expected to be under purifying selection, making the tribe an ideal system in which to identify and understand the role of CNSs.
Results
An atlas of CNSs in the Andropogoneae tribe
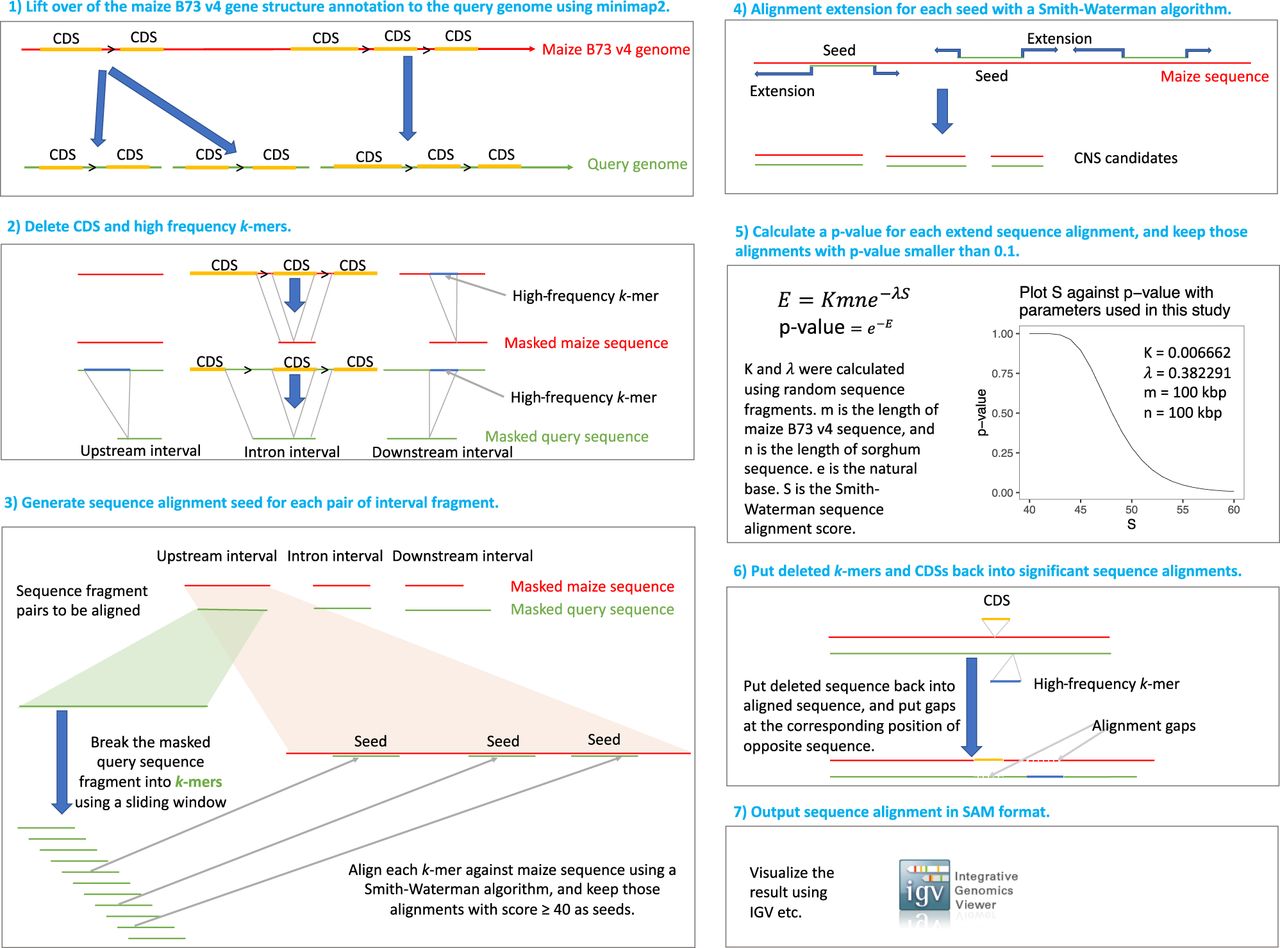
Inspired by recent studies of regulatory architecture (Oka et al. 2017; Lu et al. 2019; Ricci et al. 2019; Parvathaneni et al. 2020; Tu et al. 2020), we used coding genes as anchors and developed a sensitive sequence alignment pipeline to identify CNSs in Andropogoneae genomes which have undergone genome-wide duplications, numerous rearrangements, and gene loss (Fig. 1; Schnable et al. 2011). Andropogoneae genomes (see below) were aligned to the maize B73 v4 assembly (Jiao et al. 2017), which was used as a reference. First, we lifted over maize protein-coding genes to each query genome (Fig. 1, step 1) by mapping coding sequences (CDSs) using minimap2 (Li 2018). Gene copy number often varied between the maize genome and the query genome, so all minimap2 mapping hits with a similarity larger than 60% were used as anchors, where similarity is the number of identical base pairs to the CDS length in maize. All CDSs and high-frequency k-mers were then removed from the genomes (Fig. 1, step 2). Next, introns, sequences of 100 kbp upstream of the translation start codon and sequences of 100 kbp downstream from the translation stop codon were extracted to perform pairwise alignment. The selection of a 100-kbp range was based on previous observations that almost all open chromatin regions and transcription factor binding sites (TFBSs) are located within 100 kbp of the nearest gene (Rodgers-Melnick et al. 2016; Ricci et al. 2019; Tu et al. 2020). Pairwise alignment was conducted following the widely used seed-and-extend process (Altschul et al. 1990; Li and Homer 2010). Briefly, the query sequences were cut into fragments with overlapping sliding windows using a window size of 38 bp and a step size of 8 bp. The Smith-Waterman algorithm (Smith and Waterman 1981) was employed to align the fragment in each window against the reference sequence, and any alignments with an alignment score ≥40 were used as seeds (Fig. 1, step 3). Every seed was then extended, and extension was terminated using the X-drop approach (Fig. 1, step 4; Zhang et al. 1998). Alignments with a dynamic programming score ≥54 were defined as CNSs. This score threshold corresponds to a P-value < 0.1 assuming that a pair of sequences with a length of 100 kbp were aligned (Fig. 1, step 5; Karlin and Altschul 1990). Finally, the removed CDS and k-mer sequences were put back into aligned CNSs (Fig. 1, step 6) and the SAM-format alignments were generated (Fig. 1, step 7; Li et al. 2009).
Procedures to identify CNSs in Andropogoneae. The maize B73 v4 genome was used as reference (red lines), whereas the other five genomes were individually used as a query (green lines). First, full-length CDS of each maize protein-coding gene was mapped to the query genome (CDSs belonging to the same gene are linked with “>” in the cartoon) (1); then we deleted CDSs (orange lines) and high-frequency k-mers (blue lines) (2). Next, upstream, intron, and downstream sequences were pairwise aligned using a dynamic programming algorithm (3–4). Candidate fragments below a P-value threshold (0.1) were defined as CNSs (5–7).
Three publicly available genomes, sorghum (Sorghum bicolor) (McCormick et al. 2018), maiden silvergrass (Miscanthus sinensis) (Zhang et al. 2018), and wild sugarcane (Saccharum spontaneum) (Mitros et al. 2020) were used as queries (see Supplemental Table S1 for more information regarding all the genomes used in this study). In addition, the genomes of two heterozygous Andropogoneae species, Hyparrhenia diplandra and Chrysopogon serrulatus, were assembled to supplement the above-mentioned three genomes (Fig. 2A). Benchmarking Universal Single-Copy Orthologs (BUSCO) completeness scores (Simão et al. 2015) of 0.94 demonstrated that these two newly assembled genomes had high completeness and low sequencing error rates. The median distance between genes and contig edges were 35 kbp and 77 kbp in the genomes of H. diplandra and C. serrulatus, respectively, indicating the contiguity of these two assemblies was suitable for the detection of CNSs within 10 kbp of >85% of coding genes (Supplemental Fig. S1).
Pan-Andropogoneae CNSs. (A) Phylogenetic relationships of Andropogoneae species used in this study. Andropogoneae species are in the green shaded portion of the phylogeny. (B) Simulation of the total length of pan-And-CNSs and core-And-CNSs by iterative random sampling of taxa. Red and blue lines indicate the pan- and core-And-CNS curves fit using points from all combinations.
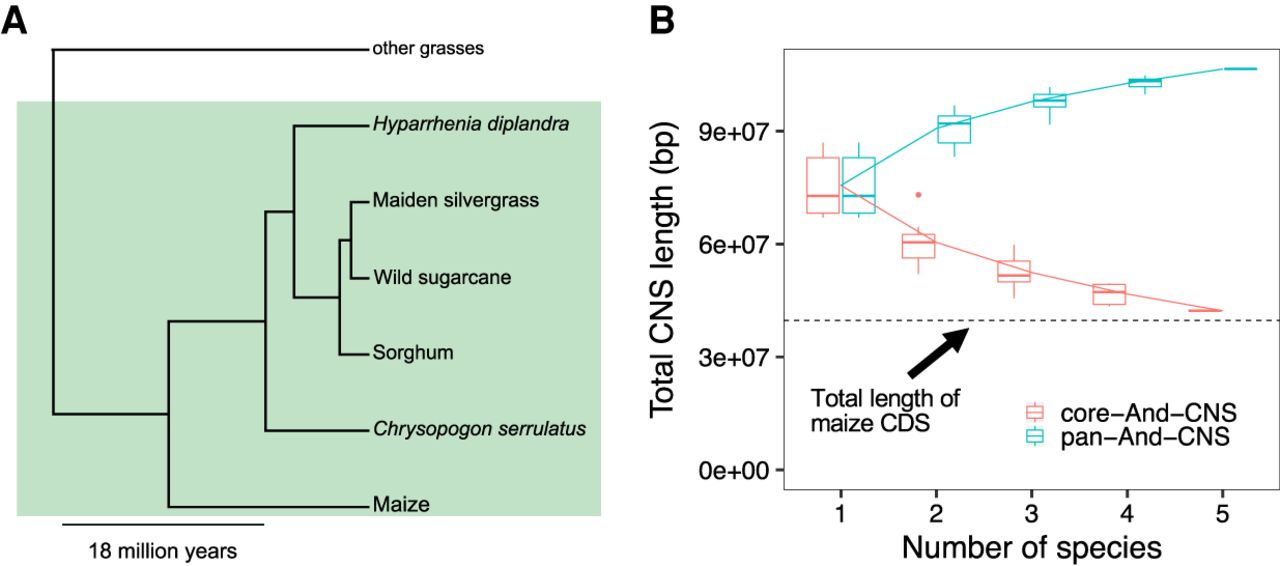
Total CNS length identified using each query genome was positively correlated with the query genome size (Supplemental Fig. S2). The sorghum genome is the only monoploid assembly in our data set that has not experienced a genome-wide duplication event after its divergence from the common ancestor of Andropogoneae (https://doi.org/10.6084/m9.figshare.1538627.v1). Aligning the genome sequence of sorghum against that of maize generated the smallest CNS space (67.07 Mbp, by counting matched base pairs in the maize genome). The largest CNS space was observed by aligning genome sequences between wild sugarcane and maize (86.97 Mbp). The sizes of CNSs ranged from 27 bp to 15 kbp (Supplemental Fig. S3). The total length of CNSs present in maize and at least one other species was 106.52 Mbp, accounting for ∼5% of the maize genome. Hereafter, those CNSs were designated as pan-Andropogoneae CNSs (pan-And-CNSs). A total of 42.27 Mbp CNSs were present in all species and were termed as core-Andropogoneae CNSs (core-And-CNSs). However, more species are needed to better describe pan- and core-And-CNSs (Fig. 2B).
Pan-And-CNSs were enriched with putative cis-regulatory elements (Supplemental Fig. S4) and overlap with 52%–78% of sequences with putative cis-regulatory features (TFBSs, open chromatin regions, acetylation of histone 3 lysine 9 [H3K9ac] ChIP-seq peaks, micrococcal nuclease hypersensitive regions [MNase HS], or DNase I hypersensitive sites [DHSs]) identified in different plant tissues (Supplemental Table S2). We also confirmed that a few known regions were correctly classified as CNSs: the third intron of knox1 (also known as knotted1) (Supplemental Fig. S5; Greene et al. 1994; Lai et al. 2017), vgt1 (Supplemental Fig. S6; Salvi et al. 2007), and tcp (also known as tb1) (Supplemental Fig. S7; Clark et al. 2006; Studer et al. 2011), suggesting the identification of functional noncoding sequences using our approach.
A large proportion of CNSs overlap with putative regulatory elements
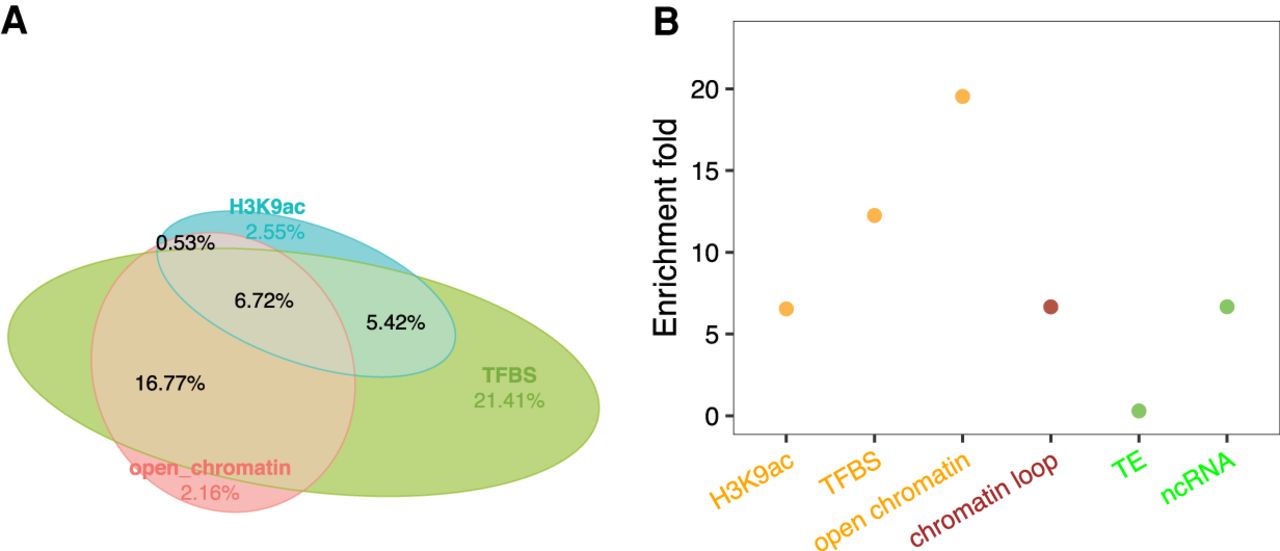
A large proportion (86.8%) of genes have pan-And-CNSs detected within 2 kbp upstream. When compared with genes without pan-And-CNSs detected within 2 kbp upstream, genes with CNSs have higher expression levels and less tissue expression specificity (Yanai et al. 2005; Kadota et al. 2006) across 23 maize B73 tissues (Supplemental Fig. S8; Walley et al. 2016). Fifty-one percent of the pan-And-CNSs overlap with the untranslated region (UTR) or intron of coding genes (herein genic CNS, otherwise intergenic CNS) (Supplemental Fig. S9); this proportion is comparable to that of Arabidopsis thaliana (Haudry et al. 2013). Because introns and UTRs have a wide range of conserved functional roles (e.g., to promote gene expression, guide splicing, produce noncoding RNA) (Greene et al. 1994; Akua et al. 2010; Chorev and Carmel 2012; Ritchie and Flicek 2014; Rigau et al. 2019), we did not classify genic CNSs further by potential function. The overlap between intergenic pan-And-CNSs and low DNA methylation loci (Xu et al. 2020) was higher than the genome-wide random expectation (Supplemental Fig. S10). Fifty-six percent of intergenic pan-And-CNS records overlap with open chromatin regions, TFBSs, or H3K9ac ChIP-seq peaks (Fig. 3A), a 6.5- to 19.5-fold enrichment relative to random expectation (Fig. 3B). Compared to a previously released list of conserved elements in the maize intergenic region (Tian et al. 2020), we generated a larger data set and our intergenic CNSs have greater overlap with open chromatin regions, TFBSs, and H3K9ac ChIP-seq peaks (Supplemental Fig. S11).
CNSs are primarily putative regulatory sequences. (A) Proportions of intergenic pan-And-CNSs overlapping with features of putative cis-regulatory sequence. (B) Enrichment of intergenic pan-And-CNSs in open chromatin regions, TFBSs (transcription factor binding sites), H3K9ac (acetylation of histone 3 lysine 9) ChIP-seq peaks, chromatin loop anchors, TEs (transposable elements), and noncoding RNA (ncRNA) genes.
To further uncover the function of intergenic pan-And-CNSs, we analyzed colocalization of intergenic pan-And-CNSs with chromatin loop anchors, TEs, and noncoding RNA (ncRNA) genes. We started with chromatin loop anchors because they were inferred to be conserved and their dynamics are associated with transcription activity (Dong et al. 2017, 2018, 2020; Harmston et al. 2017; Liu et al. 2017; Polychronopoulos et al. 2017; Wang et al. 2018; Delaneau et al. 2019; Szabo et al. 2019). Chromatin loop anchors identified by Hi-C and HiChIP (Peng et al. 2019; Ricci et al. 2019) overlapped with 47% of intergenic pan-And-CNS records, with an enrichment of 6.6-fold compared to the genome-wide background (Fig. 3B). In addition to open chromatin regions, TFBSs, and H3K9ac ChIP-seq peaks, chromatin loop anchors overlapped with an additional 12% intergenic pan-And-CNS records (Supplemental Fig. S12). Regulatory elements derived from TEs have been described by several independent studies (Xie et al. 2006; Smith et al. 2008; Dupeyron et al. 2019), and cases of TEs acting as regulatory sequence have been reported (Xie et al. 2006; Smith et al. 2008; Studer et al. 2011; Makarevitch et al. 2015; Zhao et al. 2018; Dupeyron et al. 2019; Noshay et al. 2020). Enrichment of CNSs overlapping TEs was not observed (Fig. 3B), but when looking at particular TE superfamilies (Stitzer et al. 2019), 1.08- to 1.78-fold enrichments of intergenic pan-And-CNSs were observed in four of the 13 TE superfamilies (RIL, RST, DHH, and DTM) (Supplemental Fig. S13). However, these four TE superfamilies only accounted for another 2.09% of intergenic pan-And-CNSs. Finally, enrichment of CNSs in ncRNA genes (Han et al. 2019) was also observed (Fig. 3B), which accounted for only 1.04% of the total intergenic pan-And-CNSs.
CNSs have diverse functions
Due to the tissue-specific activity of some cis-regulators, a full data set of putative cis-regulatory sequences has not been generated until the present study. It is essential to know if CNSs that do not overlap with features of cis-regulatory elements might have alternative functions. We therefore classified intergenic CNSs into the following groups: (1) CNSs overlapping with open chromatin, TFBS, or H3K9ac ChIP-seq peaks (cis CNS); (2) CNSs overlapping with chromatin loop anchors not part of the group cis (non-cis loop CNS); and (3) remaining CNSs not included in (1) and (2) (rest CNS). We then investigated the DNA methylation ratio, guanine-cytosine (GC) content, and DNA replication activity in the early S phase of the mitotic cell cycle in each CNS group. Different DNA methylation ratios, GC content, and DNA replication activity in the early S phase were obtained for these CNS groups, indicating these CNSs may have a diversity of functions.
In terms of DNA methylation, the cis pan-And-CNSs showed a low DNA methylation ratio, which supports the previous observation that putative cis-regulatory sequences correspond to a low DNA methylation ratio in plants (Zhang et al. 2006, 2012; Zilberman et al. 2007; Suzuki and Bird 2008; Rodgers-Melnick et al. 2016; Oka et al. 2017; Ricci et al. 2019). The non-cis loop pan-And-CNSs exhibited a medium DNA methylation ratio (Fig. 4A) and could be divided into two distinct subgroups according to DNA methylation ratios (Supplemental Fig. S14). This might be due to different functions of CNSs between these two subgroups; alternatively, some may actually be cis CNSs with tissue specificity but were incorrectly classified into the non-cis loop pan-And-CNS group. DNA methylation is associated with GC content (Mugal et al. 2015) and GC content is associated with chromatin accessibility (Parker et al. 2008; Schwartz et al. 2019; Hammelman et al. 2020). Compared to the genome-wide background, the cis pan-And-CNSs showed a higher GC content, whereas non-cis loop pan-And-CNSs exhibited a lower GC content. This is again suggestive of diverse functions across cis pan-And-CNSs and non-cis loop pan-And-CNSs. The GC content of the rest of the pan-And-CNSs was similar to that of the genome-wide background (Fig. 4B). Active regions of DNA replication in the early S phase (Wear et al. 2017) were associated with both cis pan-And-CNSs and non-cis loop pan-And-CNSs. The activity of the rest pan-And-CNSs was higher than that of the genome-wide background but lower than that of cis pan-And-CNSs and non-cis loop pan-And-CNSs (Fig. 4C; Supplemental Fig. S15).
Patterns of DNA methylation and GC content in CNSs suggest diverse functions. (A) Different DNA methylation ratios among pan-And-CNS groups. Red dots correspond to CG DNA methylation, green dots are CHG DNA methylation, and blue dots represent CHH DNA methylation (where “H” indicates A, C, or T). “other genome regions” on the horizontal axis represents DNA methylation sites located in the intergenic regions that were not defined as CNSs, and “protein-coding genes” denotes DNA methylation sites located within CDSs, introns, or UTR regions of coding genes. (B) Different groups of pan-And-CNSs (indicated in orange, brown, and green) have distinct GC content when compared with CDSs (blue) or the genome-wide (red). (C) Overlap of CDS regions, cis, non-cis loop, and rest pan-And-CNSs with active regions of DNA replication in the early S phase of the mitotic cell cycle. Sequences that did not overlap with coding genes or CNSs were used as background (intergenic). (D) The proportion of pan-And-CNSs overlapping with annotated features. Each CNS can overlap with multiple features. Unknown CNSs are those CNSs that do not overlap with any used features.
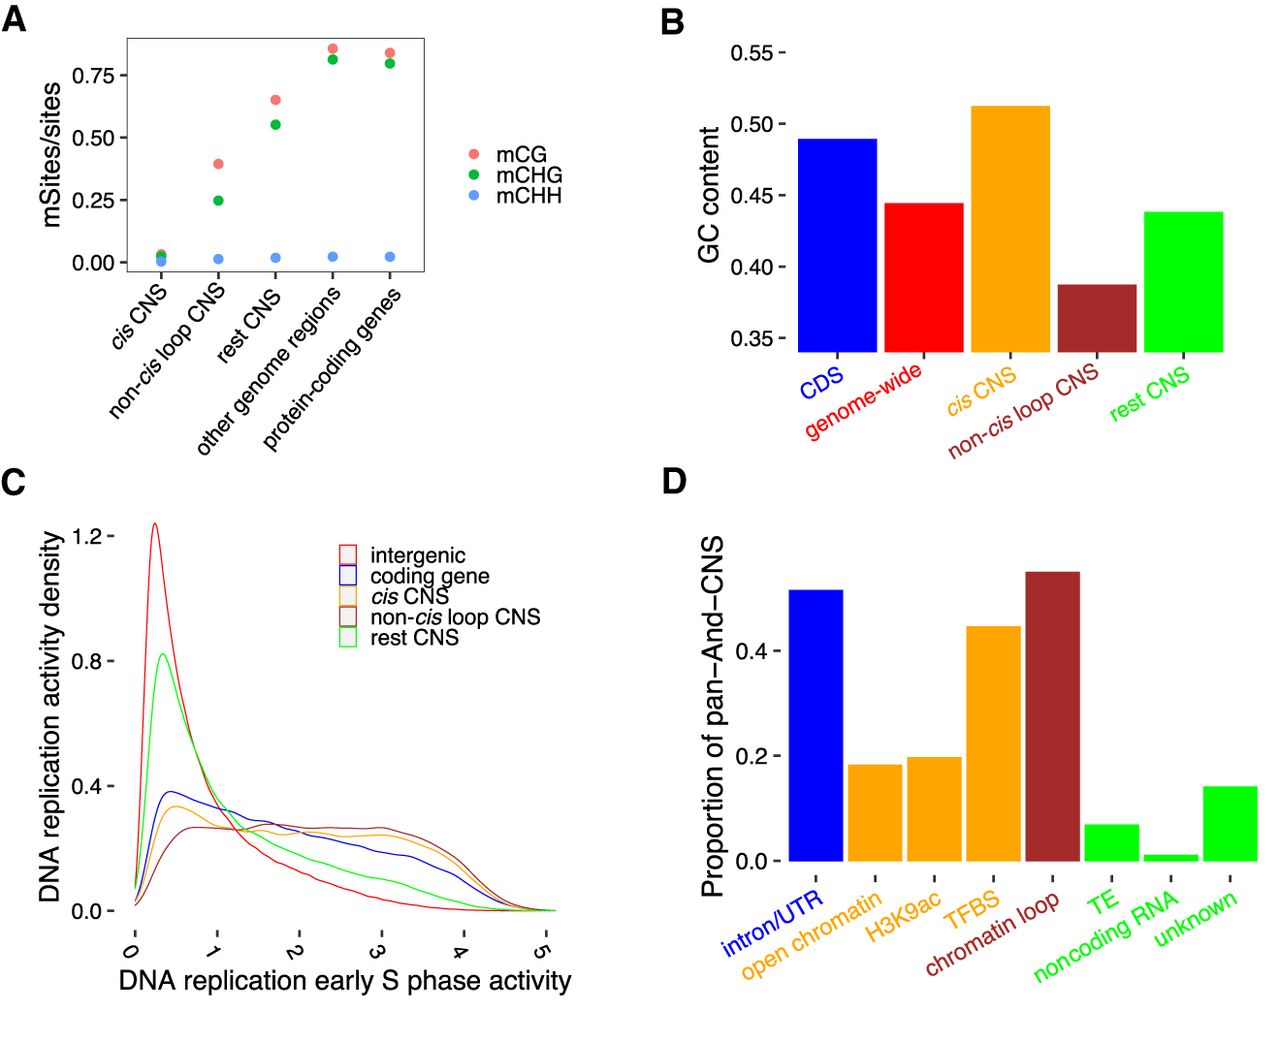
Overall, 14% of pan-And-CNS records did not fall in any putative features (i.e., open chromatin regions, TFBSs, introns, UTRs, noncoding RNA genes, chromatin loop anchors, H3K9ac ChIP-seq peaks, and TEs) (Fig. 4D; Supplemental Fig. S16). These CNSs were shorter and had lower alignment scores (Supplemental Fig. S17) than the 86% that could be assigned to a feature and may be enriched for false positives. These unannotated pan-And-CNSs might also be tissue-specific regulators. A more comprehensive investigation of functional noncoding features in different tissues may provide a better understanding of CNS functions.
Variants in CNSs impact gene expression
We further investigated the CNS function by testing if genotypic variants within the identified CNS affected maize gene expression. Using the expression quantitative trait loci (eQTLs) identified by Kremling et al. (2018), the intergenic pan-And-CNSs were enriched 4.02-fold among the “lead” eQTLs compared to the genome-wide background. We selected the lead eQTL as the one with the strongest association (lowest P-value) with the expression of its target gene. The pan-And-CNS regions harbored a larger proportion of maize HapMap3 variants (Bukowski et al. 2018) with low minor allele frequency (MAF) when compared to intergenic regions (Fig. 5A). This result suggests that variants in the CNS regions are under stronger purifying selection compared to those in the intergenic regions, likely because variants in CNSs could negatively impact functional elements.
Variants in CNS regions impact gene expression. (A) MAF distribution of HapMap3 variants in CNS regions, genome-wide CDS regions, and genome-wide intergenic regions. (B) MAF distribution of CNS PAVs in genic, cis, non-cis loop, and rest CNS groups. (C) Comparison of the proportion of maintained CNSs in the 2-kbp upstream regions of the top 1500 expressed genes in root tissues in each maize accession. Dotted lines indicate the 99% one-tailed confidence interval calculated by shuffling the gene expression ranks and CNS maintained proportions 1000 times. Red dots are beyond the 99% one-tailed intervals. Similar patterns were observed across different tissues (Supplemental Fig. S18). (D) Histogram of the distance between CNS PAVs and associated genes for root expression data when a PAV and its associated genes are on the same chromosome. The vertical dotted line indicates a distance of 2.5 Mbp.
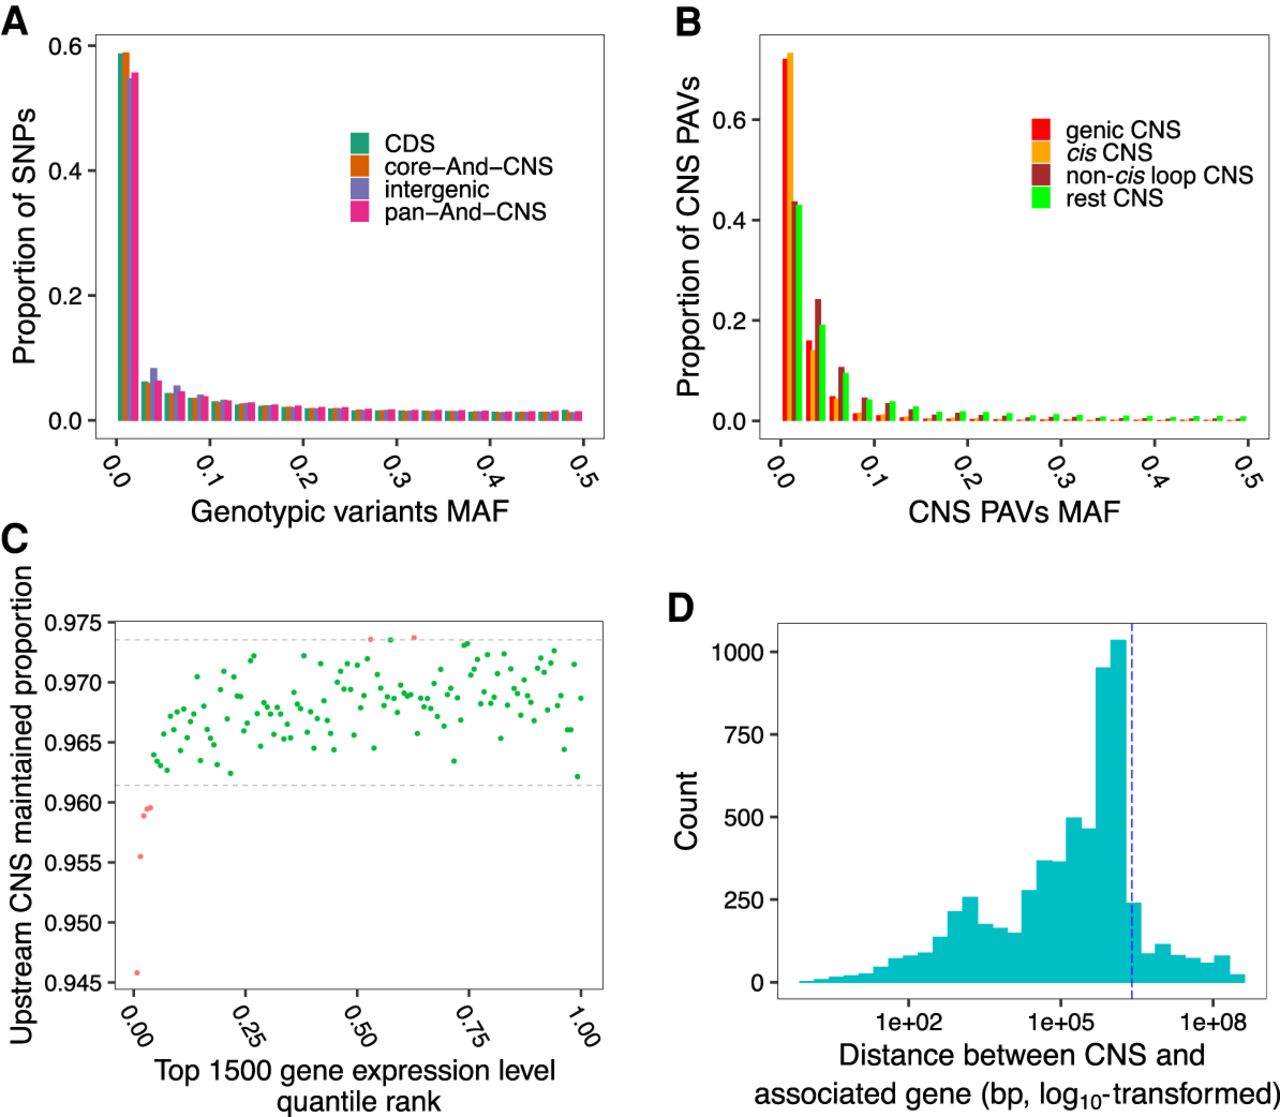
We identified CNS presence/absence variants (PAVs) using the maize HapMap3 second-generation sequencing reads (Bukowski et al. 2018) and CNSs identified using the sorghum genome as the query. Most CNS PAVs were rare (MAF < 0.1), especially genic CNSs and cis CNSs (Fig. 5B). Previous studies suggested that noncoding rare variants contribute to the dysregulation of nearby downstream genes and are negatively associated with organism fitness (Flint-Garcia et al. 2005; Kremling et al. 2018). By analyzing the CNS absence within the 2-kbp upstream region of a gene and its expression, we observed loss of CNSs was associated with loss of gene expression (Fig. 5C). However, further upstream, the association between loss of CNSs and loss of gene expression was much weaker (Supplemental Fig. S18); beyond 2 kbp, the regulatory activity of CNSs on downstream genes likely diminishes. To further test the impact of CNS PAVs on gene expression, we used gene expression profiles of seven tissues from a modern inbred population (Kremling et al. 2018) along with the CNS PAVs with MAF ≥ 0.1 to perform an expression genome-wide association study (Supplemental Fig. S19). The result showed that more than half of significant CNS PAVs were located within 2.5 Mbp of associated genes (Fig. 5D; Supplemental Fig. S20).
Finally, we investigated the evolution of CNSs in maize during domestication and subsequent local adaptation. We identified regions likely selected during domestication using genome-wide selective sweeps using RaiSD (Alachiotis and Pavlidis 2018) in a panel of 31 maize landraces (Wang et al. 2017a) and regions important for local adaptation in maize using pcadapt (Luu et al. 2017). The overlap between these regions and pan-And-CNS was substantially less than would be expected by chance, suggesting recent selection in maize has mainly favored variants that do not modify these constrained functional regions (Supplemental Fig. S21).
CNS variation is associated with functional diversity between maize subgenomes
To further study the effect of CNS variation on gene expression, we took advantage of the genome-wide duplication event that occurred in maize after divergence from sorghum (Swigonová et al. 2004) to investigate CNS variation between the two maize subgenomes. Syntenic homologous genes between genomes of maize and sorghum were identified using the quota-alignment implementation (Tang et al. 2011) with parameters that keep every two maize genes corresponding to one sorghum gene (‐‐quota) (see Methods). First, for each orthogroup (including two maize genes and one sorghum gene), the total CNS length within the 2-kbp upstream region of a gene was recorded if this CNS site was present within the 2-kbp region of the sorghum homologous gene and at least one maize homologous gene copy (Supplemental Fig. S22). Second, the proportion of shared CNS sites was calculated as the number of CNS sites present in both maize gene copies to that of the total CNS length. Third, the expression similarity between two maize gene copies was calculated using Pearson's correlation of their expression levels across 23 tissues of maize B73 (Walley et al. 2016). Then, a correlation analysis of the proportion of shared CNS sites and expression similarity was conducted. The proportion of CNS sites shared between the two paralogous genes was positively correlated with the expression similarity between them (r2= 0.10, P-value < 2.2 × 10⁻¹⁶, Pearson's correlation) (Fig. 6A; Supplemental Fig. S23). Moreover, maize paralogs with negatively correlated expression patterns shared a significantly smaller proportion of CNS sites than positively correlated paralogs (P-value < 2 × 10⁻¹⁶, Wilcoxon rank-sum test) (Fig. 6B). Here, we defined the gene copy with a longer CNS (within 2-kbp upstream region) as the major copy and the gene with a shorter CNS as the minor copy. In the context of maize subgenomes, for each pair of maize syntenic paralogous genes with negative expression correlation, in addition to spatiotemporal expression patterns, we also observed a higher nonsynonymous to synonymous mutations ratio for the minor CNS approximation gene (Supplemental Fig. S24), which may indicate neofunctionalization or pseudogenization. The size difference between the major and minor CNSs was smaller in positively correlated paralog pairs than in negatively correlated paralog pairs (P-value = 5 × 10⁻¹⁰, Wilcoxon rank-sum test) (Fig. 6C).
CNS variation is associated with expression diversity between paralogous genes in maize. (A) Correlation of CNS similarity and expression similarity of paralogous gene pairs. Red dots indicate negatively correlated genes; blue dots indicate positively correlated genes across tissues. (B) The shared proportion of CNS sites for negatively (red) and positively (blue) correlated paralogous gene pairs. (C) The diversity of CNS maintained by the maize major copy and minor copy for negatively (red) and positively (blue) correlated gene pairs. (D) Correlation of expression levels of the maize major copy genes with their sorghum homologous genes (red) and minor copy genes with their sorghum homologous genes (green) in shoots for genes with negatively correlated expression patterns across maize tissues in panel A.
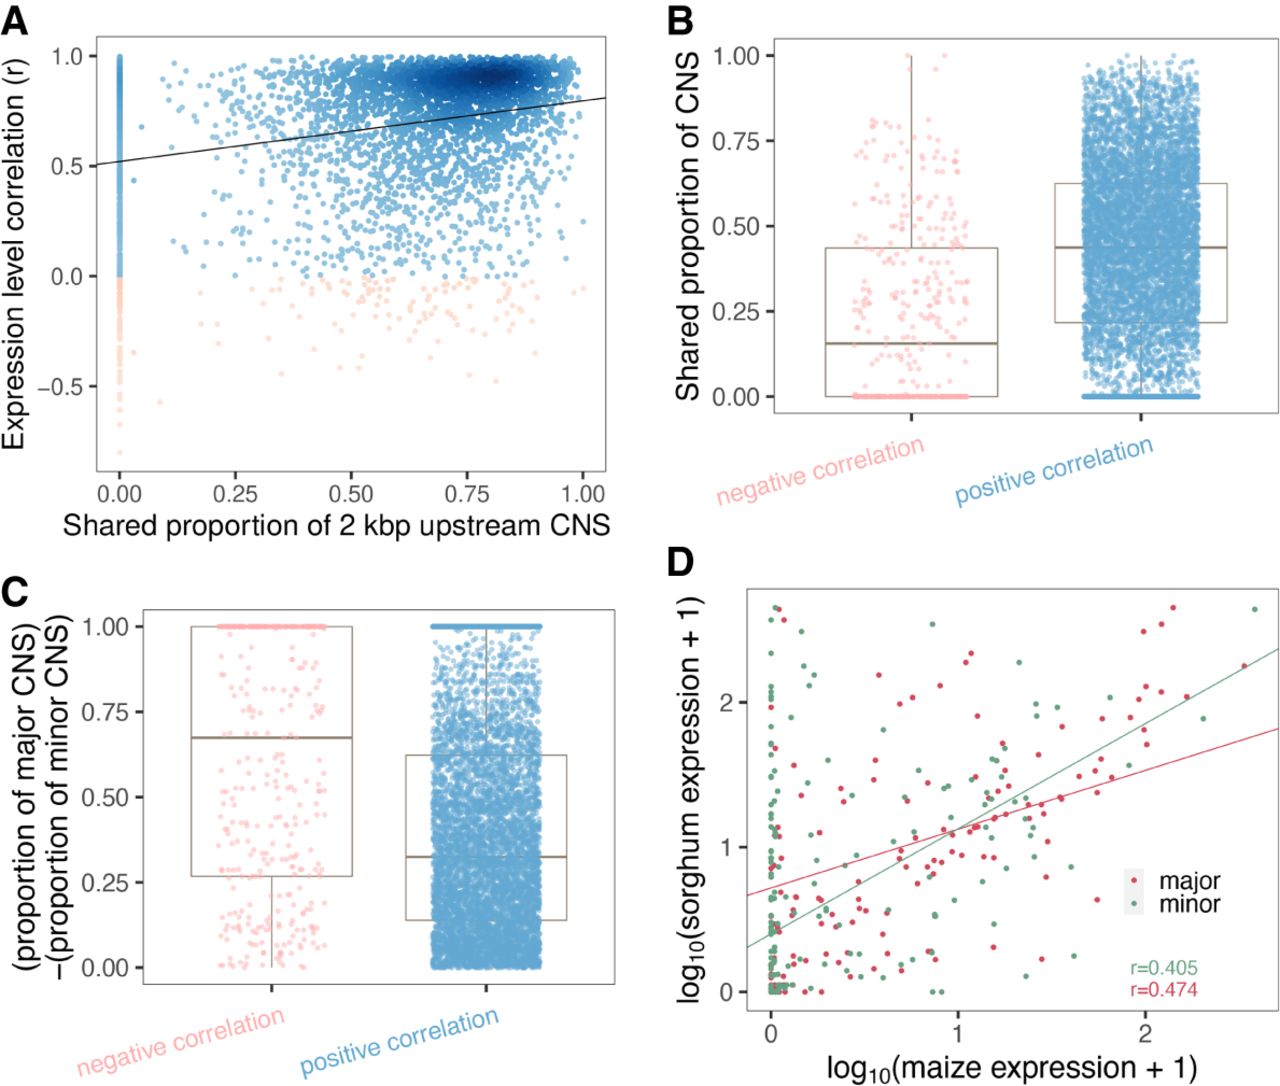
In addition, for those negatively correlated paralog pairs, we examined the correlation between the expression of maize genes and their sorghum homologs in the shoot tissues. The normalized shoot RNA-seq data of B73 (maize) (Kremling et al. 2018) and sorghum (NCBI BioProject [https://www.ncbi.nlm.nih.gov/bioproject/] accession number PRJNA503076) were retrieved from Washburn et al. (2019). We observed a higher correlation between the expression levels of maize major copies and the homologous sorghum genes than between maize minor copies and the homologous sorghum genes in the shoot (Fig. 6D). Overall, these results suggest that CNS variation is associated with expression and functional diversity between duplicated genes.
Discussion
Despite the challenges of working on genomes with vast numbers of transposons and frequent duplications, a novel sensitive alignment approach shows that noncoding regions under purifying selection can be identified by comparing genomes of related species. In our CNS identification pipeline, the aim of using coding genes as anchors is to narrow down the sequence alignment scope and reduce false positives. There are some scenarios where our pipeline will fail to identify the target gene. The nearest gene of a regulatory element is not necessarily its target, and the distance between a regulatory element and its target genes might be longer than 100 kbp. In addition, the proximity of a functional noncoding sequence and its target gene may be impacted by large insertions or chromosomal rearrangements. Previous studies suggested that the total number of predicted TFBSs is much smaller than that of transcription factor (TF) recognition sites. TFs often work cooperatively and the sequence contexts of TF recognition sites or combinatorial recognition of cis-elements are key for TF binding specificity (Gerstein et al. 2012; Dror et al. 2015; Levo et al. 2015; O'Malley et al. 2016; Tu et al. 2020; Avsec et al. 2021). CNS records identified in this study are much longer than a single TF recognition site, suggesting the possibility of recognition of ordered combinations of nonoverlapping TFBSs (Viturawong et al. 2013; Shen et al. 2020). CNSs identified using our approach were highly enriched in TFBSs, open chromatin regions, H3K9ac ChIP-seq peaks, chromatin loop anchors, and eQTLs.
Using the genome sequences of six Andropogoneae species, we were able to identify a set of core-And-CNSs and pan-And-CNSs. Core-And-CNSs and pan-And-CNSs showed similar enrichment in potential regulatory sequences, suggesting that not all functional noncoding elements are conserved across all the species. The presence/absence of those elements may be related to species-specific traits (Khalturin et al. 2008; Won et al. 2019). As expected based on the role of core-And-CNS in more essential functions (Cvijović et al. 2018) and the likelihood of mutations in these regions carrying a higher deleterious burden (Kistler et al. 2018), we observed a larger number of variants with low MAF in core-And-CNS regions than in pan-And-CNS regions in a maize population (Fig. 5A), indicating stronger purifying selection.
The overlap between CNSs and features of putative cis-regulatory sequences has been reported previously (Haudry et al. 2013; Viturawong et al. 2013; Warnefors et al. 2016; Lai et al. 2017; Oka et al. 2017; Lu et al. 2019; Ricci et al. 2019), although not all cis-regulatory sequences are evolutionarily conserved (Ross et al. 1994; Wittkopp et al. 2002; McLean et al. 2011). We observed enrichment of lead eQTLs in CNS regions and association between CNS absence and gene expression (Fig. 5C,D). In terms of the regulation of CNSs on target genes, we were able to show that upstream 2 kbp CNS absence was strongly correlated with loss of expression, both in the context of natural variation segregating within a maize population and between duplicated genes in the maize subgenomes. Our results indicate that a longer conserved region proximal to a maize gene correlates with higher expression and similarity of its orthologous gene in sorghum (Fig. 6D), suggesting pseudogenization or neofunctionalization of the gene copy with a shorter CNS. In summary, our study shows that a meta-analysis using CNSs, and gene expression levels combined with open chromatin regions, TFBSs, chromatin loop anchors, and low DNA methylation loci can provide a more comprehensive view of the molecular mechanisms underlying the regulation of gene expression.
Analysis of the identified CNSs extended our knowledge of CNS function. Around half of the identified intergenic CNSs overlapped with different groups of putative cis-regulatory features (e.g., open chromatin regions, TFBSs, and H3K9ac ChIP-seq peaks). Chromatin looping is important for gene regulation (Kadauke and Blobel 2009), and subtle changes in chromatin loop anchors are associated with differential gene regulation and expression (Greenwald et al. 2019; Diehl et al. 2020). GC content and DNA methylation ratio might influence DNA stiffness/flexibility and has been reported to be correlated with DNA supercoiling and recombination (Naughton et al. 2013; Rodgers-Melnick et al. 2015; Jabbari et al. 2019). In this study, we also observed distinguishable GC content and DNA methylation ratios between cis CNSs and non-cis loop CNSs, suggesting diverse functions between these two types of CNSs. ncRNAs can interact with DNAs, RNAs, and proteins, and have been implicated in the regulation of gene transcription and translation, as well as in response to stresses and stimuli (Yoon et al. 2013; Chen and Aravin 2015; Han et al. 2019; Yao et al. 2019; Statello et al. 2021). The enrichment of CNSs in ncRNA genes indicates sequence conservation of transcribed but untranslated DNA sequences. The enrichment of CNSs in active regions of DNA replication in the early S phase suggests that regions of DNA replication initialization might be evolutionarily conserved. CNS knockout lines should be generated to gain a comprehensive understanding of their function (Gasperini et al. 2020). Taking advantage of the observation of GC content and DNA methylation pattern across different groups of CNSs, a model to classify CNSs into different functional groups might be useful to provide a guide for the verification of CNS functions via molecular approaches.
Methods
Plant materials collection
Hyparrhenia diplandra was collected in Kenya by Rémy Pasquet (Pasquet 1126) and Chrysopogon serrulatus was obtained from the USDA Germplasm Repository Information Network (PI 219580; seed originally from Pakistan). Both plants were grown in the greenhouse at the Donald Danforth Plant Science Center. Vouchers of flowering specimens were deposited at the herbarium of the Missouri Botanical Garden; full specimen data are available through the Tropicos database (https://www.tropicos.org).
DNA preparation and sequencing
Total DNA was extracted from young leaf tissues. Long-read sequencing was conducted on a Nanopore MinION platform at the Institute of Biotechnology, Cornell University. DNA with a size of 20–80 kbp was selected following the Blue Pippin protocol, and the selected DNA were cleaned using AMPure XP beads. DNA repair and end-prep were performed with NEB enzyme kits. After adapter ligation, MinKNOW software was used for quality control of the MinION sequencing library. Sequencing was performed following the manufacturer's instructions.
A total of 1.0 μg of DNA per sample was used as input material to generate second-generation sequencing reads. Sequencing libraries were conducted using the NEBNext DNA Library Prep kit following the manufacturer's recommendations, and barcodes were added to each sample. Genomic DNA was randomly fragmented to a size of 350 bp. Then, DNA fragments were end-polished, A-tailed, and ligated with the NEBNext adapter for Illumina sequencing, and further PCR-enriched by P5 and indexed P7 oligos. PCR products were purified (AMPure XP system) and the resulting libraries were analyzed for size distribution by an Agilent 2100 Bioanalyzer and quantified using real-time PCR. The qualified libraries were fed into Illumina NovaSeq sequencers after pooling according to their effective concentration and expected data volume.
Genome assembly
We used the NanoPlot (De Coster et al. 2018) and Porechop package (https://github.com/rrwick/Porechop) to respectively check and filter the MinION raw reads. The MinION clean reads were then assembled using Flye v1.4.2 (Kolmogorov et al. 2019) with the genome size estimated via flow cytometry (Supplemental Fig. S1F) as reference. The MinION clean reads were mapped to the assembly using minimap2 (Li 2018) with a setting of “-x map-ont”, and racon v1.3.1 (Vaser et al. 2017) was used to polish the assembly with default parameters. Assembly polishing using MinION reads was repeated three times. The MEM module of BWA v0.7.17 (Li and Durbin 2009) was used to map Illumina reads to the MinION polished assembly with parameters “-k11 -r10”. The “markdup” command implemented in SAMtools v1.09 (Li et al. 2009) was used to remove duplicated Illumina reads. Pilon v1.23 (Walker et al. 2014) with parameter “‐‐diploid ‐‐fix bases” was used for error correction (Supplemental Fig. S1A). Assembly correction using Illumina reads was repeated three times.
Genome assembly evaluation
To evaluate the contiguities of our new assemblies, we identified 5592 Benchmarking Andropogoneae Single-Copy Orthologs (BASCO) genes shared by four Andropogoneae genomes, maize (Zea mays), sorghum (Sorghum bicolor), maiden silvergrass (Miscanthus sinensis), and wild sugarcane (Saccharum spontaneum), as well as an outgroup species, foxtail millet (Setaria italica). The URLs to access these genomes are listed in Supplemental Table S1.
The following procedures were conducted to identify the BASCO genes:
Syntenic genes: CDSs of the B73 genome (v4.34) were first aligned against the sequences of sorghum, wild sugarcane, maiden silvergrass, and foxtail millet using BLASTN (Altschul et al. 1990) with parameters “-outfmt 6 -strand plus -task blastn -evalue 5 -word_size 7 -max_target_seqs 1000”. Next, the quota-alignment pipeline (Tang et al. 2011) was used to detect syntenic genes using parameters “‐‐tandem_Nmax = 5 ‐‐cscore = 0.2 ‐‐no_strip_names ‐‐filter_repeats” for blast_to_raw.py. The parameters of quota_align.py were set as “‐‐merge ‐‐Dm = 20 ‐‐min_size = 3”. In addition, for specific species, the “‐‐quota” parameter was set as “2:2” for maiden silvergrass, “1:2” for foxtail millet, “1:2” for sorghum, and “4:2” for wild sugarcane according to their different genome assembly ploidy or genome-wide duplication levels. Overall, 25,155 maize genes were found in at least one syntenic region.
Orthogroups: OrthoFinder (Emms and Kelly 2019) with parameter “-S blast -M msa” was used to find orthogroups. Only those orthogroups with 1–2 maize genes, 1 sorghum gene, 1–2 maiden silvergrass genes, 1–4 wild sugarcane genes, and 1 foxtail millet gene were kept. The CDS of each transcript in the selected orthogroups was mapped to the corresponding genome sequence using minimap2 with parameters “-ax splice -a -uf -C1 ‐‐cs”. Any transcripts with a higher than expected number of hits were removed.
Intersect syntenic genes and orthogroups: Orthogroups with at least one syntenic maize gene were kept, otherwise dropped.
Double check gene copy numbers: Similar to step 2; CDSs of the genes that passed the previous filter were mapped to the five genomes using minimap2 and filtered by the number of hits within each genome. Orthogroups that passed this last check were defined as BASCO.
n1 = start position of mapped CDS
n2 = contig length – end position of mapped CDSs
minimum extent of flanking regions = minimum (n1, n2)
BUSCO v3.1.0 with parameters “-m geno -sp maize -f -r -l” and the liliopsida_odb10 database were used to evaluate the completeness of the assemblies.
Parameter optimization for identification of CNSs
The pipeline started by finding anchor points using minimap2 (Li 2018) with parameters “-x splice -a -uf -C 1 -k 12 -P ‐‐cs”. Keeping in mind the high diversity of the Andropogoneae noncoding regions, for the following alignment steps we used a match score “2”, mis-match “−3”, gap opening penalty “−4”, and gap extension penalty “−2”. For step 3 (Fig. 1), we kept alignments with a minimum Smith-Waterman score of 40 as seeds, thus the minimum seed length was 20 bp (minimum seed score/match score). A sliding window size of 38 bp was selected to ensure there was only one seed in each window. To reduce the computational time and minimize the number of missing seeds, the sliding step size was set as 8.
To identify high-frequency k-mers, we counted the frequency of 20-mers (minimum seed length) using KAT v2.4.2 (Mapleson et al. 2017). For each genome, the secondary derivative of the k-mer frequency density distribution was calculated and the point with minimum distance to zero was identified. The k-mer frequency at that point was used as a threshold to define and remove high-frequency k-mers.
To find the alignment score that corresponds to a P-value <0.1, we randomly extracted 10,000 fragments with a length of 1000 bp from the unmasked reference genome and query genomes separately. A total of 10,000 maximum Smith-Waterman scores were calculated by aligning those fragments, and results were fit into a nonlinear least square regression. The final k (0.006662) and λ (0.382291) values were determined by using maize as the reference against sequences extracted from the other five species randomly. Based on those k and λ values, alignments with a Smith-Waterman score of 54 or higher were kept.
Overlap and enrichment analysis
The output SAM files were reformatted into BAM files using SAMtools, and the “depth” command of SAMtools was used to check how many unique base pairs were classified as conserved. We counted how many unique CNS base pairs overlapped with open chromatin regions (Ricci et al. 2019; Tu et al. 2020). Then, enrichment values were calculated as
The overlap and enrichment values for TFBSs (Tu et al. 2020), H3K9ac ChIP-seq peaks (Oka et al. 2017), chromatin loop anchors (Peng et al. 2019; Ricci et al. 2019), TEs (Stitzer et al. 2019), ncRNA genes (Jiao et al. 2017; Han et al. 2019), genome-wide DNA methylation (Ricci et al. 2019), DNA replication profiles (Wear et al. 2017), and lead eQTLs (Kremling et al. 2018) were calculated in the same way.
The above-mentioned features were obtained from the original publications without further processing. For the data sets using the B73 v3 genome assembly coordinates, CrossMap v0.2.8 (Zhao et al. 2014) and the chain file released from Ensembl (Howe et al. 2020) were used to uplift to the maize B73 v4 genome assembly coordinates.
CNSs and other features were considered overlapping if they shared ≥1 bp.
Comparison of gene expression for genes with and without CNS within 2 kbp upstream
A total of 28,950 gene IDs from the expression matrix from 23 maize tissues (Walley et al. 2016) were uniquely lifted from the maize B73 v3 to the v4 genome annotation using the table released by MaizeGDB (gene_model_xref_v4.txt, https://www.maizegdb.org/search/gene/download_gene_xrefs.php?relative=v4, downloaded on April 22, 2019, also available at https://github.com/baoxingsong/dCNS/blob/master/data/gene_model_xref_v4.txt) (Lawrence et al. 2004). Among those genes, 25,127 have upstream CNSs detected within a 2-kbp range. The tissue specificity of gene expression was measured using τ (Yanai et al. 2005) and entropy (Kadota et al. 2006).
CNS PAVs in a maize population
For each accession in the maize Goodman panel (Flint-Garcia et al. 2005), paired-end Illumina reads (NCBI BioProject PRJNA389800) (Bukowski et al. 2018) were mapped to the maize B73 v4 reference genome using BWA-MEM v0.7.13 (Li and Durbin 2009) with default parameters. To save computational time, we used GATK v3.8 (McKenna et al. 2010) to classify each base pair as “callable” or “noncallable.” For the “noncallable” base pairs, coverage was checked using the “samtools mpileup” command. Some CNS regions were shorter than the reads and only a single end of the paired-end reads fell into the conserved region. Therefore, we also mapped the reads to the CNS fragments using BWA-MEM with parameters “-a -c 200000 -S -P” and calculated the coverage of the CNS fragments using “samtools mpileup”. A base pair of a CNS fragment was classified as “present” if it was “callable,” if it had coverage from reads mapping to the genome-wide, or if it had coverage from reads mapping to the CNS fragment; otherwise, it was classified as “absent.” Maize accessions with low sequencing coverage (≤14 Gbp of reads) were excluded from the analysis, as there was not enough information to accurately conduct calling (Supplemental Fig. S25).
Association analysis using CNS PAVs as independent variables
To define CNS PAVs variables, the number of present base pairs/CNS length was calculated for each CNS in each maize accession. If the ratio was ≥0.8, it was encoded as 1; if the ratio was ≤0.2, it was encoded as 0; otherwise unknown. To associate CNS PAVs with gene expression, we used CNS PAVs with a minor allele count ≥15 and a known allele count ≥35. The list of maize accessions analyzed is available as Supplemental Table S3.
Twenty-five PEER factors and three principal components for population structure generated by Kremling et al. (2018) were used as covariants, and association analysis was conducted using a fixed linear model. Association P-values were calculated using an F-test, with a significance threshold 1 × 10⁻⁶. The association test was performed using a custom Python script (https://github.com/baoxingsong/dCNS/blob/master/scripts/CnsBasedGwasFixedModelV2.py).
We further investigated the significant associations between CNS PAVs and gene expression level. To further check the possible functional/loss-of-function states of alleles, especially those with a presence ratio <0.8 and >0.2,
For each significant association, we grouped those accessions with CNS PAV encoded as 1 as group “presence,” and grouped those accessions with CNS PAV encoded as 0 as group “absence.” For the significantly associated gene, we calculated the median expression level of group “presence” accessions and group “absence” accessions separately.
For each of those accessions with the CNS presence ratio <0.8 and >0.2; if its expression level is closer to the group “presence” median value, we classified it into group “presence.” If its expression is closer with group “absence” median value, we classified it into group “absence.”
We then compared the CNS reads mapping coverage ratio of group “absence” accessions with group “presence” accessions.
Detection of selective sweeps
We mapped the raw reads from resequenced landraces (Wang et al. 2017a) to the maize B73 v4 reference genome using BWA-MEM (Li and Durbin 2009) with default parameters and conducted SNP calling using the GATK v3.8 (McKenna et al. 2010) germline SNP calling best practices. Specifically, first HaplotypeCaller was used to call variants per sample and create GVCF files. Following this, we used GenomicsDBImport to consolidate GVCF files and joint-called genotypes from these with GenotypeGVFs. SelectVariants was used to output SNPs, as the sweep detection software currently cannot handle indels. We conducted genome-wide scans for selective sweep patterns using RaiSD v2.5 (Alachiotis and Pavlidis 2018) with default parameters, correcting for the number of base pairs with usable sequence data using mop (https://github.com/RILAB/mop) with default parameters.
In order to screen for adaptive loci as a complement to our domestication loci screen, we used the program pcadapt (Luu et al. 2017). We used the program on its default settings but removed inversion Inv4m and known inversions on Chromosomes 1 and 3, as well as a region of low recombination at the end of Chromosome 10 that is likely the abnormal 10 region (Mroczek et al. 2006). We removed these regions as low recombination regions interfere with the way that pcadapt defines the background relatedness for comparisons.
CNS similarity between two maize subgenomes
Syntenic genes between maize and sorghum, introduced above, were used here. To calculate the proportion of CNS sites shared in the 2 kbp upstream of the duplicated genes, we calculated the total length of the sorghum CNSs and the number of matched base pairs shared between each maize gene copy and sorghum gene. Then, we checked the proportion of those shared base pairs that overlapped (Supplemental Fig. S22).
Data access
All the CNS files in SAM format and BED format have been submitted to figshare (https://figshare.com/articles/dataset/CNS/14129006) and are available as Supplemental Data. The CNS identification program source code has been submitted to GitHub (https://github.com/baoxingsong/dCNS) and is available as Supplemental Code. All the sequence reads and de novo assembled genomes generated in this study have been submitted to the NCBI BioProject database (https://www.ncbi.nlm.nih.gov/bioproject/) under accession number PRJNA543119.
Competing interest statement
The authors declare no competing interests.
Acknowledgments
We thank Maria Katherine Mejia-Guerra for suggestions and comments on the open chromatin and TFBS analysis and William F. Thompson for insights on the DNA replication active regions. We thank Rémy Pasquet for providing plant material of Hyparrhenia diplandra and the USDA Germplasm Repository Information Network for material of Chrysopogon serrulatus. We thank Emre Cimen for help with statistical analysis, Guillaume Ramstein for discussion of eQTL and GWAS analysis, and Qi Sun and Cheng Zhou for advice about the design of sequence alignment algorithms. We also thank Robert Bukowski, Qi Sun, and Arcadio Valdes Franco for sequencing read mapping and variant calling of the maize data. Gen Xu provided suggestions on identification of low-methylated loci. Sara Miller assisted with proofreading the manuscript. We thank the three anonymous reviewers for insightful suggestions and comments. This work used the Extreme Science and Engineering Discovery Environment (XSEDE), which is supported by the National Science Foundation #ACI-1548562. This project is supported by the U.S. Department of Agriculture–Agricultural Research Service (USDA-ARS) and National Science Foundation #1822330 to E.S.B., E.A.K., J.R.-I., M.B.H., and M.C.R.
Author contributions: B.S., M.C.R., and E.S.B. designed the experiments and wrote the manuscript. B.S. and E.S.B. implemented the dCNS software. B.S. and Y.W. identified CNS. B.S. and E.R. performed genome assembly. B.S. and H.W. conducted maize subgenome analysis. P.J.B., B.S., and M.K.-B. conducted association analysis. E.A.K. and M.C.R. generated new sequencing data. J.R.-I. and D.J.G. conducted the domestication and local adaptation scan. J.R.-I., E.A.K., and M.B.H. contributed ideas and provided technical help. All authors revised and reviewed the manuscript.
Notes
[1] Supplementary material [Supplemental material is available for this article.]
[2] Article published online before print. Article, supplemental material, and publication date are at https://www.genome.org/cgi/doi/10.1101/gr.266528.120.
References
- ↵Akua T, Berezin I, Shaul O. 2010. The leader intron of AtMHX can elicit, in the absence of splicing, low-level intron-mediated enhancement that depends on the internal intron sequence. BMC Plant Biol 10: 93. 10.1186/1471-2229-10-93
- ↵Alachiotis N, Pavlidis P. 2018. RAiSD detects positive selection based on multiple signatures of a selective sweep and SNP vectors. Commun Biol 1: 79. 10.1038/s42003-018-0085-8
- ↵Algama M, Tasker E, Williams C, Parslow AC, Bryson-Richardson RJ, Keith JM. 2017. Genome-wide identification of conserved intronic non-coding sequences using a Bayesian segmentation approach. BMC Genomics 18: 259. 10.1186/s12864-017-3645-2
- ↵Altschul SF, Gish W, Miller W, Myers EW, Lipman DJ. 1990. Basic local alignment search tool. J Mol Biol 215: 403–410. 10.1016/S0022-2836(05)80360-2
- ↵Avsec Ž, Weilert M, Shrikumar A, Krueger S, Alexandari A, Dalal K, Fropf R, McAnany C, Gagneur J, Kundaje A, 2021. Base-resolution models of transcription-factor binding reveal soft motif syntax. Nat Genet 53: 354–366. 10.1038/s41588-021-00782-6
- ↵Black CC, Chen TM, Brown RH. 1969. Biochemical basis for plant competition. Weed Sci 17: 338–344. 10.1017/S0043174500054187
- ↵Brosse N, Dufour A, Meng X, Sun Q, Ragauskas A. 2012. Miscanthus: a fast-growing crop for biofuels and chemicals production. Biofuels, Bioprod Biorefin 6: 580–598. 10.1002/bbb.1353
- ↵Bukowski R, Guo X, Lu Y, Zou C, He B, Rong Z, Wang B, Xu D, Yang B, Xie C, 2018. Construction of the third-generation Zea mays haplotype map. Gigascience 7: 1–12. 10.1093/gigascience/gix134
- ↵Chen Y-CA, Aravin AA. 2015. Non-coding RNAs in transcriptional regulation: the review for current molecular biology reports. Curr Mol Biol Rep 1: 10–18. 10.1007/s40610-015-0002-6
- ↵Chorev M, Carmel L. 2012. The function of introns. Front Genet 3: 55. 10.3389/fgene.2012.00055
- ↵Clark RM, Wagler TN, Quijada P, Doebley J. 2006. A distant upstream enhancer at the maize domestication gene tb1 has pleiotropic effects on plant and inflorescent architecture. Nat Genet 38: 594–597. 10.1038/ng1784
- ↵Cvijović I, Good BH, Desai MM. 2018. The effect of strong purifying selection on genetic diversity. Genetics 209: 1235–1278. 10.1534/genetics.118.301058
- ↵De Coster W, D'Hert S, Schultz DT, Cruts M, Van Broeckhoven C. 2018. NanoPack: visualizing and processing long-read sequencing data. Bioinformatics 34: 2666–2669. 10.1093/bioinformatics/bty149
- ↵Delaneau O, Zazhytska M, Borel C, Giannuzzi G, Rey G, Howald C, Kumar S, Ongen H, Popadin K, Marbach D, 2019. Chromatin three-dimensional interactions mediate genetic effects on gene expression. Science 364: eaat8266. 10.1126/science.aat8266
- ↵Diehl AG, Ouyang N, Boyle AP. 2020. Transposable elements contribute to cell and species-specific chromatin looping and gene regulation in mammalian genomes. Nat Commun 11: 1796. 10.1038/s41467-020-15520-5
- ↵Dong P, Tu X, Chu P-Y, Lü P, Zhu N, Grierson D, Du B, Li P, Zhong S. 2017. 3D chromatin architecture of large plant genomes determined by local A/B compartments. Mol Plant 10: 1497–1509. 10.1016/j.molp.2017.11.005
- ↵Dong Q, Li N, Li X, Yuan Z, Xie D, Wang X, Li J, Yu Y, Wang J, Ding B, 2018. Genome-wide Hi-C analysis reveals extensive hierarchical chromatin interactions in rice. Plant J 94: 1141–1156. 10.1111/tpj.13925
- ↵Dong P, Tu X, Li H, Zhang J, Grierson D, Li P, Zhong S. 2020. Tissue-specific Hi-C analyses of rice, foxtail millet and maize suggest non-canonical function of plant chromatin domains. J Integr Plant Biol 62: 201–217. 10.1111/jipb.12809
- ↵Dror I, Golan T, Levy C, Rohs R, Mandel-Gutfreund Y. 2015. A widespread role of the motif environment in transcription factor binding across diverse protein families. Genome Res 25: 1268–1280. 10.1101/gr.184671.114
- ↵Dupeyron M, Singh KS, Bass C, Hayward A. 2019. Evolution of mutator transposable elements across eukaryotic diversity. Mob DNA 10: 12. 10.1186/s13100-019-0153-8
- ↵Emms DM, Kelly S. 2019. OrthoFinder: phylogenetic orthology inference for comparative genomics. Genome Biol 20: 238. 10.1186/s13059-019-1832-y
- ↵The ENCODE Project Consortium. 2012. An integrated encyclopedia of DNA elements in the human genome. Nature 489: 57–74. 10.1038/nature11247
- ↵Estep MC, McKain MR, Diaz DV, Zhong J, Hodge JG, Hodkinson TR, Layton DJ, Malcomber ST, Pasquet R, Kellogg EA. 2014. Allopolyploidy, diversification, and the Miocene grassland expansion. Proc Natl Acad Sci 111: 15149–15154. 10.1073/pnas.1404177111
- ↵Finucane HK, Bulik-Sullivan B, Gusev A, Trynka G, Reshef Y, Loh P-R, Anttila V, Xu H, Zang C, Farh K, 2015. Partitioning heritability by functional annotation using genome-wide association summary statistics. Nat Genet 47: 1228–1235. 10.1038/ng.3404
- ↵Flint-Garcia SA, Thuillet A-C, Yu J, Pressoir G, Romero SM, Mitchell SE, Doebley J, Kresovich S, Goodman MM, Buckler ES. 2005. Maize association population: a high-resolution platform for quantitative trait locus dissection: high-resolution maize association population. Plant J 44: 1054–1064. 10.1111/j.1365-313X.2005.02591.x
- ↵Freeling M, Subramaniam S. 2009. Conserved noncoding sequences (CNSs) in higher plants. Curr Opin Plant Biol 12: 126–132. 10.1016/j.pbi.2009.01.005
- ↵Gasperini M, Tome JM, Shendure J. 2020. Towards a comprehensive catalogue of validated and target-linked human enhancers. Nat Rev Genet 21: 292–310. 10.1038/s41576-019-0209-0
- ↵Gerstein MB, Kundaje A, Hariharan M, Landt SG, Yan K-K, Cheng C, Mu XJ, Khurana E, Rozowsky J, Alexander R, 2012. Architecture of the human regulatory network derived from ENCODE data. Nature 489: 91–100. 10.1038/nature11245
- ↵Giral H, Landmesser U, Kratzer A. 2018. Into the wild: GWAS exploration of non-coding RNAs. Front Cardiovasc Med 5: 181. 10.3389/fcvm.2018.00181
- ↵Greene B, Walko R, Hake S. 1994. Mutator insertions in an intron of the maize knotted1 gene result in dominant suppressible mutations. Genetics 138: 1275–1285. 10.1093/genetics/138.4.1275
- ↵Greenwald WW, Li H, Benaglio P, Jakubosky D, Matsui H, Schmitt A, Selvaraj S, D'Antonio M, D'Antonio-Chronowska A, Smith EN, 2019. Subtle changes in chromatin loop contact propensity are associated with differential gene regulation and expression. Nat Commun 10: 1054. 10.1038/s41467-019-08940-5
- ↵Guo H, Moose SP. 2003. Conserved noncoding sequences among cultivated cereal genomes identify candidate regulatory sequence elements and patterns of promoter evolution. Plant Cell 15: 1143–1158. 10.1105/tpc.010181
- ↵Hammelman J, Krismer K, Banerjee B, Gifford DK, Sherwood RI. 2020. Identification of determinants of differential chromatin accessibility through a massively parallel genome-integrated reporter assay. Genome Res 30: 1468–1480. 10.1101/gr.263228.120
- ↵Han L, Mu Z, Luo Z, Pan Q, Li L. 2019. New lncRNA annotation reveals extensive functional divergence of the transcriptome in maize. J Integr Plant Biol 61: 394–405. 10.1111/jipb.12708
- ↵Harmston N, Ing-Simmons E, Tan G, Perry M, Merkenschlager M, Lenhard B. 2017. Topologically associating domains are ancient features that coincide with metazoan clusters of extreme noncoding conservation. Nat Commun 8: 441. 10.1038/s41467-017-00524-5
- ↵Haudry A, Platts AE, Vello E, Hoen DR, Leclercq M, Williamson RJ, Forczek E, Joly-Lopez Z, Steffen JG, Hazzouri KM, 2013. An atlas of over 90,000 conserved noncoding sequences provides insight into crucifer regulatory regions. Nat Genet 45: 891–898. 10.1038/ng.2684
- ↵Howe KL, Contreras-Moreira B, De Silva N, Maslen G, Akanni W, Allen J, Alvarez-Jarreta J, Barba M, Bolser DM, Cambell L, 2020. Ensembl Genomes 2020—enabling non-vertebrate genomic research. Nucleic Acids Res 48: D689–D695. 10.1093/nar/gkz890
- ↵Inada DC, Bashir A, Lee C, Thomas BC, Ko C, Goff SA, Freeling M. 2003. Conserved noncoding sequences in the grasses. Genome Res 13: 2030–2041. 10.1101/gr.1280703
- ↵Jabbari K, Wirtz J, Rauscher M, Wiehe T. 2019. A common genomic code for chromatin architecture and recombination landscape. PLoS One 14: e0213278. 10.1371/journal.pone.0213278
- ↵Jiao Y, Peluso P, Shi J, Liang T, Stitzer MC, Wang B, Campbell MS, Stein JC, Wei X, Chin C-S, 2017. Improved maize reference genome with single-molecule technologies. Nature 546: 524–527. 10.1038/nature22971
- ↵Kadauke S, Blobel GA. 2009. Chromatin loops in gene regulation. Biochim Biophys Acta 1789: 17–25. 10.1016/j.bbagrm.2008.07.002
- ↵Kadota K, Ye J, Nakai Y, Terada T, Shimizu K. 2006. ROKU: a novel method for identification of tissue-specific genes. BMC Bioinformatics 7: 294. 10.1186/1471-2105-7-294
- ↵Karlin S, Altschul SF. 1990. Methods for assessing the statistical significance of molecular sequence features by using general scoring schemes. Proc Natl Acad Sci 87: 2264–2268. 10.1073/pnas.87.6.2264
- ↵Khalturin K, Anton-Erxleben F, Sassmann S, Wittlieb J, Hemmrich G, Bosch TCG. 2008. A novel gene family controls species-specific morphological traits in Hydra. PLoS Biol 6: e278. 10.1371/journal.pbio.0060278
- ↵Kistler L, Maezumi SY, de Souza JG, Przelomska NAS, Costa FM, Smith O, Loiselle H, Ramos-Madrigal J, Wales N, Ribeiro ER, 2018. Multiproxy evidence highlights a complex evolutionary legacy of maize in South America. Science 362: 1309–1313. 10.1126/science.aav0207
- ↵Kolmogorov M, Yuan J, Lin Y, Pevzner PA. 2019. Assembly of long, error-prone reads using repeat graphs. Nat Biotechnol 37: 540–546. 10.1038/s41587-019-0072-8
- ↵Kremling KAG, Chen S-Y, Su M-H, Lepak NK, Romay MC, Swarts KL, Lu F, Lorant A, Bradbury PJ, Buckler ES. 2018. Dysregulation of expression correlates with rare-allele burden and fitness loss in maize. Nature 555: 520–523. 10.1038/nature25966
- ↵Lai X, Behera S, Liang Z, Lu Y, Deogun JS, Schnable JC. 2017. STAG-CNS: an order-aware conserved noncoding sequences discovery tool for arbitrary numbers of species. Mol Plant 10: 990–999. 10.1016/j.molp.2017.05.010
- ↵Lawrence CJ, Dong Q, Polacco ML, Seigfried TE, Brendel V. 2004. MaizeGDB, the community database for maize genetics and genomics. Nucleic Acids Res 32: D393–D397. 10.1093/nar/gkh011
- ↵Levo M, Zalckvar E, Sharon E, Machado ACD, Kalma Y, Lotam-Pompan M, Weinberger A, Yakhini Z, Rohs R, Segal E. 2015. Unraveling determinants of transcription factor binding outside the core binding site. Genome Res 25: 1018–1029. 10.1101/gr.185033.114
- ↵Lewin HA, Robinson GE, Kress WJ, Baker WJ, Coddington J, Crandall KA, Durbin R, Edwards SV, Forest F, Gilbert MTP, 2018. Earth BioGenome Project: sequencing life for the future of life. Proc Natl Acad Sci 115: 4325–4333. 10.1073/pnas.1720115115
- ↵Li H. 2018. Minimap2: pairwise alignment for nucleotide sequences. Bioinformatics 34: 3094–3100. 10.1093/bioinformatics/bty191
- ↵Li H, Durbin R. 2009. Fast and accurate short read alignment with Burrows–Wheeler transform. Bioinformatics 25: 1754–1760. 10.1093/bioinformatics/btp324
- ↵Li H, Homer N. 2010. A survey of sequence alignment algorithms for next-generation sequencing. Brief Bioinformatics 11: 473–483. 10.1093/bib/bbq015
- ↵Li H, Handsaker B, Wysoker A, Fennell T, Ruan J, Homer N, Marth G, Abecasis G, Durbin R, 1000 Genome Project Data Processing Subgroup. 2009. The Sequence Alignment/Map format and SAMtools. Bioinformatics 25: 2078–2079. 10.1093/bioinformatics/btp352
- ↵Li Z, Wang M, Lin K, Xie Y, Guo J, Ye L, Zhuang Y, Teng W, Ran X, Tong Y, 2019. The bread wheat epigenomic map reveals distinct chromatin architectural and evolutionary features of functional genetic elements. Genome Biol 20: 139. 10.1186/s13059-019-1746-8
- ↵Liu C, Cheng Y-J, Wang J-W, Weigel D. 2017. Prominent topologically associated domains differentiate global chromatin packing in rice from Arabidopsis. Nat Plants 3: 742–748. 10.1038/s41477-017-0005-9
- ↵Lu Z, Marand AP, Ricci WA, Ethridge CL, Zhang X, Schmitz RJ. 2019. The prevalence, evolution and chromatin signatures of plant regulatory elements. Nat Plants 5: 1250–1259. 10.1038/s41477-019-0548-z
- ↵Luu K, Bazin E, Blum MGB. 2017. pcadapt: an R package to perform genome scans for selection based on principal component analysis. Mol Ecol Resour 17: 67–77. 10.1111/1755-0998.12592
- ↵Makarevitch I, Waters AJ, West PT, Stitzer M, Hirsch CN, Ross-Ibarra J, Springer NM. 2015. Transposable elements contribute to activation of maize genes in response to abiotic stress. PLoS Genet 11: e1004915. 10.1371/journal.pgen.1004915
- ↵Manners JM. 2011. Functional genomics of sugarcane. In Advances in botanical research (ed. Kader J-C, Delseny M), Vol. 60, pp. 89–168. Academic Press, London. 10.1016/B978-0-12-385851-1.00003-2
- ↵Mapleson D, Accinelli GG, Kettleborough G, Wright J, Clavijo BJ. 2017. KAT: a K-mer analysis toolkit to quality control NGS datasets and genome assemblies. Bioinformatics 33: 574–576. 10.1093/bioinformatics/btw663
- ↵McCormick RF, Truong SK, Sreedasyam A, Jenkins J, Shu S, Sims D, Kennedy M, Amirebrahimi M, Weers BD, McKinley B, 2018. The Sorghum bicolor reference genome: improved assembly, gene annotations, a transcriptome atlas, and signatures of genome organization. Plant J 93: 338–354. 10.1111/tpj.13781
- ↵McKenna A, Hanna M, Banks E, Sivachenko A, Cibulskis K, Kernytsky A, Garimella K, Altshuler D, Gabriel S, Daly M, 2010. The Genome Analysis Toolkit: a MapReduce framework for analyzing next-generation DNA sequencing data. Genome Res 20: 1297–1303. 10.1101/gr.107524.110
- ↵McLean CY, Reno PL, Pollen AA, Bassan AI, Capellini TD, Guenther C, Indjeian VB, Lim X, Menke DB, Schaar BT, 2011. Human-specific loss of regulatory DNA and the evolution of human-specific traits. Nature 471: 216–219. 10.1038/nature09774
- ↵Mitros T, Session AM, James BT, Wu GA, Belaffif MB, Clark LV, Shu S, Dong H, Barling A, Holmes JR, 2020. Genome biology of the paleotetraploid perennial biomass crop Miscanthus. Nat Commun 11: 5442. 10.1038/s41467-020-18923-6
- ↵Mroczek RJ, Melo JR, Luce AC, Hiatt EN, Dawe RK. 2006. The maize Ab10 meiotic drive system maps to supernumerary sequences in a large complex haplotype. Genetics 174: 145–154. 10.1534/genetics.105.048322
- ↵Mugal CF, Arndt PF, Holm L, Ellegren H. 2015. Evolutionary consequences of DNA methylation on the GC content in vertebrate genomes. Adv Genet 5: 441–447. 10.1534/g3.114.015545
- ↵Naughton C, Avlonitis N, Corless S, Prendergast JG, Mati IK, Eijk PP, Cockroft SL, Bradley M, Ylstra B, Gilbert N. 2013. Transcription forms and remodels supercoiling domains unfolding large-scale chromatin structures. Nat Struct Mol Biol 20: 387–395. 10.1038/nsmb.2509
- ↵Nishizaki SS, Boyle AP. 2017. Mining the unknown: assigning function to noncoding single nucleotide polymorphisms. Trends Genet 33: 34–45. 10.1016/j.tig.2016.10.008
- ↵Noshay JM, Marand AP, Anderson SN, Zhou P, Guerra MKM, Lu Z, O'Connor C, Crisp PA, Hirsch CN, Schmitz RJ, 2020. Cis-regulatory elements within TEs can influence expression of nearby maize genes. bioRxiv 10.1101/2020.05.20.107169
- ↵Oka R, Zicola J, Weber B, Anderson SN, Hodgman C, Gent JI, Wesselink J-J, Springer NM, Hoefsloot HCJ, Turck F, 2017. Genome-wide mapping of transcriptional enhancer candidates using DNA and chromatin features in maize. Genome Biol 18: 137. 10.1186/s13059-017-1273-4
- ↵O'Malley RC, Huang S-SC, Song L, Lewsey MG, Bartlett A, Nery JR, Galli M, Gallavotti A, Ecker JR. 2016. Cistrome and epicistrome features shape the regulatory DNA landscape. Cell 165: 1280–1292. 10.1016/j.cell.2016.04.038
- ↵Parker SCJ, Margulies EH, Tullius TD. 2008. The relationship between fine scale DNA structure, GC content, and functional elements in 1% of the human genome. Genome Inform 20: 199–211.
- ↵Parvathaneni RK, Bertolini E, Shamimuzzaman M, Vera DL, Lung P-Y, Rice BR, Zhang J, Brown PJ, Lipka AE, Bass HW, 2020. The regulatory landscape of early maize inflorescence development. Genome Biol 21: 165. 10.1186/s13059-020-02070-8
- ↵Peng Y, Xiong D, Zhao L, Ouyang W, Wang S, Sun J, Zhang Q, Guan P, Xie L, Li W, 2019. Chromatin interaction maps reveal genetic regulation for quantitative traits in maize. Nat Commun 10: 2632. 10.1038/s41467-019-10602-5
- ↵Polychronopoulos D, King JWD, Nash AJ, Tan G, Lenhard B. 2017. Conserved non-coding elements: developmental gene regulation meets genome organization. Nucleic Acids Res 45: 12611–12624. 10.1093/nar/gkx1074
- ↵Ramachandran D, McKain MR, Kellogg EA, Hawkins JS. 2020. Evolutionary dynamics of transposable elements following a shared polyploidization event in the tribe Andropogoneae. Adv Genet 10: 4387–4398. 10.1534/g3.120.401596
- ↵Ricci WA, Lu Z, Ji L, Marand AP, Ethridge CL, Murphy NG, Noshay JM, Galli M, Mejía-Guerra MK, Colomé-Tatché M, 2019. Widespread long-range cis-regulatory elements in the maize genome. Nat Plants 5: 1237–1249. 10.1038/s41477-019-0547-0
- ↵Rigau M, Juan D, Valencia A, Rico D. 2019. Intronic CNVs and gene expression variation in human populations. PLoS Genet 15: e1007902. 10.1371/journal.pgen.1007902
- ↵Ritchie GR, Flicek P. 2014. Computational approaches to interpreting genomic sequence variation. Genome Med 6: 87. 10.1186/s13073-014-0087-1
- ↵Rodgers-Melnick E, Bradbury PJ, Elshire RJ, Glaubitz JC, Acharya CB, Mitchell SE, Li C, Li Y, Buckler ES. 2015. Recombination in diverse maize is stable, predictable, and associated with genetic load. Proc Natl Acad Sci 112: 3823–3828. 10.1073/pnas.1413864112
- ↵Rodgers-Melnick E, Vera DL, Bass HW, Buckler ES. 2016. Open chromatin reveals the functional maize genome. Proc Natl Acad Sci 113: E3177–E3184. 10.1073/pnas.1525244113
- ↵Ross JL, Fong PP, Cavener DR. 1994. Correlated evolution of the cis-acting regulatory elements and developmental expression of the Drosophila Gld gene in seven species from the subgroup melanogaster. Dev Genet 15: 38–50. 10.1002/dvg.1020150106
- ↵Sage RF, Zhu X-G. 2011. Exploiting the engine of C4 photosynthesis. J Exp Bot 62: 2989–3000. 10.1093/jxb/err179
- ↵Salvi S, Sponza G, Morgante M, Tomes D, Niu X, Fengler KA, Meeley R, Ananiev EV, Svitashev S, Bruggemann E, 2007. Conserved noncoding genomic sequences associated with a flowering-time quantitative trait locus in maize. Proc Natl Acad Sci 104: 11376–11381. 10.1073/pnas.0704145104
- ↵Schnable JC, Springer NM, Freeling M. 2011. Differentiation of the maize subgenomes by genome dominance and both ancient and ongoing gene loss. Proc Natl Acad Sci 108: 4069–4074. 10.1073/pnas.1101368108
- ↵Schwartz U, Németh A, Diermeier S, Exler JH, Hansch S, Maldonado R, Heizinger L, Merkl R, Längst G. 2019. Characterizing the nuclease accessibility of DNA in human cells to map higher order structures of chromatin. Nucleic Acids Res 47: 1239–1254. 10.1093/nar/gky1203
- ↵Shen Z, Tao J, Fonseca GJ, Glass CK. 2020. Natural genetic variation affecting transcription factor spacing at regulatory regions is generally well tolerated. bioRxiv 10.1101/2020.04.02.021535
- ↵Simão FA, Waterhouse RM, Ioannidis P, Kriventseva EV, Zdobnov EM. 2015. BUSCO: assessing genome assembly and annotation completeness with single-copy orthologs. Bioinformatics 31: 3210–3212. 10.1093/bioinformatics/btv351
- ↵Smith TF, Waterman MS. 1981. Identification of common molecular subsequences. J Mol Biol 147: 195–197. 10.1016/0022-2836(81)90087-5
- ↵Smith AM, Sanchez M-J, Follows GA, Kinston S, Donaldson IJ, Green AR, Göttgens B. 2008. A novel mode of enhancer evolution: the Tal1 stem cell enhancer recruited a MIR element to specifically boost its activity. Genome Res 18: 1422–1432. 10.1101/gr.077008.108
- ↵Statello L, Guo C-J, Chen L-L, Huarte M. 2021. Gene regulation by long non-coding RNAs and its biological functions. Nat Rev Mol Cell Biol 22: 96–118. 10.1038/s41580-020-00315-9
- ↵Stitzer MC, Anderson SN, Springer NM, Ross-Ibarra J. 2019. The genomic ecosystem of transposable elements in maize. bioRxiv 10.1101/559922
- ↵Studer A, Zhao Q, Ross-Ibarra J, Doebley J. 2011. Identification of a functional transposon insertion in the maize domestication gene tb1. Nat Genet 43: 1160–1163. 10.1038/ng.942
- ↵Suzuki MM, Bird A. 2008. DNA methylation landscapes: provocative insights from epigenomics. Nat Rev Genet 9: 465–476. 10.1038/nrg2341
- ↵Swigonová Z, Lai J, Ma J, Ramakrishna W, Llaca V, Bennetzen JL, Messing J. 2004. Close split of sorghum and maize genome progenitors. Genome Res 14: 1916–1923. 10.1101/gr.2332504
- ↵Szabo Q, Bantignies F, Cavalli G. 2019. Principles of genome folding into topologically associating domains. Sci Adv 5: eaaw1668. 10.1126/sciadv.aaw1668
- ↵Tang H, Lyons E, Pedersen B, Schnable JC, Paterson AH, Freeling M. 2011. Screening synteny blocks in pairwise genome comparisons through integer programming. BMC Bioinformatics 12: 102. 10.1186/1471-2105-12-102
- ↵Tian F, Yang D-C, Meng Y-Q, Jin J, Gao G. 2020. PlantRegMap: charting functional regulatory maps in plants. Nucleic Acids Res 48: D1104–D1113. 10.1093/nar/gkz1020
- ↵Tu X, Mejía-Guerra MK, Franco JAV, Tzeng D, Chu P-Y, Shen W, Wei Y, Dai X, Li P, Buckler ES, 2020. Reconstructing the maize leaf regulatory network using ChIP-seq data of 104 transcription factors. Nat Commun 11: 5089. 10.1038/s41467-020-18832-8
- ↵Vandepoele K, Casneuf T, Van de Peer Y. 2006. Identification of novel regulatory modules in dicotyledonous plants using expression data and comparative genomics. Genome Biol 7: R103. 10.1186/gb-2006-7-11-r103
- ↵Van de Velde J, Van Bel M, Vaneechoutte D, Vandepoele K. 2016. A collection of conserved noncoding sequences to study gene regulation in flowering plants. Plant Physiol 171: 2586–2598. 10.1104/pp.16.00821
- ↵Vaser R, Sović I, Nagarajan N, Šikić M. 2017. Fast and accurate de novo genome assembly from long uncorrected reads. Genome Res 27: 737–746. 10.1101/gr.214270.116
- ↵Vicentini A, Barber JC, Aliscioni SS, Giussani LM, Kellogg EA. 2008. The age of the grasses and clusters of origins of C4 photosynthesis. Glob Chang Biol 14: 2963–2977. 10.1111/j.1365-2486.2008.01688.x
- ↵Viturawong T, Meissner F, Butter F, Mann M. 2013. A DNA-centric protein interaction map of ultraconserved elements reveals contribution of transcription factor binding hubs to conservation. Cell Rep 5: 531–545. 10.1016/j.celrep.2013.09.022
- ↵Walker BJ, Abeel T, Shea T, Priest M, Abouelliel A, Sakthikumar S, Cuomo CA, Zeng Q, Wortman J, Young SK, 2014. Pilon: an integrated tool for comprehensive microbial variant detection and genome assembly improvement. PLoS One 9: e112963. 10.1371/journal.pone.0112963
- ↵Wallace JG, Bradbury PJ, Zhang N, Gibon Y, Stitt M, Buckler ES. 2014. Association mapping across numerous traits reveals patterns of functional variation in maize. PLoS Genet 10: e100484. 10.1371/journal.pgen.1004845
- ↵Walley JW, Sartor RC, Shen Z, Schmitz RJ, Wu KJ, Urich MA, Nery JR, Smith LG, Schnable JC, Ecker JR, 2016. Integration of omic networks in a developmental atlas of maize. Science 353: 814–818. 10.1126/science.aag1125
- ↵Wang L, Beissinger TM, Lorant A, Ross-Ibarra C, Ross-Ibarra J, Hufford MB. 2017a. The interplay of demography and selection during maize domestication and expansion. Genome Biol 18: 215. 10.1186/s13059-017-1346-4
- ↵Wang M, Tu L, Lin M, Lin Z, Wang P, Yang Q, Ye Z, Shen C, Li J, Zhang L, 2017b. Asymmetric subgenome selection and cis-regulatory divergence during cotton domestication. Nat Genet 49: 579–587. 10.1038/ng.3807
- ↵Wang M, Wang P, Lin M, Ye Z, Li G, Tu L, Shen C, Li J, Yang Q, Zhang X. 2018. Evolutionary dynamics of 3D genome architecture following polyploidization in cotton. Nat Plants 4: 90–97. 10.1038/s41477-017-0096-3
- ↵Warnefors M, Hartmann B, Thomsen S, Alonso CR. 2016. Combinatorial gene regulatory functions underlie ultraconserved elements in Drosophila. Mol Biol Evol 33: 2294–2306. 10.1093/molbev/msw101
- ↵Washburn JD, Mejia-Guerra MK, Ramstein G, Kremling KA, Valluru R, Buckler ES, Wang H. 2019. Evolutionarily informed deep learning methods for predicting relative transcript abundance from DNA sequence. Proc Natl Acad Sci 116: 5542–5549. 10.1073/pnas.1814551116
- ↵Wear EE, Song J, Zynda GJ, LeBlanc C, Lee T-J, Mickelson-Young L, Concia L, Mulvaney P, Szymanski ES, Allen GC, 2017. Genomic analysis of the DNA replication timing program during mitotic S phase in maize (Zea mays) root tips. Plant Cell 29: 2126–2149. 10.1105/tpc.17.00037
- ↵Wittkopp PJ, Vaccaro K, Carroll SB. 2002. Evolution of yellow gene regulation and pigmentation in Drosophila. Current Biol 12: 1547–1556. 10.1016/S0960-9822(02)01113-2
- ↵Won H, Huang J, Opland CK, Hartl CL, Geschwind DH. 2019. Human evolved regulatory elements modulate genes involved in cortical expansion and neurodevelopmental disease susceptibility. Nat Commun 10: 2396. 10.1038/s41467-019-10248-3
- ↵Xiang R, van den Berg I, MacLeod IM, Hayes BJ, Prowse-Wilkins CP, Wang M, Bolormaa S, Liu Z, Rochfort SJ, Reich CM, 2019. Quantifying the contribution of sequence variants with regulatory and evolutionary significance to 34 bovine complex traits. Proc Natl Acad Sci 116: 19398–19408. 10.1073/pnas.1904159116
- ↵Xie X, Kamal M, Lander ES. 2006. A family of conserved noncoding elements derived from an ancient transposable element. Proc Natl Acad Sci 103: 11659–11664. 10.1073/pnas.0604768103
- ↵Xie J, Qian K, Si J, Xiao L, Ci D, Zhang D. 2018. Conserved noncoding sequences conserve biological networks and influence genome evolution. Heredity (Edinb) 120: 437–451. 10.1038/s41437-018-0055-4
- ↵Xu G, Lyu J, Li Q, Liu H, Wang D, Zhang M, Springer NM, Ross-Ibarra J, Yang J. 2020. Evolutionary and functional genomics of DNA methylation in maize domestication and improvement. Nat Commun 11: 5539. 10.1038/s41467-020-19333-4
- ↵Yanai I, Benjamin H, Shmoish M, Chalifa-Caspi V, Shklar M, Ophir R, Bar-Even A, Horn-Saban S, Safran M, Domany E, 2005. Genome-wide midrange transcription profiles reveal expression level relationships in human tissue specification. Bioinformatics 21: 650–659. 10.1093/bioinformatics/bti042
- ↵Yao R-W, Wang Y, Chen L-L. 2019. Cellular functions of long noncoding RNAs. Nat Cell Biol 21: 542–551. 10.1038/s41556-019-0311-8
- ↵Yoon J-H, Abdelmohsen K, Gorospe M. 2013. Posttranscriptional gene regulation by long noncoding RNA. J Mol Biol 425: 3723–3730. 10.1016/j.jmb.2012.11.024
- ↵Zhang F, Lupski JR. 2015. Non-coding genetic variants in human disease. Hum Mol Genet 24: R102–R110. 10.1093/hmg/ddv259
- ↵Zhang Z, Berman P, Miller W. 1998. Alignments without low-scoring regions. J Comput Biol 5: 197–210. 10.1089/cmb.1998.5.197
- ↵Zhang X, Yazaki J, Sundaresan A, Cokus S, Chan SW-L, Chen H, Henderson IR, Shinn P, Pellegrini M, Jacobsen SE, 2006. Genome-wide high-resolution mapping and functional analysis of DNA methylation in Arabidopsis. Cell 126: 1189–1201. 10.1016/j.cell.2006.08.003
- ↵Zhang W, Wu Y, Schnable JC, Zeng Z, Freeling M, Crawford GE, Jiang J. 2012. High-resolution mapping of open chromatin in the rice genome. Genome Res 22: 151–162. 10.1101/gr.131342.111
- ↵Zhang J, Zhang X, Tang H, Zhang Q, Hua X, Ma X, Zhu F, Jones T, Zhu X, Bowers J, 2018. Allele-defined genome of the autopolyploid sugarcane Saccharum spontaneum L. Nat Genet 50: 1565–1573. 10.1038/s41588-018-0237-2
- ↵Zhao H, Sun Z, Wang J, Huang H, Kocher J-P, Wang L. 2014. CrossMap: a versatile tool for coordinate conversion between genome assemblies. Bioinformatics 30: 1006–1007. 10.1093/bioinformatics/btt730
- ↵Zhao H, Zhang W, Chen L, Wang L, Marand AP, Wu Y, Jiang J. 2018. Proliferation of regulatory DNA elements derived from transposable elements in the maize genome. Plant Physiol 176: 2789–2803. 10.1104/pp.17.01467
- ↵Zilberman D, Gehring M, Tran RK, Ballinger T, Henikoff S. 2007. Genome-wide analysis of Arabidopsis thaliana DNA methylation uncovers an interdependence between methylation and transcription. Nat Genet 39: 61–69. 10.1038/ng1929