
Abstract
Protein-truncating variants (PTVs) have important impacts on phenotype diversity and disease. However, their population genetics characteristics in more globally diverse populations are not well defined. Here, we describe patterns of PTVs in 1320 genes sequenced in 10,539 healthy controls and 9434 patients with psoriasis, all of Han Chinese ancestry. We identify 8720 PTVs, of which 77% are novel, and estimate 88% of all PTVs are deleterious and subject to purifying selection. Furthermore, we show that individuals with psoriasis have a significantly higher burden of PTVs compared to controls (P = 0.02). Finally, we identified 18 PTVs in 14 genes with unusually high levels of population differentiation, consistent with the action of local adaptation. Our study provides insights into patterns and consequences of PTVs.
Protein-truncating variants (PTVs) are expected to have strong impacts on gene function and phenotypes (Rivas et al. 2015; Exome Aggregation Consortium et al. 2016; Cassa et al. 2017; DeBoever et al. 2018; Emdin et al. 2018; Ganna et al. 2018). Indeed, PTVs are enriched for disease-related mutations (Holbrook et al. 2004; Stenson et al. 2014), are generally rare and deleterious (Exome Aggregation Consortium et al. 2016), and are abundant in the genomes of individuals (MacArthur and Tyler-Smith 2010; Rivas et al. 2015; Saleheen et al. 2017). The potential contribution of PTVs to clinically important traits has engendered significant attention in large-scale sequencing studies (Karczewski et al. 2020). For example, the Exome Aggregation Consortium (ExAC) (Exome Aggregation Consortium et al. 2016) analyzed exome sequence data from 60,706 individuals of diverse ancestry and identified 3230 genes (17.7%) intolerant to PTVs. The Pakistan Risk of Myocardial Infarction Study (Saleheen et al. 2017) performed exome sequencing on 10,503 South Asians with a high rate of consanguinity and identified 49,138 rare PTVs estimated to knock out 1317 genes. Finally, Ganna et al. (2018) explored the impacts of PTVs on 13 quantitative traits and 10 diseases using exome sequence from 100,296 individuals.
However, the role of PTVs in complex human autoimmune diseases has not been thoroughly evaluated. Moreover, patterns and characteristics of PTVs in the Chinese population remain understudied, even though the Chinese people are the world's largest population, comprising 1.4 billion people. To address this gap, we reanalyze targeted sequence data from 1320 genes in 19,973 individuals of Han Chinese ancestry (Tang et al. 2007; Sheng et al. 2014; Zhou et al. 2016; Zhen et al. 2019).
Results
Characteristics of PTVs in a large Chinese population
Sequence data were subjected to standard quality control filters as previously described (Supplemental Materials; Supplemental Table S1, S2; Supplemental Fig. S1, S2; Tennessen et al. 2012; Fu et al. 2013; Exome Aggregation Consortium et al. 2016), resulting in a data set of 19,973 individuals, including 10,539 healthy control individuals and 9434 patients with psoriasis. High-coverage sequencing with an average depth of 45.8× ± 9.6× (mean ± sd) (Supplemental Table S3) was obtained for 1320 protein-coding genes (Supplemental Table S4).
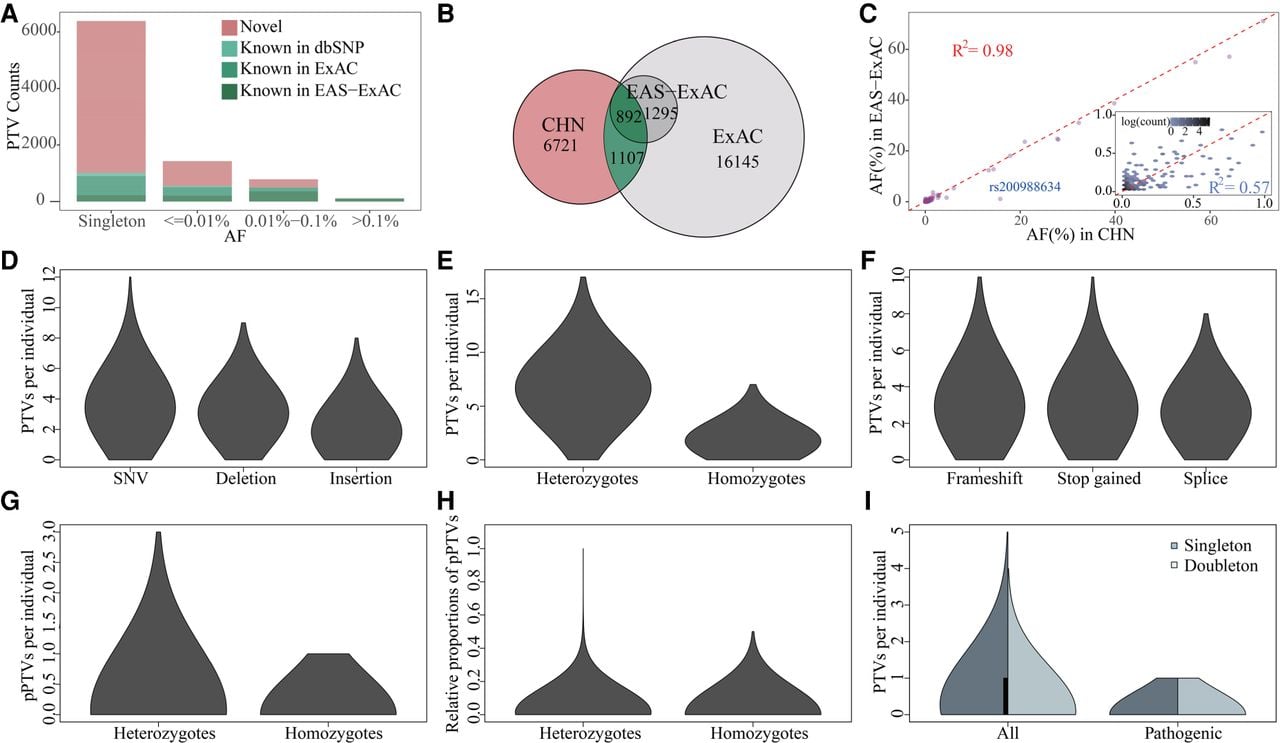
Overall, we identified 8720 high-confidence autosomal PTVs (stop-gain, frameshift, or splice-site mutations predicted to inactivate a gene) (Supplemental Table S5), including 6389 (73.3%) singletons and 1054 (12.1%) doubletons. Only 351 (4.0%) PTVs were observed 10 or more times and 14 (0.2%) PTVs were common (allele frequency ≥ 5%). Furthermore, 2179 (25.0%) PTVs were present in ExAC or dbSNP (Sherry et al. 2001), and thus, 6541 (75.0%) PTVs were novel and not previously reported (Fig. 1A). Among the discovered PTVs, 6721 (77.1%) and 7828 (90.0%) were novel when compared to ExAC or its East Asian (EAS-ExAC) population (Fig. 1B), respectively. Among 892 PTVs shared by the Chinese and EAS-ExAC population, allele frequencies were highly correlated (R2 of 0.98), but as expected, the correlation was much lower for rare variants (R2 of 0.57) (Fig. 1C). One PTV (rs200988634 at OTOA) (Fig. 1C) had a highly discordant allele frequency compared with EAS-ExAC, which may result from technical differences in variant calling or population structure, as the EAS-ExAC sample is comprised of individuals of East Asian descent, whereas our sample is predominantly from mainland China (Supplemental Table S6).
Protein-truncating variants of 19,973 Chinese in 1320 targeted genes. (A) Allele frequency spectrum of known and novel PTVs. (B) Venn diagram of PTVs in the Chinese (CHN, n = 19,973), ExAC (n = 60,706), and East Asian (EAS-ExAC, n = 4327) population in 1320 genes. (C) Allele frequency comparisons of 892 overlapped PTVs between CHN and EAS-ExAC. The inset shows those of PTVs with a maximum allele frequency of 1%. (D–F) Individual level summary of PTVs in variant types (D), genotypic composition (E), and consequence (F). (G) Number of pPTVs per individual in heterozygous and homozygous genotypes. (H) Relative proportions of pPTVs in heterozygous and homozygous genotypes. (I) Number of PTVs and pPTVs per individual in singletons and doubletons.
Individual burdens of PTVs
The per-individual burden of PTVs in our samples is 8.6 ± 2.2 among these 1320 targeted genes. We next quantified the number of PTVs due to SNVs, insertions, and deletions (Supplemental Table S7). We observed more PTVs due to SNVs than deletions (P < 2.2 × 10⁻¹⁶, Mann–Whitney U test) or insertions (P < 2.2 × 10⁻¹⁶, Mann–Whitney U test) (Fig. 1D). However, insertions and deletions accounted for a higher proportion of PTVs compared to SNVs (Supplemental Table S7). We also observed more PTVs caused by frameshifts than those of stop-gained and splice variants (P < 2.2 × 10⁻¹⁶ and P < 2.2 × 10⁻¹⁶, respectively; Mann–Whitney U test) (Fig. 1F). Among these 1320 genes, Chinese individuals carried PTV burdens of 0.1 ± 0.3 pathogenic heterozygotes and 0.0001 ± 0.01 pathogenic homozygotes (Fig. 1G) out of an average of 6.8 ± 2.3 and 1.8 ± 1.1 heterozygous and homozygous PTVs (Fig. 1E), respectively. Relative proportions of pathogenic PTVs (pPTVs) in heterozygotes were significantly higher than those in homozygotes (P < 2.2 × 10⁻¹⁶, Mann–Whitney U test) (Fig. 1H), consistent with the effects of purifying selection on homozygous pPTVs. We also inferred purifying selection was acting on singleton pPTVs by comparing allele frequencies between pPTVs and PTVs (Fig. 1I). Individual level summaries of PTVs in allele frequency and CDS position are shown in Supplemental Figures S3 and S4.
Functional impacts of PTVs
We used Combined Annotation Dependent Depletion (CADD) to characterize the functional impacts of PTVs (Kircher et al. 2014). CADD is a measure of variant deleteriousness that integrates diverse genomic features into a Phred-scaled score for each variant. PTVs with higher CADD values are more likely to have deleterious effects. Whereas a negative correlation was detected between PTVs' allele frequency and CADD (Supplemental Figs. S5, S6), rarer PTVs tend to be enriched in their deleterious effects (CADD ≥ 30), regardless of their position in the coding DNA sequence (CDS) (Fig. 2A). A similar trend was observed with missense variants, though the signal was less pronounced and few synonymous variants have predicted deleterious effects. We also observed a lower proportion of singleton PTVs with CADD ≥ 30 in the head (<10%) CDS than those in the body (10%–90%) or tail (>90%), which could be explained by their higher deleteriousness (Fig. 2A).
Deleteriousness of PTVs. (A) Fractions of variants that are potentially deleterious (CADD ≥ 30) for each functional category and location of variants. Note, head, body, and tail are defined as CDS position of <10%, 10%–90%, and >90%, respectively. (B) Fractions of deleterious variants under purifying selection (f) for protein-truncating (PTV, red) and missense (Mis, green) variants across 19,973 Chinese (CHN, dark) and 4327 East Asians (EAS-ExAC, light). (C–F) Fractions of deleterious variants that are subject to purifying selection (f) for PTVs across CHN from B grouped by CDS positions (C), variant types (D), consequence (E), and gene sets (F). Note that theoretical 95% confidence intervals are obtained via bootstrapping of 1000 replications and shown as error bars.
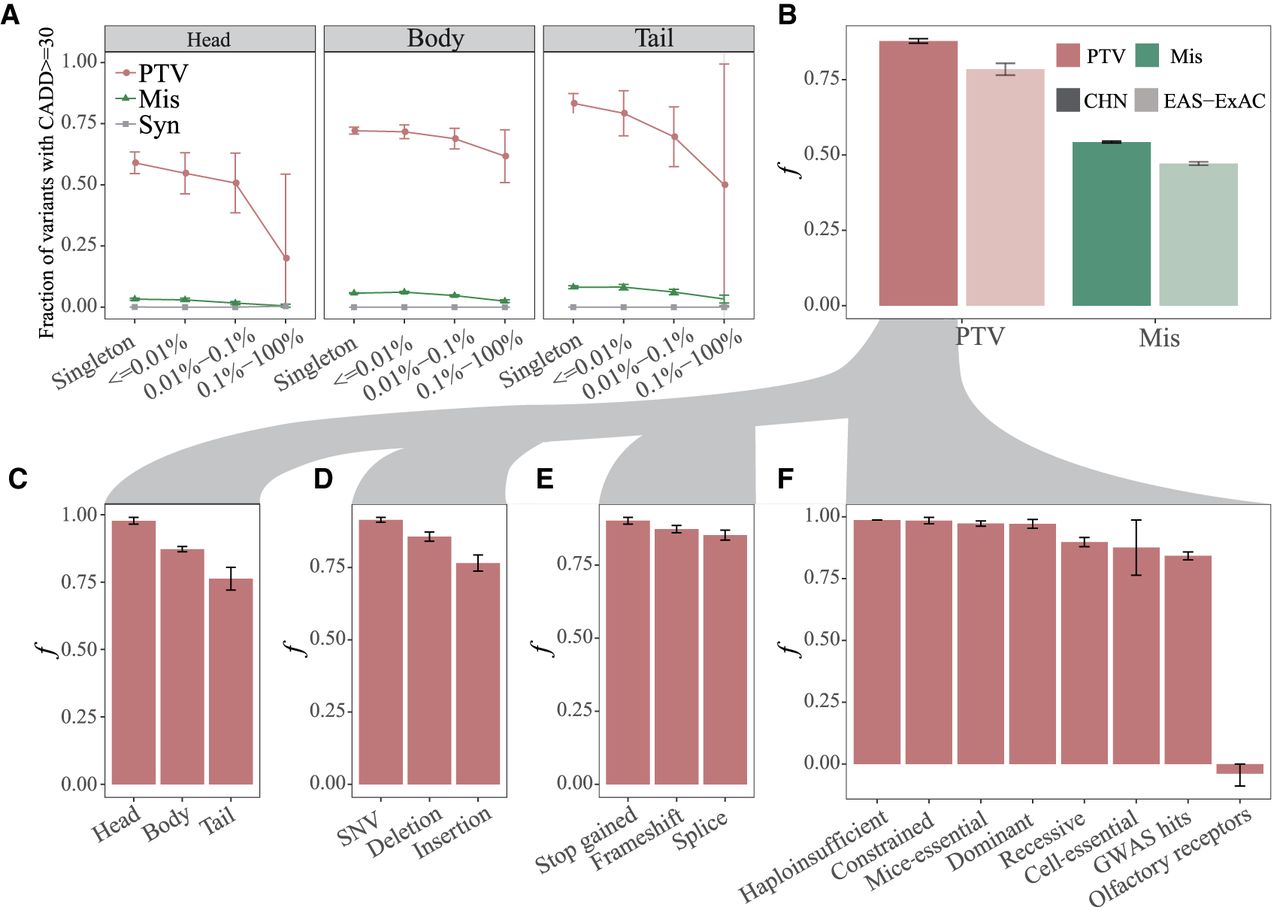
To quantify the burden of deleterious PTVs, the fraction of sites under selection (f) was calculated (see Methods) in the CHN and EAS-ExAC population as a function of CDS position, variant types, consequence, and gene sets as previously described (Moon and Akey 2016). We observed that 87.9% and 54.3% of PTVs and missense variants (P < 2.2 × 10⁻¹⁶; OR = 6.1; 95% CI: 5.7–6.6, two-sided Fisher's exact test) were deleterious and subject to purifying selection in 19,973 Chinese, respectively (Fig. 2B). Our estimate of f suggests a considerably higher burden of deleterious PTVs in 19,973 CHN compared with that in 4327 EAS (fCHN = 87.9% vs. fEAS-ExAC = 78.5%, P < 2.2 × 10⁻¹⁶; OR = 2.0; 95% CI: 1.7–2.3, two-sided Fisher's exact test) (Fig. 2B) in these 1320 genes, likely due to sample size differences. Moreover, we could see a lower f (but almost the same scale) in the whole genome of 2234 Japanese (f∼70%) (Okada et al. 2018), in which such decrease could be due to smaller sample sizes and larger genome regions. PTVs occurring in the head CDS were significantly more deleterious than those in the body (P < 2.2 × 10⁻¹⁶; OR = 39.5; 95% CI: 22.4–77.3, two-sided Fisher's exact test) and tail (P < 2.2 × 10⁻¹⁶; OR = 13.4; 95% CI: 7.2–27.4, two-sided Fisher's exact test) (Fig. 2C). We found PTVs due to deletions were significantly more deleterious than those of insertions (P = 2.3 × 10⁻⁹; OR = 1.83; 95% CI: 1.5–2.2, two-sided Fisher's exact test) (Fig. 2D), consistent with Sjödin et al. (2010). PTVs of stop-gain were significantly more deleterious than those of frameshift (P = 8.8 × 10⁻⁴; OR = 1.3; 95% CI: 1.1–1.6, two-sided Fisher's exact test) and splice variants (P = 9.3 × 10⁻⁷; OR = 1.6; 95% CI: 1.3–1.9, two-sided Fisher's exact test) (Fig. 2E). The fraction of PTVs that were deleterious in psoriasis patients (fCase = 85.3%) was slightly lower (but not significant, P = 0.603, two-sided Fisher's exact test) than controls (fControl = 85.7%). Estimates of f for PTVs and missense variants in the worldwide population among 1320 genes are shown in Supplemental Figure S7.
We also studied patterns of f across gene sets (Fig. 2F). The most deleterious genes of PTVs were ClinGen haploinsufficient (f = 98.7%) (Rehm et al. 2015) and ExAC constrained genes (f = 98.5%). As expected, estimates of f in PTVs associated with autosomal-dominant diseases (f = 97.2%) were significantly higher than those from genes harboring autosomal-recessive diseases (f = 90.0%; P = 1.95 × 10⁻⁶, two-sided Fisher's exact test). Moreover, positive selection in human olfactory receptor genes has been reported (Gilad et al. 2003; Nielsen et al. 2005), and we estimate 3.9% of PTVs in the olfactory receptor genes exhibit signals of weak positive selection.
Leveraging PTVs to study gene constraint
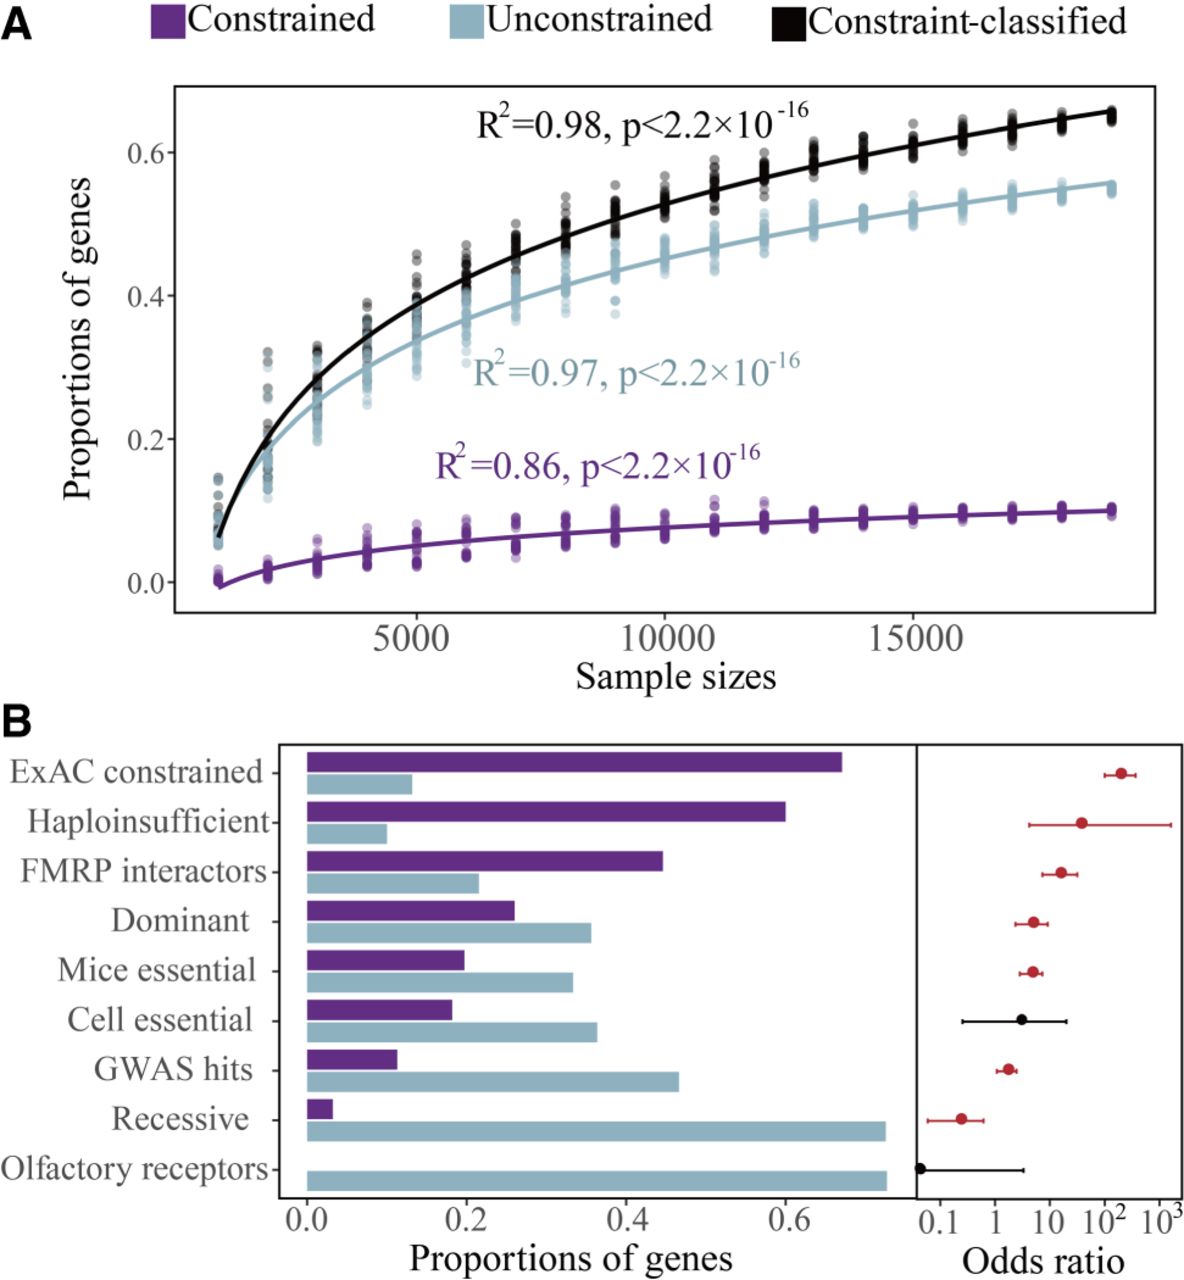
We used pLI, the probability of being loss-of-function (LoF)-intolerant (Exome Aggregation Consortium et al. 2016), as a gene-level constraint metric for PTV intolerance (see Methods; Supplemental Fig. S8). Our estimates of pLI were not correlated with sequencing depth or transcript length (Supplemental Fig. S9). We observed logarithmic increases in the proportion of constrained (pLI ≥ 0.9) and unconstrained (pLI ≤ 0.1) genes with increasing sample sizes (Fig. 3A) and estimate ∼100,000 individuals would be adequate to fully study gene constraint. In our data set of 19,973 individuals, we estimate 121 (9.9%) genes are constrained and 682 (55.6%) genes are unconstrained. Using two-sided Fisher's exact tests, we observed that the 121 constrained genes were significantly enriched for a number of annotation terms (Fig. 3B; Supplemental Table S8), including ClinGen haploinsufficiency (P = 6.5 × 10⁻⁵; OR = 35.3; 95% CI: 4.2–1621.2), FMRP interactors (P = 8.8 × 10⁻¹⁶; OR = 15.0; 95% CI: 7.3–31.8), dominant diseases (P = 5.1 × 10⁻⁶; OR: 4.7; 95% CI: 2.4–9.2), essential in mice (P = 1.8 × 10⁻¹⁰; OR = 4.6; 95% CI: 2.8–7.3) and GWAS hits (P = 0.02; OR = 1.6; 95% CI: 1.1–2.5). Unlike Ji et al. (2016), we found constrained genes were significantly depleted relative to unconstrained in 123 genes related to recessive diseases (P = 0.001; OR = 0.2; 95% CI: 0.1–0.6) (Fig. 3B).
Gene constraint of PTVs. (A) Increased proportions of constrained (pLI ≥ 0.9), unconstrained (pLI ≤ 0.1), and constraint-classified (pLI ≥ 0.9 or pLI ≤ 0.1) genes with greater sample sizes. (B) (Left) Proportions of constrained versus unconstrained genes of 19,973 Chinese across gene sets. (Right) Enrichment or depletion of constrained genes in the gene sets of interest. P-values and odds ratios with 95% confidence intervals were calculated via two-sided Fisher's exact tests. The dots and lines would appear in red if P < 0.05, otherwise in black. Detailed information is shown in Supplemental Table S8.
Contribution of PTVs to psoriasis
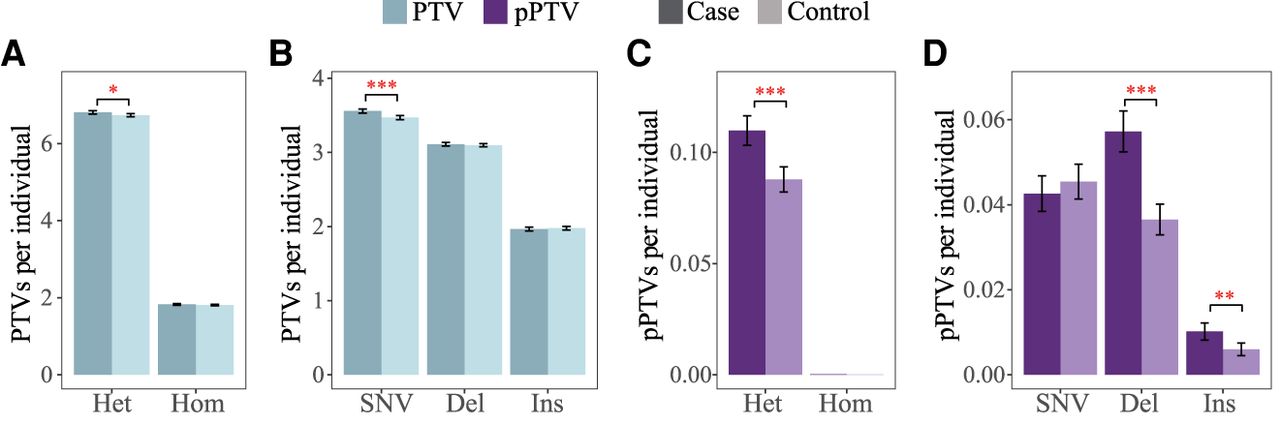
Next, we tested whether patterns of PTVs varied among healthy controls and psoriatic patients. We observed 4909 and 5012 PTVs in 9434 healthy controls and 9434 psoriasis patients, respectively (Supplemental Table S5). Using logistic regression (see Methods), we observed that the burden of PTVs was modestly enriched in psoriasis patients compared to healthy controls (8.6 vs. 8.5 in patients and controls, respectively; P = 0.02, logistic regression). Even though the sequencing depth as a covariate exhibited case-control difference (P < 2.0 × 10⁻¹⁶), the fact that higher sequencing depth was observed in controls compared to those in cases (Supplemental Table S3) made our observations more robust. Similarly, heterozygous PTVs (6.8 vs. 6.7 in patients and controls, respectively; P = 0.04, logistic regression) (Fig. 4A) and PTVs due to SNPs (3.6 vs. 3.5 in patients and controls, respectively; P = 2.4 × 10⁻⁴, logistic regression) (Fig. 4B) were enriched in patients compared to controls. We also observed substantially higher amounts of pPTVs (0.110 vs. 0.088 in patients and controls, respectively; P = 4.4 × 10⁻⁶, logistic regression) and heterozygous pPTVs (P = 4.8 × 10⁻⁶, logistic regression) in cases relative to controls (Fig. 4C; Supplemental Table S9). Note, other subclasses of pPTVs were also significantly different between psoriasis cases and controls (Fig. 4D; Supplemental Table S9). No differences in the proportion of rare and common PTVs were observed among patients and controls (Supplemental Fig. S10).
PTV enrichments in psoriasis patients compared to healthy controls. (A) Per-individual rates of heterozygous and homozygous PTVs and across cases and controls. (B) Per-individual rates of PTVs due to SNVs, deletions, and insertions across cases and controls. (C) Per-individual rates of heterozygous and homozygous pPTVs and across cases and controls. (D) Per-individual rates of pPTVs of SNVs, deletions, and insertions across cases and controls. Note that P-values are calculated through logistic regressions and shown in red if there exists significant difference between psoriasis cases and controls. (*) P < 0.05, (**) P < 0.01, (***) P < 0.001. Detailed information is shown in Supplemental Table S9. (Het) Heterozygotes, (Hom) homozygotes, (Del) deletions, (Ins) insertions.
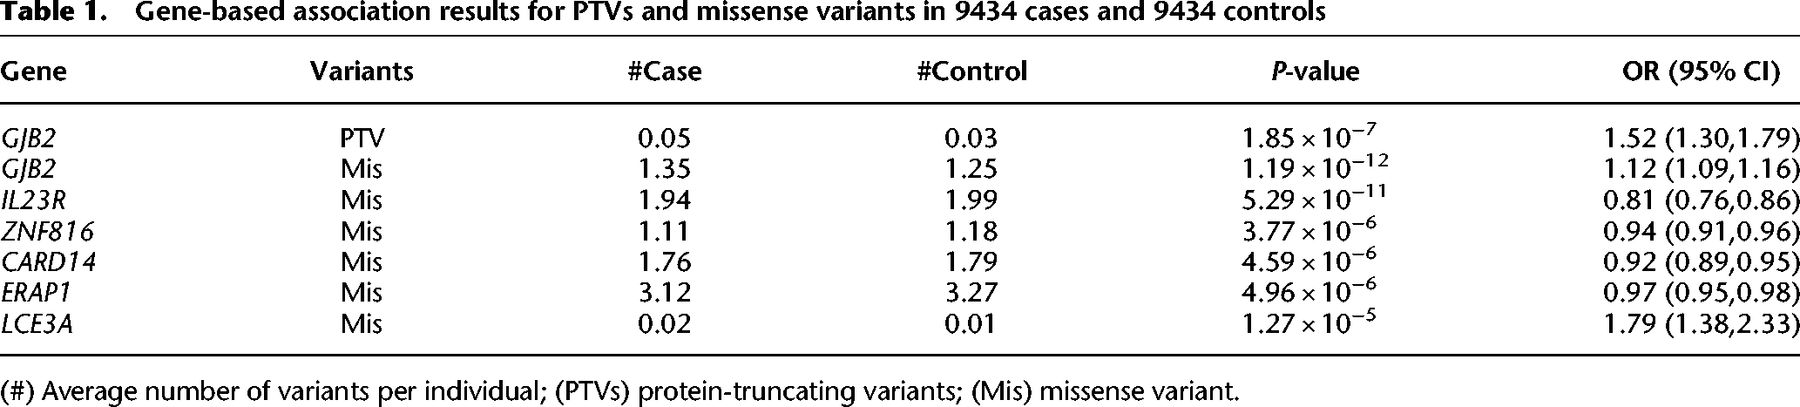
To discover novel genetic risk factors underlying psoriasis, we calculated per-individual counts of PTVs and missense variants at the gene level. Using multiple logistic regression analyses and Bonferroni correction (see Methods), we observed a significant excess of PTVs in GJB2 in psoriasis cases (0.05/person; P = 1.9 × 10⁻⁷; OR = 1.5; 95% CI: 1.3–1.8, logistic regression) compared to controls (0.03/person) (Table 1). We also identified significantly different amounts of missense variants between psoriasis patients and controls in six genes that were previously reported to be associated with psoriasis in the Chinese population (Table 1; Supplemental Fig. S11; Tang et al. 2007; Sun et al. 2010; Qin et al. 2014; Sheng et al. 2014; Shen et al. 2015; Zhou et al. 2016).
Gene-based association results for PTVs and missense variants in 9434 cases and 9434 controls
Signatures of selection among PTVs
We calculated FST (Weir and Cockerham 1984; Akey 2002) to identify PTVs that exhibit high variation in allelic frequencies between Chinese (CHN, n = 19,973), non-Finnish Europeans (NFE, n = 33,370), and Africans (AFR, n = 5203). A total of 18 PTVs in 14 genes (Fig. 5A; Supplemental Table S10) were identified with significant population allele frequency differences (Z[FST] > 4.3; Bonferroni-corrected P < 0.05). Of these 14 genes, 10 were previously reported to be under positive selection. We also detected four novel genes with high FST that were not previously implicated as targets of local adaptation, harboring genes involved in sensory perception of sound (TMPRSS3), drug metabolism and immune response to pathogens (FMO2), and immune response (DMKN, FCGR2A).
PTVs with high population differentiation in allelic frequency between Chinese (CHN), non-Finnish European (NFE), and African (AFR) populations. (A) Target-wide Z(FST) Manhattan plot. Note that Weir and Cockerham FST was normalized and transformed into Z values and the Bonferroni correction set the significant Z(FST) cutoff at 4.3. (B) (Top) Gene structure of FUT2. (Bottom) Nucleotide sequence and allele frequency distribution of a stop-gained G-A PTV (rs601338) with a Z(FST) of 18.5. (C) (Top) Gene structure of EFCAB13 with five PTVs of significant Z(FST). (Bottom) Nucleotide sequence and allele frequency distribution of a splice-acceptor G-A PTV (rs76299620) with a Z(FST) of 12.2.
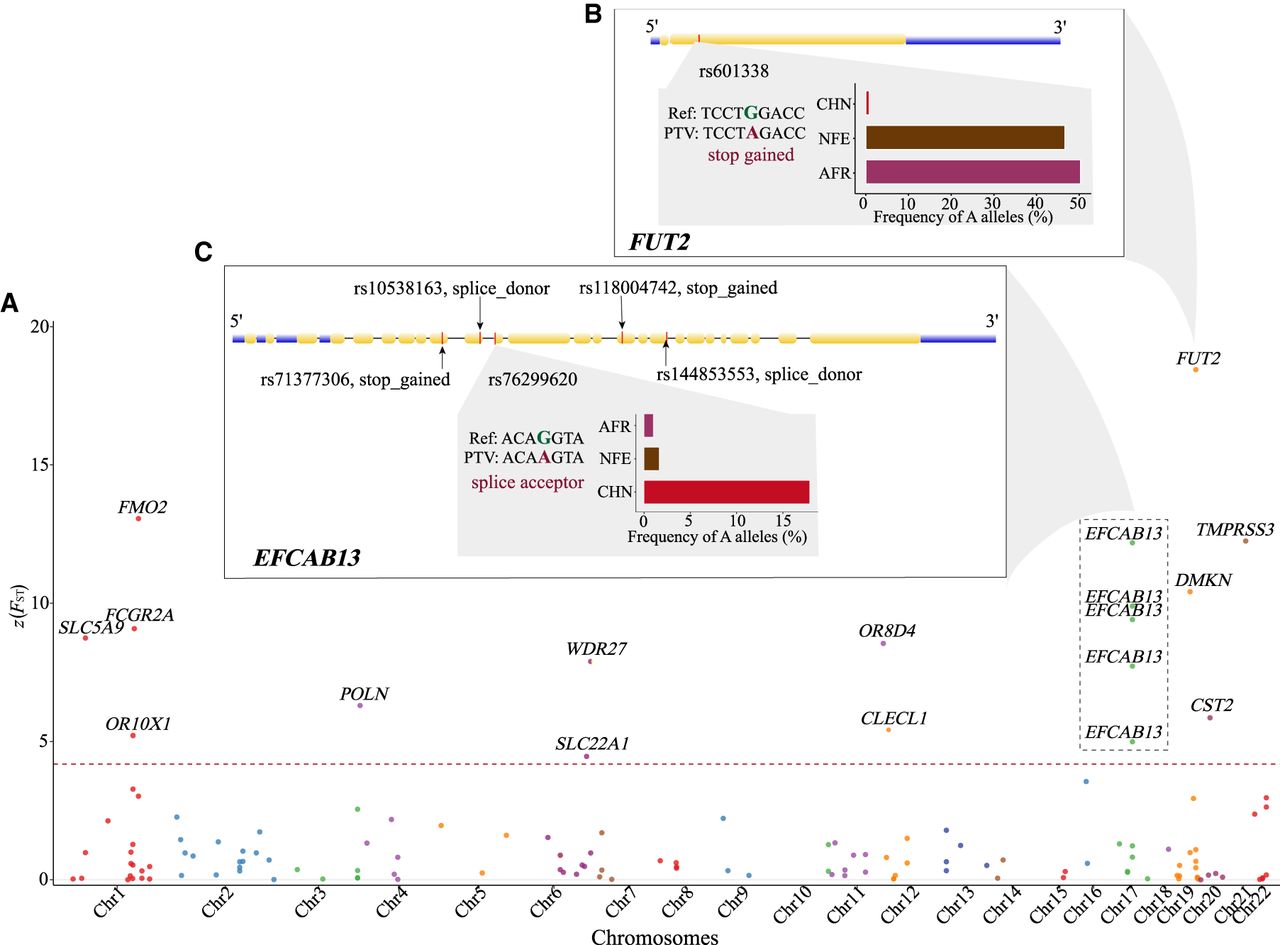
A description of all genes with highly differentiated PTVs is provided in the Supplemental Materials, but here we focus on FUT2 and EFCAB13. FUT2 (Fig. 5B), encodes the enzyme fucosyltransferase 2, which influences the expression of ABO blood group antigens. The lead SNP, rs601338 (Z = 18.5) with increased derived allele frequency in European and Africans, is a stop-gain variant where the reference allele rs601338*G encodes the secretor allele and the rs601338*A variant encodes the nonsecretor allele. The derived allele rs601338*A has been implicated in higher circulating serum vitamin B12 levels, slower progression of HIV, resistance to the Norovirus, and susceptibility to Crohn's disease, type 1 diabetes, celiac disease, and inflammatory bowel disease (Ferrer-Admetlla et al. 2009; MacArthur et al. 2017), possibly via changes in energy metabolism in the gut microbiome (Tong et al. 2014; Galinsky et al. 2016). This SNP is also a very strong expression quantitative trait locus (eQTL) for expression in the esophagus, pancreas, skin, stomach, colon, pituitary, brain, and minor salivary gland in the GTEx data (Karlsson et al. 2014; Carithers and Moore 2015). Previous studies have suggested balancing selection of this SNP (rs601338) in the African and European populations (Ferrer-Admetlla et al. 2009; Ishigaki et al. 2017) and more recent selection in UK Biobank populations (Galinsky et al. 2016). Positive selection of FUT2 was also reported in an East Asian population (Ferrer-Admetlla et al. 2009).
EFCAB13 (EF-hand calcium binding domain 13) includes five PTVs with significantly high FST (Fig. 5C), including a lead SNP splice-acceptor variant of rs76299620 (Z = 12.2). EFCAB13 contains the EF-hand domain, which is indispensable for calcium ion binding and related cellular processes (Safran et al. 2010). Analysis of GTEx data (Carithers and Moore 2015) showed that the EFCAB13 is highly expressed in testis and thyroid but is also widely expressed across many tissue types. EFCAB13 is subject to selection in Africans (Pickrell et al. 2009) and suggestive of recent positive selection in the UK Biobank population (Palamara et al. 2018).
Discussion
Here, we described the largest study of PTVs in the Chinese population to date. Our analysis provides quantitative estimates on the frequency of PTVs at the individual and population levels. However, our study has several limitations. For example, our results are based on 1320 genes, which may not be representative of the exome. Indeed, the 1320 targeted genes are overrepresented with immune-disease-related loci (∼47%) (Methods; Tang et al. 2014) and make up only ∼7% of ∼19,000 human protein coding genes. The overrepresentation of immune-disease loci may account, for example, for why the fraction of deleterious PTVs in these 1320 genes is 0.5%–6% higher compared to whole-exome data in worldwide populations of ExAC (Supplemental Fig. S12).
Our observation that PTVs are enriched in psoriasis patients is consistent with previous studies in psychiatric disorders, including autism spectrum disorder (ASD), amyotrophic lateral sclerosis, intellectual disability, schizophrenia, bipolar disorder, and attention deficit hyperactivity disorder (ADHD) (Ganna et al. 2018; Farhan et al. 2019; Satterstrom et al. 2019). However, Satterstrom et al. (2019) observed that ASD and ADHD cases harbored a significant excess of novel (not found in ExAC), constrained (occurring in genes with a pLI of at least 0.9), and rare (10 copies or fewer in the population) PTVs, whereas we found rates of novel PTVs showed significant differences between psoriasis cases and controls (Supplemental Fig. S13).
We identified 18 PTVs in 14 genes as candidates for positive selection. These results are consistent with the “less is more” hypothesis of adaptive gene loss (Olson 1999), which posits that loss of gene function may play a role in adaptive evolutionary change. Note, however, that large allele frequency differences may also arise from neutral processes such as genetic drift. For example, although rs28369860, a frameshift, has a much higher frequency in the African population compared to the European and East Asian populations (Supplemental Table S10), previous studies showed no evidence of selection in FMO2 (Veeramah et al. 2008). Thus, additional analyses are necessary to fully interpret the evidence for adaptive PTVs in these 14 genes.
In summary, our study complements and extends previous large-scale studies of PTVs (MacArthur and Tyler-Smith 2010; Rivas et al. 2015; Exome Aggregation Consortium et al. 2016; Cassa et al. 2017; Saleheen et al. 2017; DeBoever et al. 2018; Emdin et al. 2018; Ganna et al. 2018; Karczewski et al. 2020; Van Hout et al. 2020) and illustrates the benefits of sampling diverse populations. Our findings help clarify per-individual effects and burdens of PTVs, their contribution to psoriatic disease, and their evolutionary significance.
Methods
Study sample and targeted resequencing
The data set we used in this paper was initiated as independent second-stage validation of 1326 genes after first-stage GWAS discoveries of psoriasis-related loci (Tang et al. 2014). A total of 21,309 samples were collected through collaborations with multiple Chinese hospitals (Sheng et al. 2014; Tang et al. 2014; Zhou et al. 2016; Zhen et al. 2019). All individuals are of Han Chinese ancestry. Involved healthy control subjects were not found with psoriasis, autoimmune diseases, systemic disorders, or family history of psoriasis (including relatives within third-degree). Written informed consent was provided by every participant. The study was reviewed and approved by the Biomedical Ethics Board of Anhui Medical University, Hefei, China.
Targeted 1326 genes included 622 (47.0%) known immune-disease–related genes, which included 57 genes in 44 psoriasis susceptibility loci identified by GWAS. Other selected genes were 742 top genes in the GWAS of whole-exome sequencing of 781 psoriasis cases and 676 controls.
Deep sequencing was performed on 21,309 samples with 3.2 Mb coding sequence of 1326 genes. The details of library construction, targeted region capture, and sequencing were described in previous publications (Sheng et al. 2014; Tang et al. 2014; Zhou et al. 2016). Data preprocessing, including alignments, variant calling, and quality controls, was included in the Supplemental Materials. Note that the GRCh37 build assembly was utilized as reference sequence in our analysis in order to facilitate comparisons to previous PTV studies. The differences between GRCh38 and GRCh37 are most significant for highly repetitive genomic regions (Guo et al. 2017). Thus, because our analyses focused on single-copy exonic sequences, we do not expect our set of PTVs and results to substantially differ between GRCh37 and GRCh38. Genomic coordinates between GRCh38 and GRCh37 can be converted using the liftOver tool provided by the UCSC Genome Browser (Kent et al. 2002).
Definitions of pathogenic PTVs
PTVs are deemed as pathogenic if they meet either of the following two criteria: (1) Annotated as pathogenic or likely pathogenic with star 1+ by ClinVar (i.e., one submitter with assertion criteria, multiple submitters with assertion criteria, expert panel, or practice guideline) (Landrum et al. 2018). Note, that the term “likely pathogenic” is used to mean greater than 90% certainty of a variant being disease-causing (Richards et al. 2015). (2) Annotated as disease-causing mutations (“DM”) by HGMD (Stenson et al. 2017).
Fraction of deleterious or advantageous variants
The fraction of sites under selection pressure (f) was applied to quantify the burden of deleterious PTVs (Moon and Akey 2016). Computation of f involves comparing the site frequency spectrum (SFS) between a class of test sites and a class of putatively neutral variants (synonymous variants). Our tests sites include missense variants, PTVs, and their breakdowns according to CDS position (head: <10%, body: 10%–90%, and tail: >90%), variant types (SNV, insertion, and deletion), consequence (frameshift, splice, and stop-gain), and gene sets defined in the Supplemental Materials. Note that SNVs can cause PTVs through stop-gain or splicing variants, whereas PTVs caused by indels could be due to stop-gain, frameshift, or splicing variants. Positive and negative values of f represent estimates for the fraction of test sites that are under purifying and positive selection, respectively. Estimates of f are robust to various evolutionary and demographic confounding forces (Moon and Akey 2016).
We defined the unfolded SFS as a vector η = (η1, η2, …, ηn−1), where ηi denotes number of sites that comprised i derived alleles and n − i ancestral alleles for a given context. Variants with minimum non-missingness of 99% were selected to compute the unfolded SFS, which resulted in ∼86.0% of targeted sites to be included. We classified ancestral alleles regarding ancestral genome sequence for Homo sapiens (GRCh37), which was constructed by The 1000 Genomes Project Consortium et al. (2015) and available via the website ftp://ftp.1000genomes.ebi.ac.uk/vol1/ftp/technical/reference/human_ancestor_GRCh37_e59.tar.bz2. We only took into consideration biallelic sites with ancestral alleles of high-confidence calls. To account for missing data, we projected SFS down to 99% (19,773/19,973) of samples based on a hypergeometric distribution. We further generated the SFS for Chinese psoriasis cases, Chinese healthy controls, and other worldwide populations in ExAC using the same strategy.
Gene constraint analysis with pLI
We used pLI (Exome Aggregation Consortium et al. 2016) as the probability of being loss-of-function to infer gene constraint and intolerance to PTVs in our Chinese samples. Briefly, we applied ExAC's selection-neutral, sequence context-based mutational model to compare the observed number of rare (minor allele frequency, MAF < 0.1%) variants per gene to an expected number of those after depth correction (Supplemental Fig. S8A–C), then assessed its deviation with a corrected Z score for each mutational class (synonymous, missense, and protein-truncating) (Supplemental Fig. S8D) in 1226 cleaned transcripts. Finally, an expectation-maximization algorithm with inputs of the observed and expected PTV counts within each gene was used to classify genes into three categories: null, where pLI ≤ 0.1 (PTVs are tolerated); recessive, where pLI > 0.1 and pLI < 0.9 (heterozygous PTVs are tolerated); and haploinsufficient, where pLI ≥ 0.9 (heterozygous PTVs are not tolerated). For further details, see Samocha et al. (2014) and Exome Aggregation Consortium et al. (2016). Two-sided Fisher's exact tests were performed to test for enrichments or depletions of constrained genes (pLI ≥ 0.9) in the specific gene set than in the rest of the target genes.
Association study of psoriasis using PTVs
For the individual level of PTV burdens between cases and controls, P-values were calculated via the logistic regression, in which covariates of gender, age, average sequencing depth, and the top 10 principle components (PCs) from LD-pruned sequence data were included to control for possible confounding factors. For calculating gene-level P-values for classes of variants (protein-truncating, synonymous, and missense variants), covariates in the logistic regression model included gender, age, the first 10 PCs, mean depth at sites passing QC, percent of QCed targeted sites covered at a depth of at least 20, and number of corresponding synonymous and missense variants. Gene-based P-values were then subject to Bonferroni correction. The quantile-quantile (QQ) plot of gene-based associations is shown in Supplemental Figure S11.
Population differentiation analysis using FST
FST was calculated for each PTV to quantify allele frequency difference between our Chinese, non-Finnish Europeans, and African samples (Exome Aggregation Consortium et al. 2016). We calculated FST as previously described (Weir and Cockerham 1984; Akey 2002). To determine which lineage(s) the allele frequency changed in, we also calculated three pairwise sets of FST values, which included FST (CHN-NFE), FST (CHN-AFR) and FST (NFE-AFR). We excluded PTVs in which the minor allele has frequency estimates of 0 in at most two populations or for which no data are available for the NFE or AFR populations, which left 1824 PTVs for FST computation. A Bonferroni correction gave 18 PTVs with Z > 4.3 (comparable to P < 0.05/1824) for target-wide significance after normalization of FST.
Data access
All raw sequencing data and locus-based summary of filtered variant calls generated in this study have been submitted to the CNGB Sequence Archive (CNSA, https://db.cngb.org/cnsa/) (Guo et al. 2020) of China National GeneBank DataBase (CNGBdb) under accession numbers CNP0000412 and CNP0001423, respectively. The release of summary data was approved by the Ministry of Science and Technology of China (Project ID: 2021BAT0726).
Competing interest statement
J.M.A. is a paid consultant of Glenview Capital. Other authors declare no competing interests.
Acknowledgments
This work was supported in part by the National Science Fund for Excellent Young Scholars (No. 81222022), National Natural Science Foundation of China (No. 81773313, No. 81573035, No. 81972927, No. 61433009, No. 32000398), Natural Science Foundation of Guangdong Province, China (No. 2017A030306026, No. 2015A030308017), Anhui Institute of Translational Medicine (No. ZHYX2020A005), Guangdong-Hong Kong Joint Laboratory on Immunological and Genetic Kidney Diseases (No. 2019B121205005), and National Institutes of Health grant R01GM110068 (J.M.A.).
Author contributions: L.S., J.M.A., X.J., H.X., and Q.Z. conceived and designed the study; L.S., X.J., and J.M.A. supervised analyses; H.X., Yong Z., L.L., T.Z., Yuanwei Z., and H.Y. conducted data preprocessing and analyses; W.F. and J.M.A. oversaw data quality control; S.M. provided the algorithm and directions to compute and analyze f; L.F., Yong Z., and X.J. provided computation resources; S.L. and R.C. provided feedback to improve manuscript writing; Q.Z., B.L., H.G., W.C., Q.X., Y.Y., L.Y., S.C., H.Z., L.C., R.Z., and X.H. participated in the retrieval of original data and the revision of the manuscript and provided different degrees of contribution to the integration of the manuscript data; M.B., Yuwen Z., Q.Z., X.J., and L.S. performed overall study coordination; H.X., J.M.A., and S.M. designed the figures; H.X. and J.M.A. primarily wrote the manuscript with contributions from all authors.
Notes
[1] Supplementary material [Supplemental material is available for this article.]
[2] Article published online before print. Article, supplemental material, and publication date are at https://www.genome.org/cgi/doi/10.1101/gr.267963.120.
References
- ↵The 1000 Genomes Project Consortium, Sudmant PH, Rausch T, Gardner EJ, Handsaker RE, Abyzov A, Huddleston J, Zhang Y, Ye K, Jun G, 2015. An integrated map of structural variation in 2,504 human genomes. Nature 526: 75–81. 10.1038/nature15394
- ↵Akey JM. 2002. Interrogating a high-density SNP map for signatures of natural selection. Genome Res 12: 1805–1814. 10.1101/gr.631202
- ↵Carithers LJ, Moore HM. 2015. The Genotype-Tissue Expression (GTEx) project. Biopreservation Biobanking 13: 307–308. 10.1089/bio.2015.29031.hmm
- ↵Cassa CA, Weghorn D, Balick DJ, Jordan DM, Nusinow D, Samocha KE, O'Donnell-Luria A, MacArthur DG, Daly MJ, Beier DR, 2017. Estimating the selective effects of heterozygous protein-truncating variants from human exome data. Nat Genet 49: 806–810. 10.1038/ng.3831
- ↵DeBoever C, Tanigawa Y, Lindholm ME, McInnes G, Lavertu A, Ingelsson E, Chang C, Ashley EA, Bustamante CD, Daly MJ, 2018. Medical relevance of protein-truncating variants across 337,205 individuals in the UK Biobank study. Nat Commun 9: 1612. 10.1038/s41467-018-03910-9
- ↵Emdin CA, Khera AV, Chaffin M, Klarin D, Natarajan P, Aragam K, Haas M, Bick A, Zekavat SM, Nomura A, 2018. Analysis of predicted loss-of-function variants in UK Biobank identifies variants protective for disease. Nat Commun 9: 1613. 10.1038/s41467-018-03911-8
- ↵Exome Aggregation Consortium, Lek M, Karczewski KJ, Minikel EV, Samocha KE, Banks E, Fennell T, O'Donnell-Luria AH, Ware JS, Hill AJ, 2016. Analysis of protein-coding genetic variation in 60,706 humans. Nature 536: 285–291. 10.1038/nature19057
- ↵Farhan SMK, Howrigan DP, Abbott LE, Klim JR, Topp SD, Byrnes AE, Churchhouse C, Phatnani H, Smith BN, Rampersaud E, 2019. Exome sequencing in amyotrophic lateral sclerosis implicates a novel gene, DNAJC7, encoding a heat-shock protein. Nat Neurosci 22: 1966–1974. 10.1038/s41593-019-0530-0
- ↵Ferrer-Admetlla A, Sikora M, Laayouni H, Esteve A, Roubinet F, Blancher A, Calafell F, Bertranpetit J, Casals F. 2009. A natural history of FUT2 polymorphism in humans. Mol Biol Evol 26: 1993–2003. 10.1093/molbev/msp108
- ↵Fu W, O'Connor TD, Jun G, Kang HM, Abecasis G, Leal SM, Gabriel S, Rieder MJ, Altshuler D, Shendure J, 2013. Analysis of 6,515 exomes reveals the recent origin of most human protein-coding variants. Nature 493: 216–220. 10.1038/nature11690
- ↵Galinsky KJ, Loh P-R, Mallick S, Patterson NJ, Price AL. 2016. Population structure of UK Biobank and ancient Eurasians reveals adaptation at genes influencing blood pressure. Am J Hum Genet 99: 1130–1139. 10.1016/j.ajhg.2016.09.014
- ↵Ganna A, Satterstrom FK, Zekavat SM, Das I, Kurki MI, Churchhouse C, Alfoldi J, Martin AR, Havulinna AS, Byrnes A, 2018. Quantifying the impact of rare and ultra-rare coding variation across the phenotypic spectrum. Am J Hum Genet 102: 1204–1211. 10.1016/j.ajhg.2018.05.002
- ↵Gilad Y, Bustamante CD, Lancet D, Pääbo S. 2003. Natural selection on the olfactory receptor gene family in humans and chimpanzees. Am J Hum Genet 73: 489–501. 10.1086/378132
- ↵Guo Y, Dai Y, Yu H, Zhao S, Samuels DC, Shyr Y. 2017. Improvements and impacts of GRCh38 human reference on high throughput sequencing data analysis. Genomics 109: 83–90. 10.1016/j.ygeno.2017.01.005
- ↵Guo X, Chen F, Gao F, Li L, Liu K, You L, Hua C, Yang F, Liu W, Peng C, 2020. CNSA: a data repository for archiving omics data. Database J Biol Databases Curation 2020: baaa055. 10.1093/database/baaa055
- ↵Holbrook JA, Neu-Yilik G, Hentze MW, Kulozik AE. 2004. Nonsense-mediated decay approaches the clinic. Nat Genet 36: 801–808. 10.1038/ng1403
- ↵Ishigaki K, Kochi Y, Suzuki A, Tsuchida Y, Tsuchiya H, Sumitomo S, Yamaguchi K, Nagafuchi Y, Nakachi S, Kato R, 2017. Polygenic burdens on cell-specific pathways underlie the risk of rheumatoid arthritis. Nat Genet 49: 1120–1125. 10.1038/ng.3885
- ↵Ji X, Kember RL, Brown CD, Bućan M. 2016. Increased burden of deleterious variants in essential genes in autism spectrum disorder. Proc Natl Acad Sci 113: 15054–15059. 10.1073/pnas.1613195113
- ↵Karczewski KJ, Francioli LC, Tiao G, Cummings BB, Alföldi J, Wang Q, Collins RL, Laricchia KM, Ganna A, Birnbaum DP, 2020. The mutational constraint spectrum quantified from variation in 141,456 humans. Nature 581: 434–443. 10.1038/s41586-020-2308-7
- ↵Karlsson EK, Kwiatkowski DP, Sabeti PC. 2014. Natural selection and infectious disease in human populations. Nat Rev Genet 15: 379–393. 10.1038/nrg3734
- ↵Kent WJ, Sugnet CW, Furey TS, Roskin KM, Pringle TH, Zahler AM, Haussler D. 2002. The Human Genome Browser at UCSC. Genome Res 12: 996–1006. 10.1101/gr.229102
- ↵Kircher M, Witten DM, Jain P, O'Roak BJ, Cooper GM, Shendure J. 2014. A general framework for estimating the relative pathogenicity of human genetic variants. Nat Genet 46: 310–315. 10.1038/ng.2892
- ↵Landrum MJ, Lee JM, Benson M, Brown GR, Chao C, Chitipiralla S, Gu B, Hart J, Hoffman D, Jang W, 2018. ClinVar: improving access to variant interpretations and supporting evidence. Nucleic Acids Res 46: D1062–D1067. 10.1093/nar/gkx1153
- ↵MacArthur DG, Tyler-Smith C. 2010. Loss-of-function variants in the genomes of healthy humans. Hum Mol Genet 19: R125–R130. 10.1093/hmg/ddq365
- ↵MacArthur J, Bowler E, Cerezo M, Gil L, Hall P, Hastings E, Junkins H, McMahon A, Milano A, Morales J, 2017. The new NHGRI-EBI Catalog of published genome-wide association studies (GWAS Catalog). Nucleic Acids Res 45: D896–D901. 10.1093/nar/gkw1133
- ↵Moon S, Akey JM. 2016. A flexible method for estimating the fraction of fitness influencing mutations from large sequencing data sets. Genome Res 26: 834–843. 10.1101/gr.203059.115
- ↵Nielsen R, Bustamante C, Clark AG, Glanowski S, Sackton TB, Hubisz MJ, Fledel-Alon A, Tanenbaum DM, Civello D, White TJ, 2005. A scan for positively selected genes in the genomes of humans and chimpanzees. PLoS Biol 3: e170. 10.1371/journal.pbio.0030170
- ↵Okada Y, Momozawa Y, Sakaue S, Kanai M, Ishigaki K, Akiyama M, Kishikawa T, Arai Y, Sasaki T, Kosaki K, 2018. Deep whole-genome sequencing reveals recent selection signatures linked to evolution and disease risk of Japanese. Nat Commun 9: 1631. 10.1038/s41467-018-03274-0
- ↵Olson MV. 1999. When less is more: gene loss as an engine of evolutionary change. Am J Hum Genet 64: 18–23. 10.1086/302219
- ↵Palamara PF, Terhorst J, Song YS, Price AL. 2018. High-throughput inference of pairwise coalescence times identifies signals of selection and enriched disease heritability. Nat Genet 50: 1311–1317. 10.1038/s41588-018-0177-x
- ↵Pickrell JK, Coop G, Novembre J, Kudaravalli S, Li JZ, Absher D, Srinivasan BS, Barsh GS, Myers RM, Feldman MW, 2009. Signals of recent positive selection in a worldwide sample of human populations. Genome Res 19: 826–837. 10.1101/gr.087577.108
- ↵Qin P, Zhang Q, Chen M, Fu X, Wang C, Wang Z, Yu G, Yu Y, Li X, Sun Y, 2014. Variant analysis of CARD14 in a Chinese Han population with psoriasis vulgaris and generalized pustular psoriasis. J Invest Dermatol 134: 2994–2996. 10.1038/jid.2014.269
- ↵Rehm HL, Berg JS, Brooks LD, Bustamante CD, Evans JP, Landrum MJ, Ledbetter DH, Maglott DR, Martin CL, Nussbaum RL, 2015. ClinGen—the Clinical Genome Resource. N Engl J Med 372: 2235–2242. 10.1056/NEJMsr1406261
- ↵Richards S, Aziz N, Bale S, Bick D, Das S, Gastier-Foster J, Grody WW, Hegde M, Lyon E, Spector E, 2015. Standards and guidelines for the interpretation of sequence variants: a joint consensus recommendation of the American College of Medical Genetics and Genomics and the Association for Molecular Pathology. Genet Med 17: 405–423. 10.1038/gim.2015.30
- ↵Rivas MA, Pirinen M, Conrad DF, Lek M, Tsang EK, Karczewski KJ, Maller JB, Kukurba KR, DeLuca DS, Fromer M, 2015. Human genomics. Effect of predicted protein-truncating genetic variants on the human transcriptome. Science 348: 666–669. 10.1126/science.1261877
- ↵Safran M, Dalah I, Alexander J, Rosen N, Iny Stein T, Shmoish M, Nativ N, Bahir I, Doniger T, Krug H, 2010. GeneCards Version 3: the human gene integrator. Database J Biol Databases Curation 2010: baq020. 10.1093/database/baq020
- ↵Saleheen D, Natarajan P, Armean IM, Zhao W, Rasheed A, Khetarpal SA, Won H-H, Karczewski KJ, O'Donnell-Luria AH, Samocha KE, 2017. Human knockouts and phenotypic analysis in a cohort with a high rate of consanguinity. Nature 544: 235–239. 10.1038/nature22034
- ↵Samocha KE, Robinson EB, Sanders SJ, Stevens C, Sabo A, McGrath LM, Kosmicki JA, Rehnström K, Mallick S, Kirby A, 2014. A framework for the interpretation of de novo mutation in human disease. Nat Genet 46: 944–950. 10.1038/ng.3050
- ↵Satterstrom FK, Walters RK, Singh T, Wigdor EM, Lescai F, Demontis D, Kosmicki JA, Grove J, Stevens C, Bybjerg-Grauholm J, 2019. Autism spectrum disorder and attention deficit hyperactivity disorder have a similar burden of rare protein-truncating variants. Nat Neurosci 22: 1961–1965. 10.1038/s41593-019-0527-8
- ↵Shen C, Gao J, Yin X, Sheng Y, Sun L, Cui Y, Zhang X. 2015. Association of the late cornified envelope-3 genes with psoriasis and psoriatic arthritis: a systematic review. J Genet Genomics 42: 49–56. 10.1016/j.jgg.2015.01.001
- ↵Sheng Y, Jin X, Xu J, Gao J, Du X, Duan D, Li B, Zhao J, Zhan W, Tang H, 2014. Sequencing-based approach identified three new susceptibility loci for psoriasis. Nat Commun 5: 4331. 10.1038/ncomms5331
- ↵Sherry ST, Ward MH, Kholodov M, Baker J, Phan L, Smigielski EM, Sirotkin K. 2001. dbSNP: the NCBI database of genetic variation. Nucleic Acids Res 29: 308–311. 10.1093/nar/29.1.308
- ↵Sjödin P, Bataillon T, Schierup MH. 2010. Insertion and deletion processes in recent human history. PLoS One 5: e8650. 10.1371/journal.pone.0008650
- ↵Stenson PD, Mort M, Ball EV, Shaw K, Phillips A, Cooper DN. 2014. The Human Gene Mutation Database: building a comprehensive mutation repository for clinical and molecular genetics, diagnostic testing and personalized genomic medicine. Hum Genet 133: 1–9. 10.1007/s00439-013-1358-4
- ↵Stenson PD, Mort M, Ball EV, Evans K, Hayden M, Heywood S, Hussain M, Phillips AD, Cooper DN. 2017. The Human Gene Mutation Database: towards a comprehensive repository of inherited mutation data for medical research, genetic diagnosis and next-generation sequencing studies. Hum Genet 136: 665–677. 10.1007/s00439-017-1779-6
- ↵Sun L-D, Cheng H, Wang Z-X, Zhang A-P, Wang P-G, Xu J-H, Zhu Q-X, Zhou H-S, Ellinghaus E, Zhang F-R, 2010. Association analyses identify six new psoriasis susceptibility loci in the Chinese population. Nat Genet 42: 1005–1009. 10.1038/ng.690
- ↵Tang K, Thornton KR, Stoneking M. 2007. A new approach for using genome scans to detect recent positive selection in the human genome. PLoS Biol 5: e171. 10.1371/journal.pbio.0050171
- ↵Tang H, Jin X, Li Y, Jiang H, Tang X, Yang X, Cheng H, Qiu Y, Chen G, Mei J, 2014. A large-scale screen for coding variants predisposing to psoriasis. Nat Genet 46: 45–50. 10.1038/ng.2827
- ↵Tennessen JA, Bigham AW, O'Connor TD, Fu W, Kenny EE, Gravel S, McGee S, Do R, Liu X, Jun G, 2012. Evolution and functional impact of rare coding variation from deep sequencing of human exomes. Science 337: 64–69. 10.1126/science.1219240
- ↵Tong M, McHardy I, Ruegger P, Goudarzi M, Kashyap PC, Haritunians T, Li X, Graeber TG, Schwager E, Huttenhower C, 2014. Reprograming of gut microbiome energy metabolism by the FUT2 Crohn's disease risk polymorphism. ISME J 8: 2193–2206. 10.1038/ismej.2014.64
- ↵Van Hout CV, Tachmazidou I, Backman JD, Hoffman JD, Liu D, Pandey AK, Gonzaga-Jauregui C, Khalid S, Ye B, Banerjee N, 2020. Exome sequencing and characterization of 49,960 individuals in the UK Biobank. Nature 586: 749–756. 10.1038/s41586-020-2853-0
- ↵Veeramah KR, Thomas MG, Weale ME, Zeitlyn D, Tarekegn A, Bekele E, Mendell NR, Shephard EA, Bradman N, Phillips IR. 2008. The potentially deleterious functional variant flavin-containing monooxygenase 2*1 is at high frequency throughout sub-Saharan Africa. Pharmacogenet Genomics 18: 877–886. 10.1097/FPC.0b013e3283097311
- ↵Weir BS, Cockerham CC. 1984. Estimating F-statistics for the analysis of population structure. Evol Int J Org Evol 38: 1358–1370. 10.1111/j.1558-5646.1984.tb05657.x
- ↵Zhen Q, Yang Z, Wang W, Li B, Bai M, Wu J, Ge H, Dong Z, Shen J, Tang H, 2019. Genetic study on small insertions and deletions in psoriasis reveals a role in complex human diseases. J Invest Dermatol 139: 2302–2312.e14. 10.1016/j.jid.2019.03.1157
- ↵Zhou F, Cao H, Zuo X, Zhang T, Zhang X, Liu X, Xu R, Chen G, Zhang Y, Zheng X, 2016. Deep sequencing of the MHC region in the Chinese population contributes to studies of complex disease. Nat Genet 48: 740–746. 10.1038/ng.3576