
Abstract
The AP-1 transcription factor (TF) dimer contributes to many biological processes and environmental responses. AP-1 can be composed of many interchangeable subunits. Unambiguously determining the binding locations of these subunits in the human genome is challenging because of variable antibody specificity and affinity. Here, we definitively establish the genome-wide binding patterns of five AP-1 subunits by using CRISPR to introduce a common antibody tag on each subunit. We find limited evidence for strong dimerization preferences between subunits at steady state and find that, under a stimulus, dimerization patterns reflect changes in the transcriptome. Further, our analysis suggests that canonical AP-1 motifs indiscriminately recruit all AP-1 subunits to genomic sites, which we term AP-1 hotspots. We find that AP-1 hotspots are predictive of cell type–specific gene expression and of genomic responses to glucocorticoid signaling (more so than super-enhancers) and are significantly enriched in disease-associated genetic variants. Together, these results support a model where promiscuous binding of many AP-1 subunits to the same genomic location play a key role in regulating cell type–specific gene expression and environmental responses.
Initially discovered as a driver of oncogenic transformation, AP-1 has since been implicated in a variety of transcriptional mechanisms related to development and disease (Rahman and MacNee 1998; Jochum et al. 2001; Shaulian and Karin 2002; Yin et al. 2002; Eferl and Wagner 2003; Hess et al. 2004; Wagner and Eferl 2005). AP-1 is a dimer composed of members of FOS, JUN, and ATF gene families (Angel et al. 1987; Kouzarides and Ziff 1988; Sassone-Corsi et al. 1988; Karin et al. 1997; Chinenov and Kerppola 2001; Hess et al. 2004). Although only JUN proteins were initially thought to hetero- and homodimerize with all AP-1 subunits (Smeal et al. 1989; Ziff 1990; Ryseck and Bravo 1991), recent studies showed that ATF and FOS can also form homo- and heterodimers (Rodríguez-Martínez et al. 2017; Lambert et al. 2018).
AP-1 binds DNA at 12-O-Tetradecanoylphorbol-13-acetate response elements (TREs) or cyclic AMP response elements (CREs), and either element is necessary for direct binding of AP-1 to DNA (Isakova et al. 2017). However, a TRE or CRE is not sufficient for AP-1 binding as the majority of these elements remain unbound by AP-1 in several cell types (Wang et al. 2012). AP-1 binding is also highly divergent across cell types (The ENCODE Project Consortium 2012). Insufficiency of a binding motif, a property common to many transcription factors (TFs), has inspired efforts to use sequence properties flanking the motif to explain TF binding events (Yáñez-Cuna et al. 2012; Dror et al. 2015). In the case of AP-1, that approach has revealed that cooperative interactions with other TFs can explain AP-1 binding and enhancer activity (Vierbuchen et al. 2017; Chaudhari and Cohen 2018; Fonseca et al. 2019).
AP-1 is a critical mediator of enhancer function (Biddie et al. 2011; Phanstiel et al. 2017; Vierbuchen et al. 2017). However, a challenge in understanding AP-1 dimer function arises from two seemingly contradictory observations: AP-1 subunits are thought to be functionally distinct, yet they bind the genome at a minimally variable DNA binding motif. How distinct dimer configurations and effects are mediated through a largely invariant DNA sequence remains an unanswered question. The distinct functional effects of AP-1 subunits have been demonstrated across numerous loss-of-function studies (Hilberg et al. 1993; Behrens et al. 1999; Eferl et al. 1999; Behrens et al. 2002; Fonseca et al. 2019). Meanwhile, studies to define dimer-specific AP-1 binding motifs in vitro have suggested differences in TRE or CRE affinity (Isakova et al. 2017). Massively parallel reporter assay (MPRA) analyses have also shown that AP-1-mediated cis-regulatory activity depends on sequences beyond the core TRE (Chaudhari and Cohen 2018). It remains unresolved whether AP-1 subunits have biased dimerization partners across the genome, whether different dimers bind to distinct genomic regions, and whether different AP-1 binding classes have different regulatory activity.
Here, we focused on addressing the possibility that AP-1 subunits preferentially dimerize and that different dimers potentiate distinct regulatory effects on gene expression. To do so, we took an unbiased approach to characterize both the distinct genome-wide binding profiles and associated regulatory activity of five AP-1 subunits (JUN, JUNB, JUND, FOSL1, and FOSL2). By using genome-editing to endogenously tag each AP-1 subunit, we were able to determine the genomic binding of each subunit at its native expression level in a way that controls for variation in antibody affinity and specificity. Further, to relate changes in AP-1 subunit occupancy to changes in gene regulation, we focused on the genomic response to glucocorticoids, where AP-1 plays a major role. Together, these analyses provide a highly detailed perspective on the dynamics of AP-1 subunit composition across the human genome and reveal distinct configurations with strong effects on gene regulation.
Results
Genome-editing enables genome-wide characterization of AP-1 subunit binding
Two major limitations when using ChIP-seq to characterize the genome wide binding profiles of each AP-1 subunit are differences in the specificity and the affinity of antibodies. For example, FOS and JUN family members have highly conserved regions that may result in antibody cross-reactivity (Supplemental Fig. S1A,C). Meanwhile, antibodies interacting with different epitopes have different affinities, preventing direct comparison of ChIP-seq analyses of different TFs. To overcome these limitations, we generated a series of A549-derived cell lines with a 3xFLAG epitope inserted at the C terminus of each of seven AP-1 family members: FOS, FOSL1, FOSL2, FOSB, JUN, JUNB, and JUND (Fig. 1A). We directed precise insertion of each FLAG sequence using a CRISPR-Cas nuclease to introduce a double-strand break in the A549 genome and codelivered a homologous recombination donor plasmid containing the 3xFLAG tag and a puromycin resistance gene. After selecting for edited cells with puromycin, we delivered Cre recombinase to remove the resistance gene. The efficiency of gene-editing was evaluated via PCR amplification of the target locus followed by a restriction enzyme digest specific to the 3xFLAG DNA sequence (Supplemental Fig. S1A). Two different Cas nucleases were used because of their ability to target different genomic sites: Lachnospiraceae bacterium Cas12a (LbCas12a) or Streptococcus pyogenes Cas9 (SpCas9) were used to target genomic sites with a TTTN or NGG sequence, respectively. During tagging experiments, guides for each Cas nuclease were tested individually for their ability to mediate precise genome editing. We intentionally used polyclonal tagged lines to avoid clone-specific effects that could confound our analysis (Ben-David et al. 2018).
Characterization and dissection of AP-1 subunit occupancy. (A) Schema depicting the genome-engineering strategy. (B) Western blot of engineered cell lines, confirming tagging of the desired gene. (C) Bar plot showing the distribution of AP-1 binding classes across the genome defined by the varying levels of subunit occupancy in response to dexamethasone. (D) Browser tracks of various AP-1 binding configurations. Chromatin signatures and TF occupancy at sites enriched by various AP-1 configurations after GR activations in A549 cells are shown. The identified configurations are depicted by red (AP-1 hotspots), blue (dimer), and green (singleton), respectively. (E) Sitepro plot showing the AP-1 motif per bp per peak for distinct AP-1 binding classes. P-values were calculated using a two-sided Student's t-test based on the normalized motif density within a 1-kb window of peaks. (***) P < 0.001. (F) Sitepro plot showing 95% confidence intervals (C.I.) for the differences in the normalized AP-1 motif density between different AP-1 binding classes across flanking regions of peaks; 95% C.I.’s were calculated using a two-sided Student's t-test based on each of a 7-bp sliding window from the center of the peaks. (G) Sitepro plot showing DNA shape information featured by propeller twist for each AP-1 binding class. P-values were calculated using a two-sided Student's t-test based on quantified DNA shape information within a 100-bp window centered on the motif. (***) P < 0.001, not significant (N.S.) = P > 0.05. (H) Sitepro plot showing GC-matched sequence conservation defined by phastCons100way scores for each AP-1 binding class. P-values were calculated using a two-sided Student's t-test based on the phastCons100way scores within a 400-bp window centered on the motif. (***) P < 0.001, N.S. = P > 0.05.
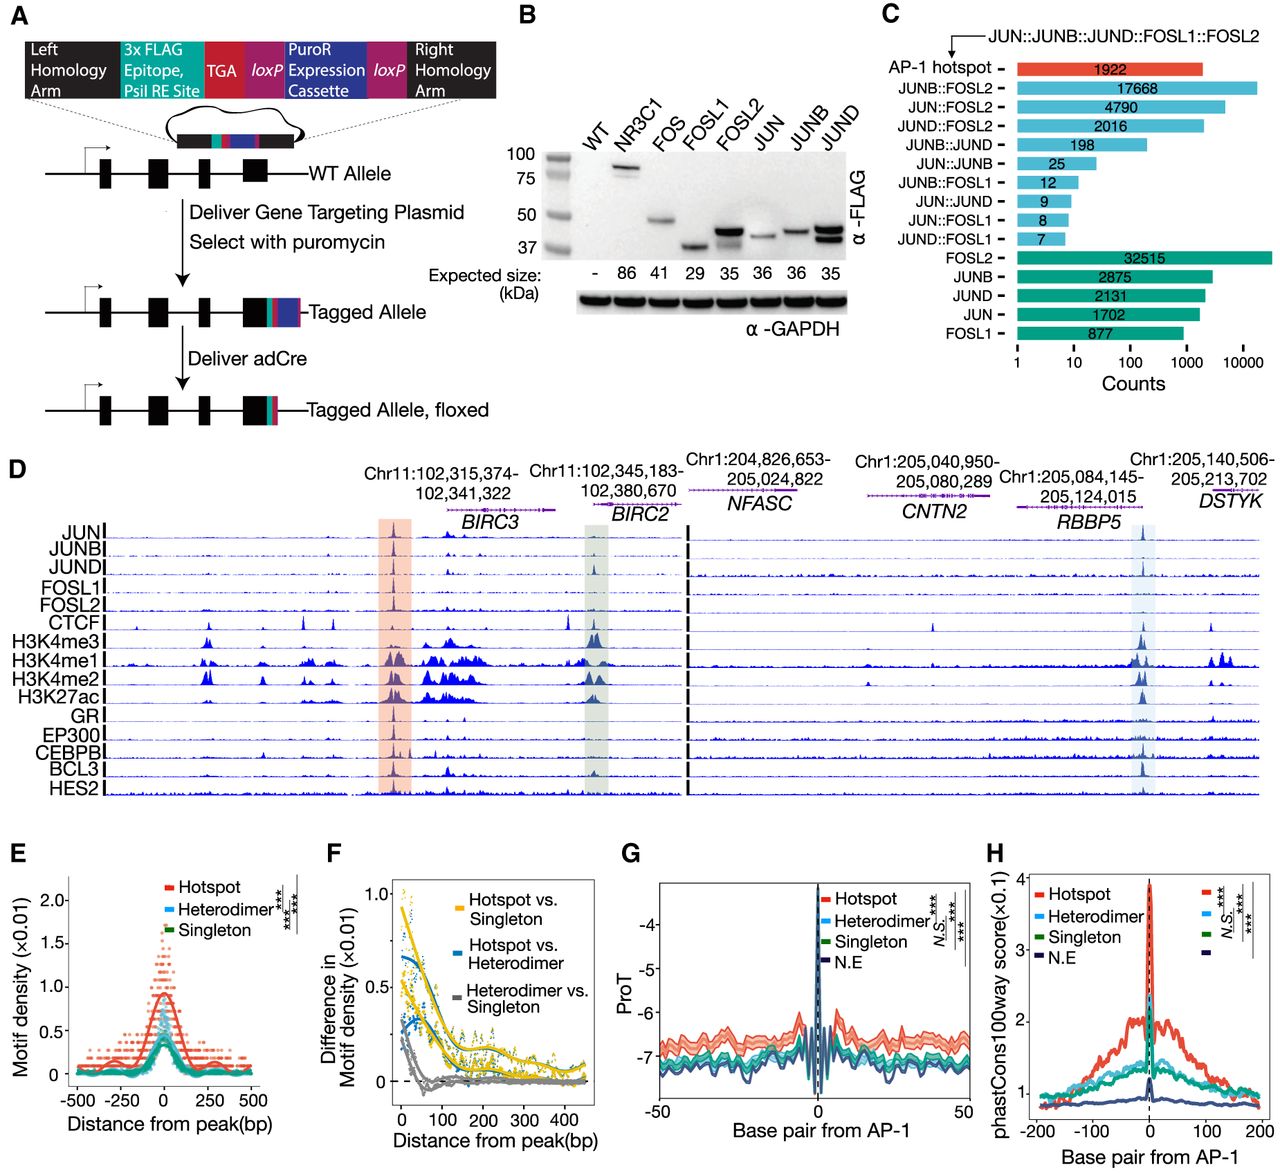
Across eight genes and 16 gRNAs, we observed tagging efficiencies varying from 5% to 50% of alleles (Supplemental Fig. S1B). As a positive control for the ChIP, we also tagged the gene encoding the glucocorticoid receptor (GR), NR3C1, which we have previously characterized with ChIP-seq using several different antibodies against the endogenous protein (McDowell et al. 2018). All targeted genes were detected via western blot, except for FOSB, which has lowly expressed levels in A549 cells and was excluded from further analysis (Fig. 1B). Each tagged protein also had glucocorticoid (GC)-dependent changes in expression, consistent with the known GC-dependent regulation of those genes in unedited A549 cells. That result demonstrates that endogenous regulation of the tagged genes was maintained over the tagging procedure (Supplemental Fig. S2). To characterize the genome-wide binding patterns of each AP-1 subunit, we completed ChIP-seq on each tagged line using an anti-FLAG antibody to recognize the tagged subunits. We estimated between 2568 and 64,058 binding sites across the different data sets generated (Supplemental Fig. S3A). Occupancy correlated with the RNA and protein levels of each subunit, suggesting that differences in signal strength resulted from subunit concentration in the cell (Supplemental Fig. S3B). Results from ChIP-seq of FLAG-tagged AP-1 subunits were highly consistent with those from unmodified AP-1 subunits, indicating that the tagging procedure preserves their inherent binding and dimerization features (Supplemental Fig. S3C). Data for FOS yielded a very low number of called ChIP-seq peaks, likely due to low FOS expression, and were excluded from further analysis (Fig. 1B).
AP-1 subunit binding is enriched in hotspots across the human genome
ChIP-seq revealed that AP-1 subunits have a wide range of binding configurations across the genome (Supplemental Fig. S4A,B). We first sought to determine which AP-1 subunits preferentially dimerize across the genome. To do so, we used a permutation test that keeps the binding frequency of each AP-1 subunit constant within each chromosome. We first computed the null distribution of AP-1 subunit colocalization under a model of random AP-1 dimerization and then compared that to the colocalization patterns observed in our ChIP-seq data. We observed no dimerization preferences between subunits above background levels predicted by the null model (Supplemental Fig. S5A). The configuration of AP-1 binding that was most enriched over a null model was the configuration where all AP-1 subunits occupied the same site. That result suggests that AP-1 subunits often converge to the same genomic sites (Supplemental Fig. S5A). Two possibilities that we cannot distinguish are that AP-1 subunits dimerize nonspecifically when binding those sites, or that they dimerize specifically to those sites and the nature of ChIP-seq as a population average merely gives the appearance of nonspecific dimerization. We did observe enriched JUNB-FOSL2 colocalization after activating glucocorticoid receptor signaling (Supplemental Fig. S5A). JUNB and FOSL2 mRNA are similarly expressed, and both increase by ∼2× with glucocorticoid treatment, suggesting that preferential dimerization may reflect increased expression of the two subunits rather than preferential dimerization (Supplemental Fig. S5B).
The enrichment for regions where all tested AP-1 subunits bind led us to investigate if these genomic sites have greater regulatory activity. To evaluate the functional distinction of these sites, we classified genomic sites occupied by AP-1 subunits into three classes: (1) AP-1 hotspots, where all assayed subunits colocalize; (2) putative AP-1 heterodimers, where a pair of subunits exclusively colocalize; and (3) AP-1 singletons, where only a single subunit was detected (Fig. 1C,D). As negative controls, we selected genomic loci containing an AP-1 motif but that did not have evidence of AP-1 binding in our ChIP-seq analysis (no enrichment [N.E.]).
Several sequence features distinguished AP-1 hotspots from other AP-1 binding sites. While located at more promotor-distal regions (Supplemental Fig. S5C,D), AP-1 hotspots had more instances of AP-1 motifs (Fig. 1E). That enrichment occurs throughout ChIP-seq peaks but especially within 50 bp of the location with maximal ChIP-seq signal (Fig. 1F). Compared to other genomic sites bound by AP-1 but not called as hotspots, the hotspots also have a distinct DNA shape and are more evolutionarily conserved (Fig. 1G,H). ChIP-seq signal for all AP-1 subunits was highest in AP-1 hotspots (Supplemental Fig. S6), a finding concordant with the enrichment of AP-1 motifs. However, we did not observe any consistent difference in the quality of AP-1 motifs between hotspots and other regions (Supplemental Fig. S5E). The frequency of AP-1 hotspots waned over a time course of the glucocorticoid dexamethasone (dex) exposure (Supplemental Fig. S5F), which is consistent with decreasing expression of JUN, JUND, and FOSL1 (Supplemental Fig. S5B) and GR (McDowell et al. 2018). Together, these features suggest that underlying DNA sequences and sequence features contribute to the formation of AP-1 hotspots.
AP-1 hotspots are distinct from super-enhancers
We next evaluated whether AP-1 hotspots are distinct from super-enhancers, which also feature clusters of TF-bound regulatory elements (Hnisz et al. 2013). The enriched occupancy of master regulators and coactivators in super-enhancers reflects their role in regulating cell type–specific gene expression (Parker et al. 2013; Whyte et al. 2013), and it may be that AP-1 hotspots are part of that underlying mechanism.
To compare the role of AP-1 hotspots and super-enhancers in regulating gene expression, we evaluated changes in genomic state and gene expression over a time course of treatment with dex. AP-1 interacts with the glucocorticoid receptor and influences its gene regulatory activity (Vockley et al. 2016). Specifically, we evaluated genomic changes after 1 h, 4 h, 8 h, and 12 h of constant 100-nM dex treatment. Through ChIP-seq signal-based rank ordering of H3K27ac-marked nucleosomes (Whyte et al. 2013), we identified between ∼700 and 1000 super-enhancers at the different time points of dex treatment. Overall, AP-1 hotspots are a largely distinct from super-enhancers, with only 15% overlapping, on average. For comparison, 70% of AP-1 hotspots overlap H3K27ac-marked putative enhancers that are not super-enhancers (Fig. 2A). The number of super-enhancers embedded with AP-1 hotspots ranges from 103 (14.7%) to 205 (20.8%). Moreover, whereas super-enhancers are enriched across all configurations of AP-1 binding (P < 2.5 × 10−68 for all comparisons, Fisher's exact test), super-enhancers are least enriched in hotspots (odds ratio = [3.7, 5.0] for AP-1 hotspots; odds ratio = [4.2, 5.2] for AP-1 heterodimers; odds ratio = [5.5, 6.6] for AP-1 singletons), further indicating that super-enhancers are more distinct from AP-1 hotspots than from other AP-1 binding configurations (Fig. 2B).
Genomic and chromatin landscape of distinct AP-1 configurations. (A) The distribution of proportion that AP-1 hotspots are localized within super-enhancers and typical enhancers marked by H3K27ac before and after dex treatment. (B) Bar plot showing the odds ratio between super-enhancers and different AP-1 configurations after GR activation. Error bars represent 95% confidence intervals at a given time point. (C) Relative de novo motif enrichment of AP-1 hotspots. Z-scores are based on distribution of significances for given motifs using bootstrapped replicates of other AP-1 binding modes that matched in number for a de novo motif enrichment test. Significant motifs are highlighted. (D) Spatial distribution of TFs and histone marks for distinct AP-1 binding classes. P-values were calculated using a two-sided Student's t-test based on ChIP-seq signal intensity within 1 kb centered on each peak. (***) P < 0.001, N.S. = P > 0.05.
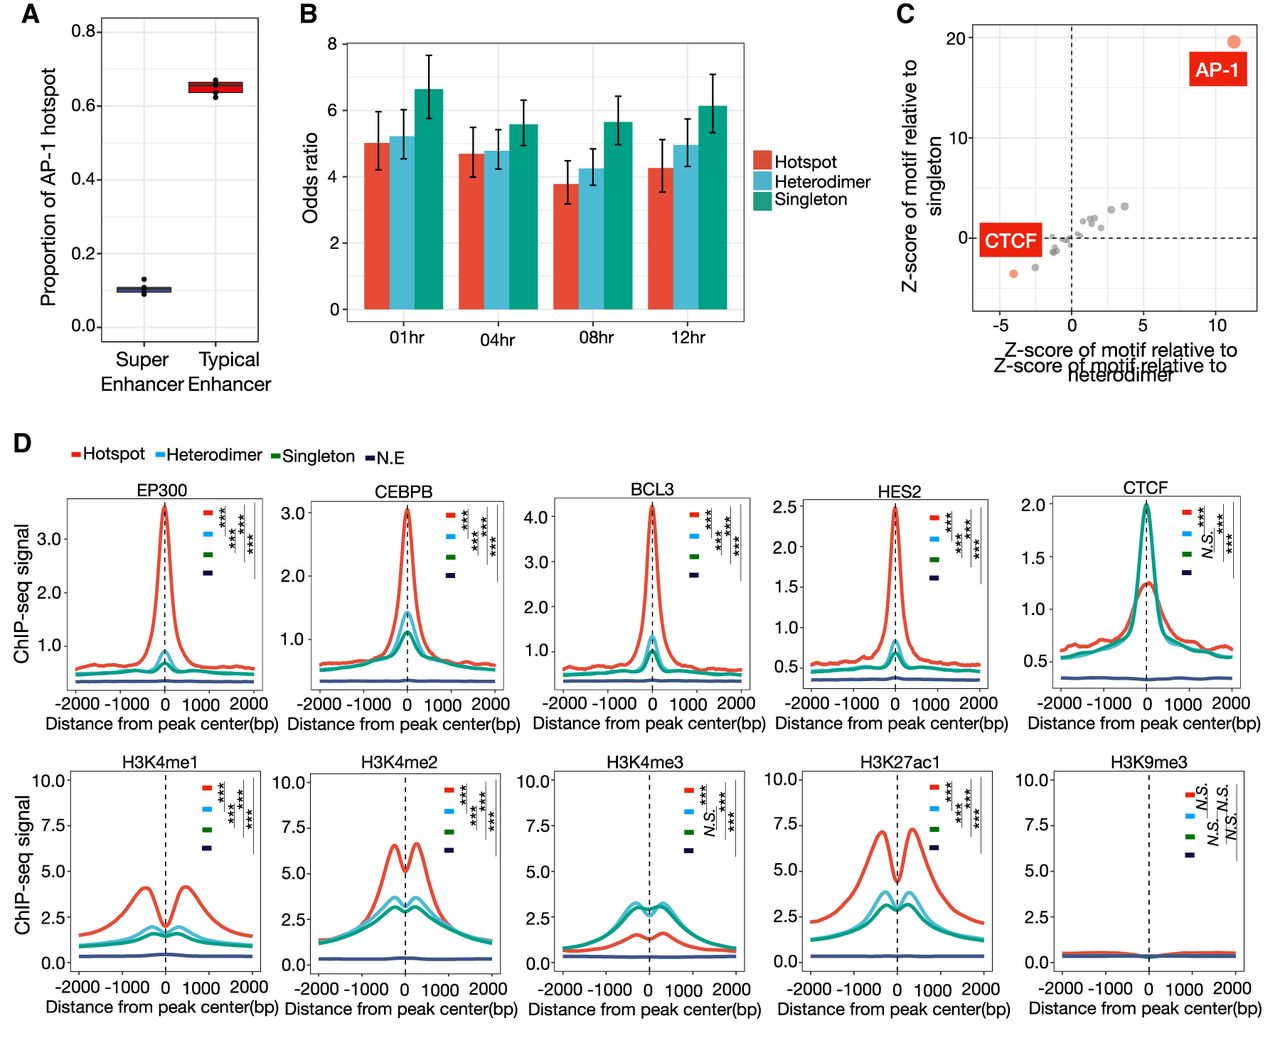
To further characterize genomic features that make AP-1 hotspots distinct, we investigated which genetic and genomic features most correlate with the presence of AP-1 hotspots versus other configurations of AP-1 binding. We first investigated TF DNA binding motifs. To control for false positives resulting from large differences in the number of genomic sites tested, we calculated z-scores of motifs for hotspots based on the distribution of significance for motifs built from 1000 bootstrapped replicates matched in the number of sites tested. As expected, the AP-1 DNA binding motif was strongly enriched, but we also found significant depletion of the CTCF relative to other AP-1 sites (Fig. 2C).
We next tested for differences in TF binding and chromatin state. To do so, we compared the ChIP-seq binding signal for numerous other TFs in the same cells (McDowell et al. 2018). To reduce confounding effects due to differences in chromatin accessibility, we matched sites according to DNase-seq signal when comparing between classes. We also confirmed that all defined AP-1 classes minimally localized to heterochromatin marked by H3K9me3 (Fig. 2D). In untreated cells, AP-1 hotspots were highly enriched for binding of enhancer-associated factors, including the histone E1A binding protein p300 (EP300), and many sequence-specific transcription factors, including CCAAT enhancer binding protein beta (CEBPB), BCL3 transcription coactivator (BCL3), hes family bHLH transcription factor 2 (HES2), TEA domain transcription factor 4 (TEAD4), and SMAD family member 3 (SMAD3) (Fig. 2D; Supplemental Fig. S7A,B). These enrichments suggest that AP-1 hotspots correspond to genomic sites with high and active regulatory effects on gene expression. That possibility is further supported by the enrichment of acetylation of H3 lysine 27 (H3K27ac) and monomethylation of H3K4 (H3K4me1) (Fig. 2D). In contrast, H3K4 tri-methylation (H3K4me3) was relatively depleted at AP-1 hotspots, suggesting a particular role in active enhancer activity (Liu et al. 2016). In concordance with the depletion of the CTCF DNA binding motif, AP-1 hotspots had the least CTCF binding signal of the three defined classes (Fig. 2D). Further, AP-1 hotspots located at CTCF-driven loop anchors show significantly less binding of several TFs than hotspots at loop anchors without CTCF binding (Supplemental Fig. S7C), suggesting that hotspots exert their high regulatory effects on transcription largely absent local CTCF. This observation is consistent with a previous study demonstrating that CTCF-driven loop anchors are largely invariant in response to dex and that interactions that are dynamic after GR activation are depleted of CTCF (D'Ippolito et al. 2018). Taken together, our results suggest that AP-1 hotspots are a class of genomic site that act as independent functional hubs with high regulatory potential on transcription.
AP-1 hotspots coupled with EP300 predetermine GR occupancy across the genome
The glucocorticoid receptor is well known to cooperate with AP-1 (Biddie et al. 2011; Gertz et al. 2013; Vockley et al. 2016), leading us to test whether AP-1 hotspots may be particularly potent coregulatory complexes. We first focused on testing for significant colocalization between transcription factors for different AP-1 binding modes in response to glucocorticoid treatment. The vast majority of AP-1 hotspots were localized close to GR binding sites, and GR binding was most enriched within AP-1 hotspots (Fig. 3A,C), suggesting strong cooperativity between AP-1 hotspots and GR in gene regulation. There was also enriched genomic occupancy of several additional transcription factors, including EP300, in AP-1 hotspots (Fig. 3B,D; Supplemental Fig. S8A–H). Further, we confirmed that, among different AP-1 binding modes, AP-1 hotspots have the highest glucocorticoid-responsive regulatory activity measured by whole-genome STARR-seq (Fig. 3E; Johnson et al. 2018).
Genomic landscape of various AP-1 binding modes in glucocorticoid response. (A) Cumulative distribution of relative distance of AP-1 binding classes to the nearest genomic loci occupied by GR. (B) Heat map showing the means of the Jaccard index of overlaps between AP-1 classes and genomic occupancies of TFs. The means are based on the distribution of the indexes from bootstrapped replicates of genomic regions that matched in number. (C–E) Spatial distribution of dex-responsive TFs and histone marks for distinct AP-1 binding classes: (C) glucocorticoid receptor (GR); (D) coactivator EP300; (E) enhancer activity defined by genome self-transcribing active regulatory region-seq (STARR-seq). P-values were calculated using a two-sided Student's t-test based on ChIP-seq signal intensity within 1 kb centered on each peak. (***) P < 0.001. (F) The distribution of proportions of dynamic GR bindings explained by pre-established factors including AP-1s, EP300, and super-enhancers at a pre-dex time point.
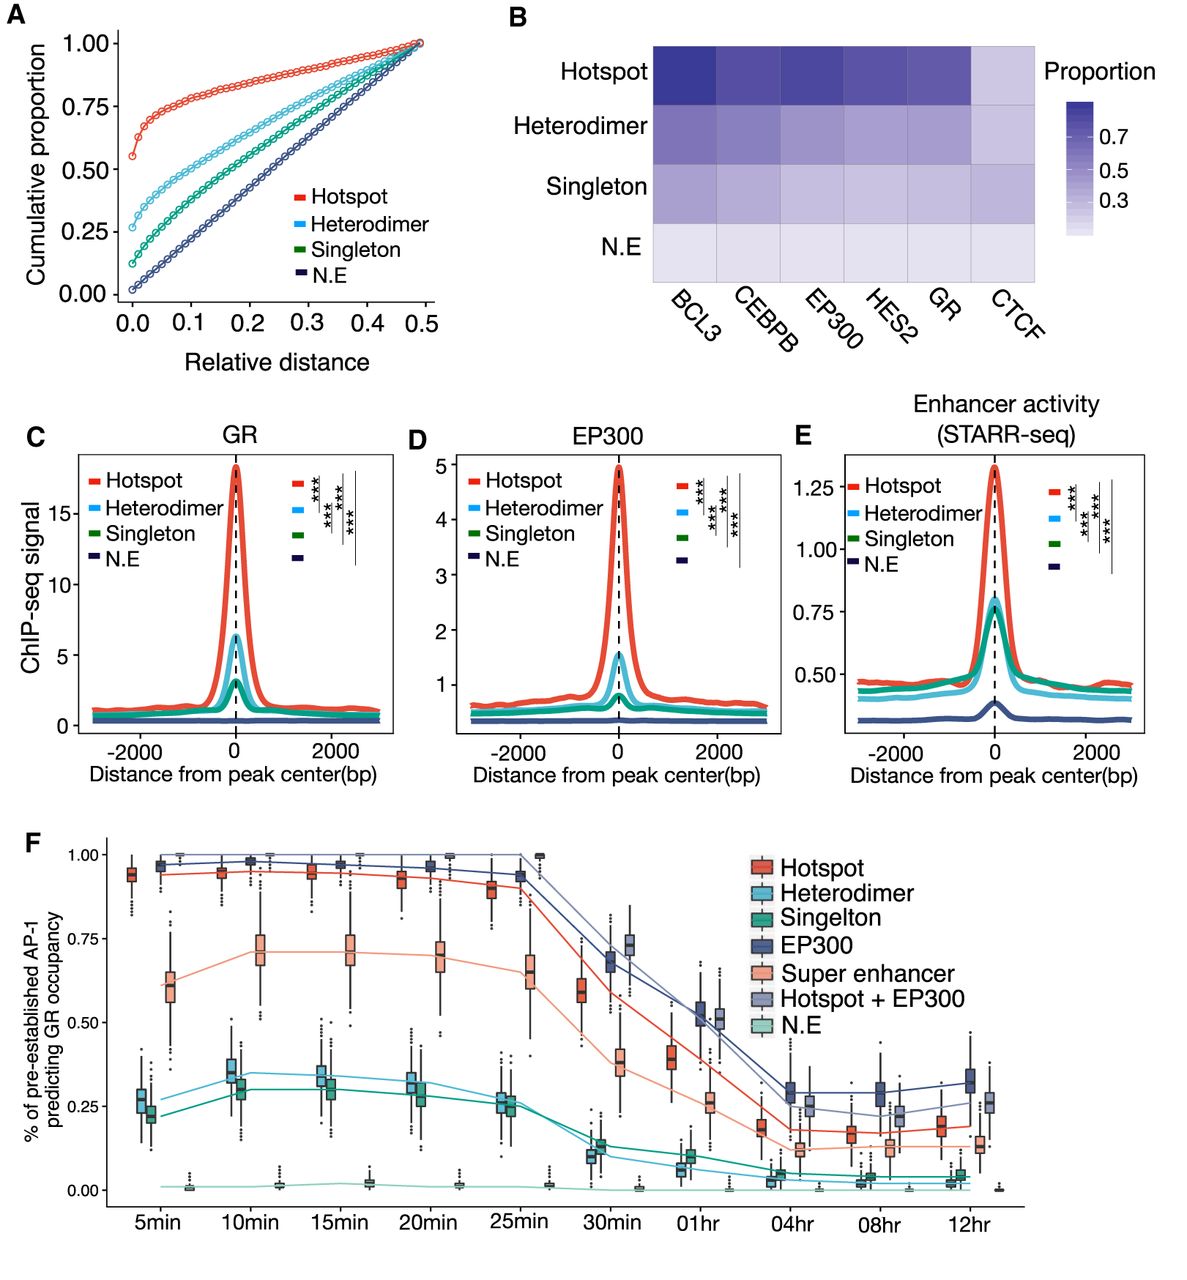
GR largely binds sites with high DNase accessibility (John et al. 2008; John et al. 2011) and, by extension, predominantly colocalizes with EP300 at enhancers (McDowell et al. 2018). To investigate the extent to which various AP-1 binding modes predetermine subsequent genomic occupancy of GR after dex treatment, we predicted GR binding with various regulatory factors. Prior to dex exposure, pre-established AP-1 hotspots predetermined GR occupancy at a significantly higher rate than other AP-1 configurations (P < 10−100, Mann–Whitney U test) (Fig. 3F). In particular, nearly all AP-1 hotspots were bound by GR <30 min after activation. Meanwhile, pre-established super-enhancers and non-super-enhancers both predict early GR binding to a much lesser extent (∼35% and 28% on average, respectively). EP300-enhancers were also extensively associated with early GR occupancy which is consistent with previous results (McDowell et al. 2018), and it may be that the two phenomena are closely linked.
Glucocorticoid-dependent changes in AP-1 hotspots are associated with changes in GR binding and gene expression
We next sought to determine if different configurations of AP-1 binding had different effects on gene expression responses. Although it is difficult to discern AP-1's contribution to enhancer activity under steady state conditions, temporal changes in AP-1 binding in response to glucocorticoid treatment allow us to observe the effects on gene expression. Thus, we analyzed RNA-seq and ChIP-seq data across a 12-h time course of 100 nM dex exposure (McDowell et al. 2018). We first evaluated if gains or losses of AP-1 corresponded to changes in the expression of candidate target genes. Target genes were predicted in three different ways: (1) statistical associations with expression in lung cells (The GTEx Consortium 2015); (2) Hi-C chromatin interaction maps coupled with chromatin accessibility (DNase-seq) and active enhancer markers (H3K27ac) (D'Ippolito et al. 2018; McDowell et al. 2018; Fulco et al. 2019); and (3) linear proximity in the genome.
Changes in AP-1 hotspots were linked to more potent changes in gene expression than those of other AP-1 binding classes. In particular, dex-dependent gains of AP-1 binding at hotspots were positively associated with dex-dependent increases in gene expression (Fig. 4A–C), regardless of the approach for predicting target genes (P = 4.1 × 10⁻⁵ for hotspots vs. heterodimer, P = 3.2 × 10⁻⁴ for hotspots vs. singleton, Wilcoxon test at 12 h from eQTL). A similar effect was noted when only considering GR binding sites. Specifically, GR binding sites that overlap AP-1 hotspots had greater regulatory activity and greater effects on gene expression (Supplemental Fig. S9A,B). That was despite there being stronger GR ChIP-seq signal at sites that lack AP-1 (Supplemental Fig. S9A).
Changes in AP-1 hotspot binding link to changes in gene expression. (A–C) Temporal gene expression trajectory plot showing log2 fold change in gene expression mapped to the gains of each AP-1 binding classes in response to dex according to (A) eQTLs, (B) Activity by Contact defined by Hi-C coupled with chromatin accessibility (DNase-seq) and H3K27ac, and (C) the proximity to the nearest genes. (D–F) Temporal gene expression trajectory plot showing log2 fold change in gene expression mapped to the losses of each AP-1 binding classes in response to dex according to (D) eQTLs, (E) Activity by Contact, and (F) the proximity to the nearest genes. (G–I) Temporal gene expression trajectory plot showing log2 fold change in gene expression mapped to maintained AP-1 binding classes in response to dex according to (G) eQTLs, (H) Activity by Contact, and (I) the proximity to the nearest genes. P-values were calculated using a Wilcoxon rank-sum test based on changes in log2 folds at 12 h. (**) P < 0.01, (***) P < 0.001, N.S. = P > 0.05.
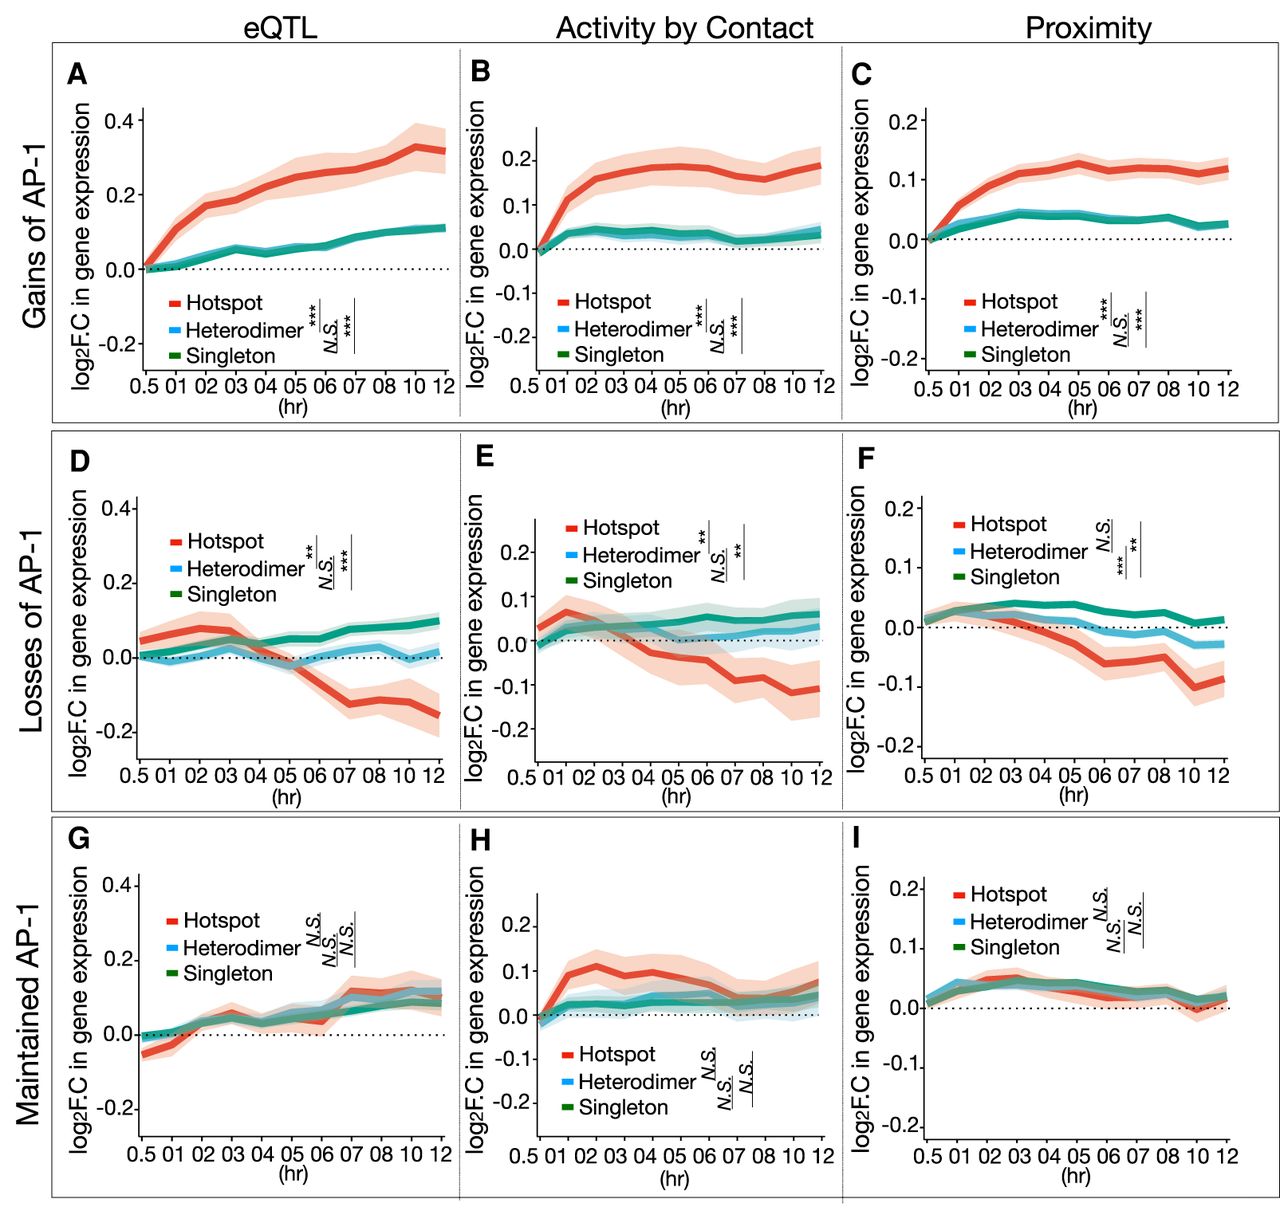
Conversely, dex-dependent loss of AP-1 binding was correlated with decreased target gene expression, again independent of the approach for predicting target genes (P = 0.009 for hotspots vs. heterodimer, P = 0.0004 for hotspots vs. singleton, Wilcoxon test at 12 h from eQTL) (Fig. 4D–F).
GR bound transiently to sites that lost AP-1 hotspots. After 5 min of dex exposure, 85.6% of lost AP-1 hotspots had GR binding signal (Supplemental Fig. S9C), an extreme overlap not observed across 1000 permutations. In comparison, after 1 h of dex treatment, GR binding signal was substantially reduced to be present at 47.4% of lost AP-1 hotspots, and GR ChIP-seq signal was lowest for those AP-1 hotspot-lost sites compared to those that gained or maintained AP-1 hotspots (Supplemental Fig. S9D). One possibility is that GR binding occurs transiently at sites that lose AP-1 hotspots and that subsequent repression of those sites leads to a loss of both AP-1 and GR.
Finally, stable AP-1 binding sites had minimal association with changes in target gene expression (Fig. 4G–I). These results suggest that AP-1 hotspots have higher transcriptional regulatory effects than other classes, and, by extension, the gain or loss of AP-1 hotspots is more likely to result in the activation or repression of genes, respectively.
AP-1 hotspots are divergent between cell types and predict cell-specific environmental responses
To determine if the distinct features of AP-1 hotspots generalize beyond the A549 cell model studied here, we performed a similar set of analyses for a previously published data set of AP-1 subunit occupancy in a human immortalized myelogenous leukemia cell line (K562) (Xie et al. 2013). Using the same definition of AP-1 hotspots, we identified 4428 such sites, approximately fourfold more than that observed in A549 cells (Fig. 5A,B). Consistent with AP-1 motif enrichment patterns in A549 cells, AP-1 hotspots in K562 cells had enriched AP-1 motifs compared to other AP-1 binding modes, demonstrating that distinct sequence features broadly contribute to the formation of hotspots (Fig. 5C). Also, as in A549 cells, AP-1 hotspots were enriched for active enhancer-associated factors such as EP300 and depleted for cohesin subunits, including CTCF, RAD21, and SMC3 (Supplemental Fig. S10A–F).
Distinct genomic and regulatory features of cell type–specific AP-1hotspots. (A) Bar plot showing the number of distinct AP-1 binding modes including AP-1 hotspots, AP-1 heterodimer, and singleton in A549 and K562 cells. (B) Venn diagram showing overlap between AP-1 hotspots in A549 and K562. (C) Sitepro plot showing the AP-1 motif per bp per peak for distinct AP-1 binding classes in K562 cells. P-values were calculated using a two-sided Student's t-test based on the normalized motif density within 1 kb of peaks. (***) P < 0.001. (D) Box plots showing the distribution of rank-correlation for TFs and histone marks between cell type–specific and –shared AP-1 hotspots. Each rank-correlation is based on the effect size for the Mann–Whitney U test between size- and number-matched bootstrapped replicates from cell type–specific and –shared AP-1 hotspots for binding activity of TFs. (E) Cumulative distribution of distance to nearest TSS for cell type–specific and –shared AP-1 hotspots. (F) Bar plot displaying the proportion of cell type–specific and –shared AP-1 hotspot loci by genomic annotation. (G) Bar plot showing the distribution of log2 fold change in gene expression in response to dex at a 12-h time point by genomic annotation for pre-established cell type–specific and –shared AP-1 hotspots. y-axis represents genomic annotations: (a) TSS, (b) Promoter-TSS, (c) Noncoding, (d) Intron, (e) Intergenic, (f) Exon, (g) 5′ UTR, and (h) 3′ UTR. (H) MSigDB Perturbation ontology enrichment using the genomic region-based binomial test for cell type–specific AP-1 hotspots in A549 and K562 cells. y-axis shows the cell type used in the perturbation study (Cell type, PubMed PMID for each data set). The color and size of dots represent the cell types and adjusted P-value, respectively.
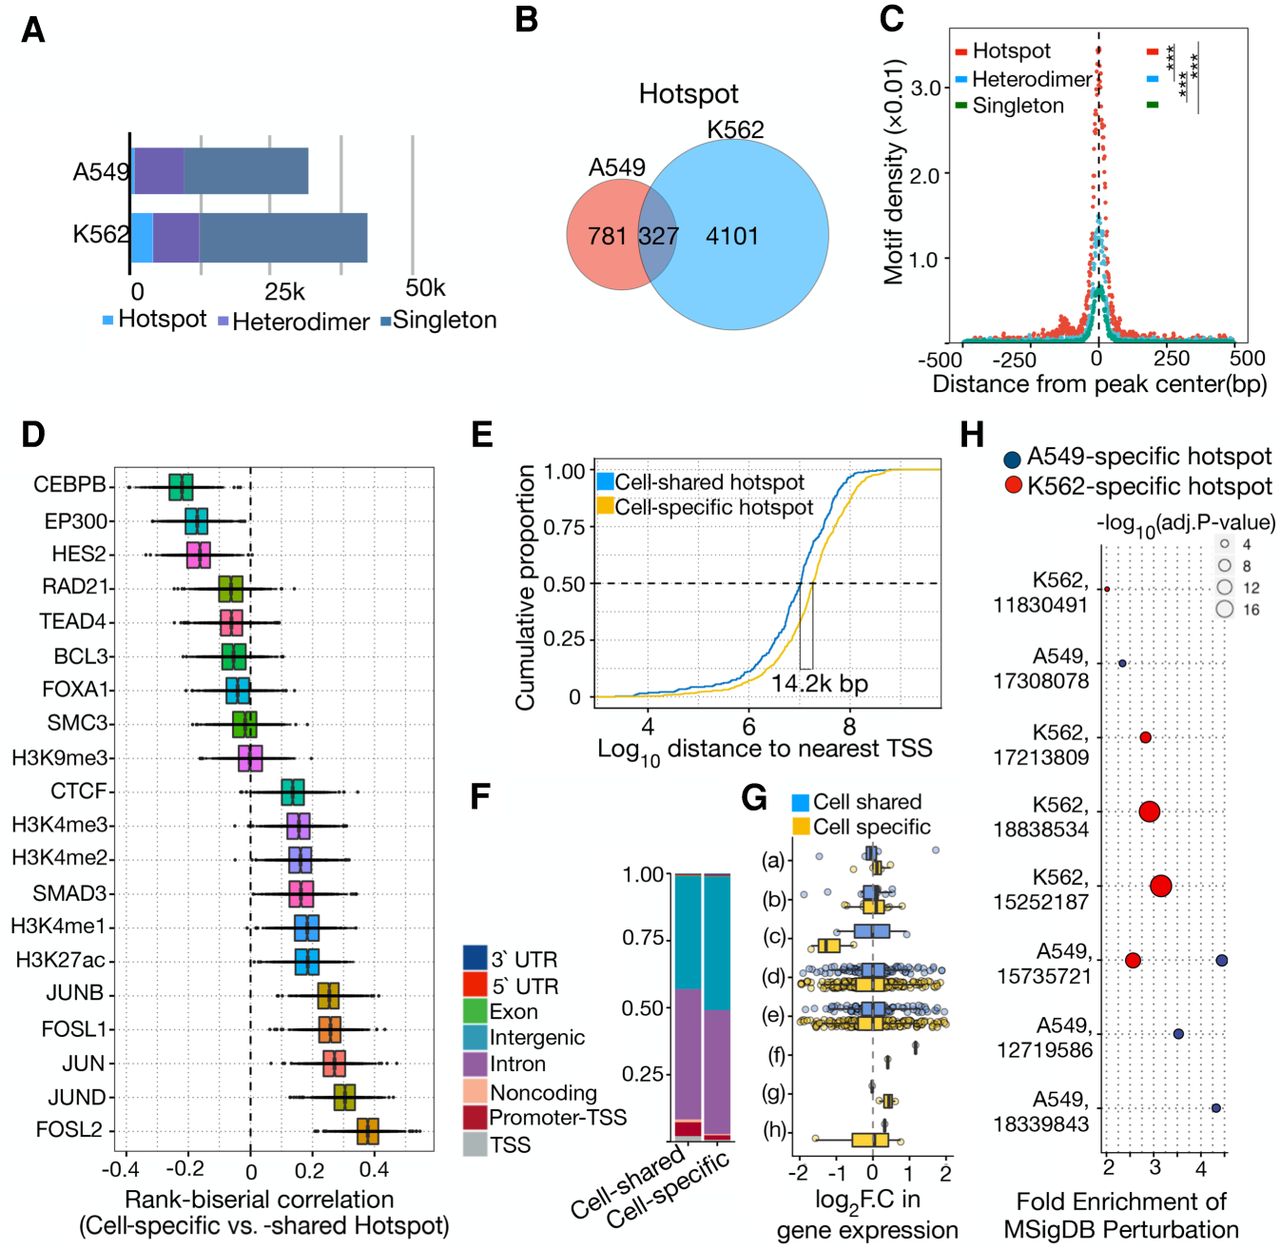
Despite those broad similarities, almost all AP-1 hotspots were specific to one cell model. Of 5536 AP-1 hotspots across cell types, 94% of hotspots were cell type–specific, raising the possibility that specific sets of TFs and/or histone marks may preferentially associate with the formation of cell type–specific AP-1 hotspots. To investigate this possibility, we quantified the degree of similarity for the binding activities of TFs and histone marks between cell type–specific and –shared AP-1 hotspots in A549 cells. The degree of similarity was based on the rank correlation that conveys the direction and the effect size for the Mann–Whitney U test for both sets of genomic regions matched in size. It revealed that cell type–specific AP-1 hotspots are more enriched with enhancer-associated factors, including CEBPB and EP300, whereas cell type–shared AP-1 hotspots show enhanced binding of all AP-1 subunits studied (Fig. 5D). These enrichment patterns coincide with de novo motif enrichment analysis using cell type–shared regions as background for cell type–specific motif enrichment and vice versa (Supplemental Fig. S11). In addition, the robust motif enrichments of pioneer factors such as FOXA1,2 and SPI1 are associated with the formation of cell type–specific hotspots, where active binding of transcriptional coactivators such as EP300 and CEBPB confers high regulatory potential. Cell type–specific AP-1 hotspots were also localized more often at distal intergenic regions, and their regulatory potential for either activating or attenuating gene expression in response to external stimuli were similar (Fig. 5E–G). These results suggest that cell-specific AP-1 hotspots form at distal regulatory elements and may be coupled with other TFs and/or EP300 that differentiate cell types.
To investigate the regulatory function of cell type–specific hotspots, we analyzed changes in gene expression from genetic and chemical perturbations (Subramanian et al. 2005). Cell type–specific AP-1 hotspots are predominantly associated with changes in gene expression of relevant cell types (Fig. 5H). For instance, A549-specific AP-1 hotspots are linked to down-regulated genes in A549 cells transduced with an ASH1-expressing virus that were related to putative tumors suppressors including DKK1 and DUSP1 (Osada et al. 2008). Similarly, K562-specific AP-1 hotspots were associated with changes in gene expression of K562 in response to hemin that induces erythroid commitment (Addya et al. 2004). Those findings indicate that AP-1 hotspots can predefine cell-specific responses to many environmental signals.
To evaluate generality across species, we compared AP-1 subunit binding between primary and immortalized mouse macrophages (Fonseca et al. 2019). Consistent with our observations in human cells, AP-1 subunit binding sites are highly variable across the mouse genome. We then identified ∼5000 AP-1 hotspots based on ChIP-seq signal for different AP-1 subunits. As in human A549 cells, the murine AP-1 hotspots are also enriched in distal intergenic regions (Supplemental Fig. S12A,B), have a distinct DNA shape (Supplemental Fig. S12C), and contain more evolutionarily conserved sequences quantified by the phastCons60way score (Supplemental Fig. S12D). Mouse macrophage hotspots were also enriched in SPI1 and CEBPA, TFs that are critical in macrophage development and differentiation (Supplemental Fig. S13A–H; McKercher et al. 1996; Kaikkonen et al. 2013; Van Oevelen et al. 2015; Glass and Natoli 2016). Taken together, across cellular context and organism, loci colocalized by all AP-1 subunits have distinct binding patterns that predict cell type–specific genomic responses.
Disease-associated noncoding variants are enriched in AP-1 hotspots
A substantial fraction of the variation in gene expression and common disease risk is attributed to noncoding genetic variation (e.g., The GTEx Consortium 2015; MacArthur et al. 2017). If AP-1 hotspots are indeed functionally important, we reasoned that disease-associated genetic variants would be enriched within AP-1 hotspots over other configurations of AP-1 binding. To investigate, we evaluated the frequency of each AP-1 binding configuration that contains at least one disease-associated genetic variant and the distribution of variants occurring within each class. Specifically, we analyzed 5886 single nucleotides polymorphisms (SNPs) associated with diverse phenotypic traits and diseases in 2596 published genome-wide association studies (MacArthur et al. 2017). These SNPs were identified for a trait in at least two independent studies. Of those SNPs, 93% were localized within noncoding regions, consistent with previous studies (Hnisz et al. 2013). Distinct AP-1 binding classes were significantly correlated with different occurrences of GWAS SNPs (P = 0.002, χ2 test), and all AP-1 binding classes had higher enrichment compared to control genomic regions (Fig. 6A). GWAS SNPs were particularly enriched in AP-1 hotspots compared to other AP-1 binding classes (P < 1 × 10⁻¹⁰ for hotspots vs. heterodimers, Student's t-test; P < 1 × 10⁻¹⁰ for hotspots vs. singleton, Student's t-test) (Fig. 6B). Of 50 SNPs localized within hotspots, we find that only a single SNP is exactly embedded within a 7-bp-long canonical AP-1 motif. Forty-four percent of SNPs in hotspots (22) are localized within 100-bp flanking regions of an AP-1 motif within hotspots. We do not observe any other motifs within hotspots that are colocalized with SNPs. The majority of enriched SNPs were related to lung-related diseases and phenotypes, such as chronic obstructive pulmonary disease, asthma, lung cancer, and lung forced expiratory volume. That may be due to our focus on a lung cell model in this study, or rather the distribution of traits in the catalog of GWAS variants.
Disease-associated genetic variants and GO enrichment in distinct AP-1 binding classes. (A) Bar plot showing the proportion of each AP-1 binding class that contains at least single GWAS SNP. (B) Box plot showing the distribution of trait-associated SNP density (SNP/100 kb sequence) for distinct AP-1 binding classes. Each dot represents the SNP density based on the same number of loci repeatedly subsampled from each class. P-values were calculated using Wilcoxon rank-sum test. (***) P < 0.001, N.S. = P > 0.05. (C) GO enrichments using the genomic region-based binomial test (left) and gene-based hypergeometric test (right) for distinct AP-1 binding classes. The color and size of dots represent the different AP-1 binding classes and the adjusted P-values for a given annotation, respectively. (D) Disease Ontology (DO) enrichments using the genomic region-based binomial (left) and gene-based hypergeometric test (right) for distinct AP-1 binding classes. The color and size of dots represent the different AP-1 binding class and the adjusted P-value for a given annotation, respectively.
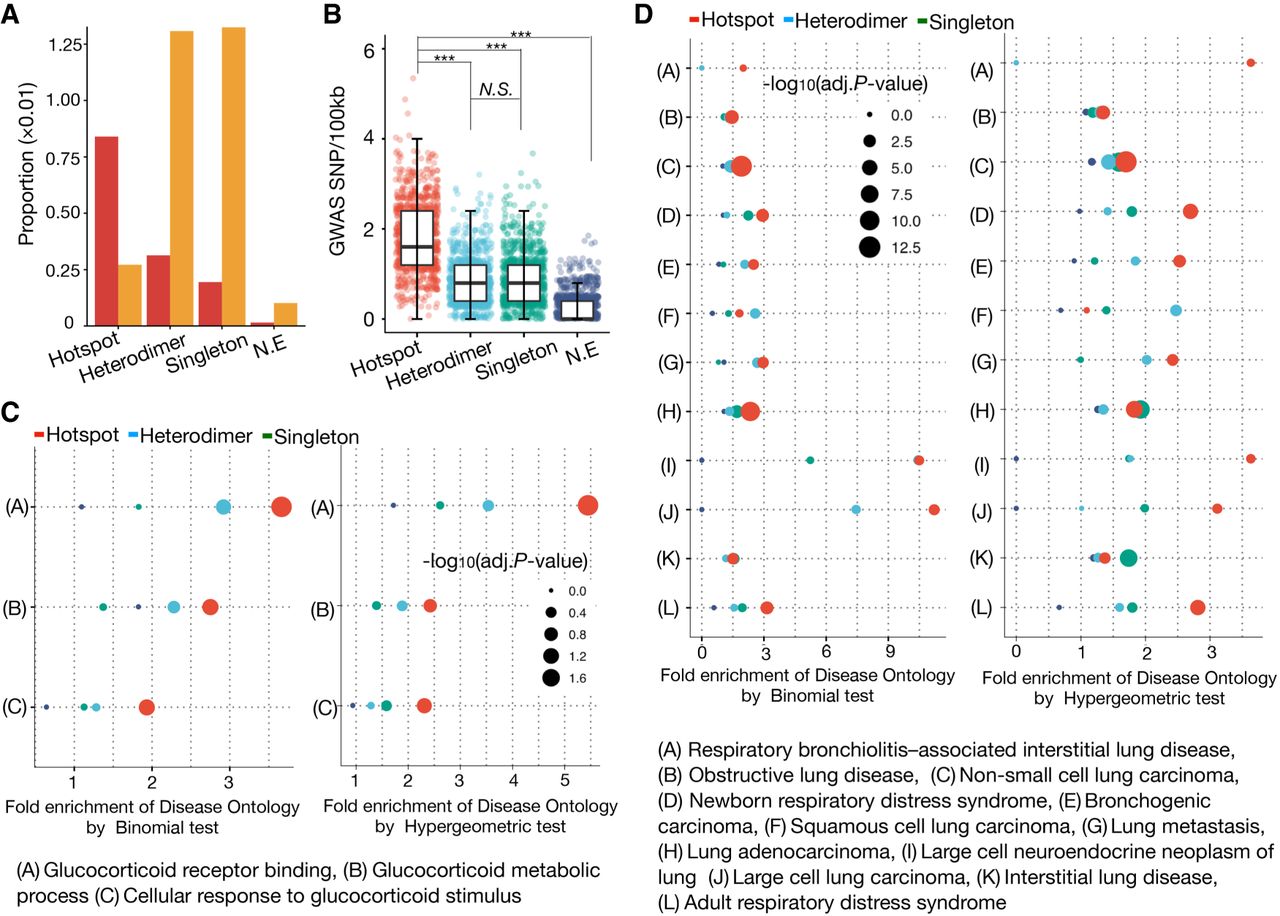
As complementary evidence that AP-1 hotspots have more functional significance than other AP-1 binding configurations, the AP-1 hotspots were also likely to impact genes enriched for evidence of functional effects in the Gene Ontology database (The Gene Ontology Consortium et al. 2000), according to GREAT analysis (McLean et al. 2010). Compared to other AP-1 binding classes, AP-1 hotspots were more enriched for glucocorticoid-responsive activities including GR binding, GC metabolic process, and cellular response to GC stimulus (Fig. 6C). This pattern was consistent with our observation that AP-1 hotspots were characterized by hallmarks of strong GC-responsive regulatory elements. Several lung and respiratory diseases also had strong associations with AP-1 hotspots, likely due to the use of lung A549 cells in this study (Fig. 6D). Together, these analyses demonstrate that AP-1 hotspots are more enriched for genetic variants linked to diseases than other AP-1 binding configurations and suggest that AP-1 hotspots may play a role in organismal development and disease risk.
Discussion
Assigning regulatory activity to the noncoding genome is a major challenge in understanding eukaryotic gene regulation. A recurring theme is that many TFs often bind the same genomic location and that such hotspots of binding have increased functionality (Moorman et al. 2006; Gerstein et al. 2010; Siersbæk et al. 2011, 2014). In contrast, previous studies of the AP-1 family have focused on sites bound by specific combinations of subunits (Fonseca et al. 2019). Here, we demonstrate that, even though AP-1 is an obligate dimer, subunits preferentially bind the genome as hotspots rather than as specific dimers. To the best of our knowledge, this is the first demonstration of hotspot formation within the AP-1 family and suggests that AP-1 dimers bind interchangeably across the human genome. We further identify configurations of DNA motifs that promote hotspot formation and demonstrate that AP-1 hotspots are more functional than other AP-1 binding configurations. Together, these results demonstrate that TF hotspots can extend to within the AP-1 family. Based on this, we propose that functional differences between AP-1 subunits may result from differences in the timing, level, and location of subunit expression rather than subunit-specific binding sites.
Previous studies demonstrated that a high level of TF co-occupancy correlates with distinct genomic features at many genomic sites such as high-occupancy target (HOT) regions (Pavone et al. 1990; Moorman et al. 2006; Gerstein et al. 2010; Chen et al. 2014). HOT genomic regions are often characterized by a colocalization pattern with unusually high numbers of TFs. Similar to AP-1 hotspots, HOT regions were associated with highly expressed genes, and HOT regions were evolutionarily more conserved than non-HOT regions (Gerstein et al. 2010). In addition, HOT regions were discovered across multiple cell types and species with disparate functions, consistent with our findings of AP-1 hotspots observed in different cell types of mouse and human (MacArthur et al. 2009; Gerstein et al. 2010; Araya et al. 2014; Chen et al. 2014). Despite these similarities, AP-1 hotspots also display many differences when compared to HOT regions. Whereas HOT regions typically lack canonical motifs for the TFs cross-linked in those regions, AP-1 hotspots were enriched with a multiplicity of canonical AP-1 motifs (Moorman et al. 2006; Gerstein et al. 2010; The modENCODE Consortium et al. 2010; Yip et al. 2012). Moreover, whereas HOT regions are typically found at promoter-proximal sites with high occupancy of RNA polymerase II, AP-1 hotspots reside at distal-intergenic regions with high occupancy of context-specific coregulators.
Differences in sequence features, especially in flanking regions of canonical motifs, often influence the DNA binding specificity for closely related TFs that share motifs (Shen et al. 2018; Fonseca et al. 2019). Distinct functions and features of AP-1 hotspots can be explained in part by the difference in sequence features among AP-1 binding classes. One possible explanation is that, compared to other AP-1 binding classes, AP-1 hotspots with multiple canonical AP-1 motifs promote sequence-dependent DNA structures that are more optimal for the assembly of high-order nucleoprotein complexes. That model coincides with the possible mechanism by which the IFNB enhanceosome, composed of at least eight DNA-binding proteins (a heterodimer of ATF2/JUN, a heterodimer of NFKB1/REL, and four IRF monomers), is formed; intrinsic deformability of DNA determines the final DNA structure optimized for enhanceosome assembly by positive feedback, where the binding of each factor enhances the binding of other factors (Yie et al. 1997; Panne et al. 2007; Panne 2008).
AP-1 hotspots may also reflect extensive cooperativity among AP-1 subunits and various TFs enriched within AP-1 hotspots, analogous to the cooperative function of Hox-Exd/Pbx heterodimers with other TFs (Joshi et al. 2007), TFs during early adipogenesis (Siersbæk et al. 2011, 2014; Steger and Lazar 2011), and TFs in the genome of Drosophila (Moorman et al. 2006). Genomic loci occupied by multiple members of the FOX protein family are also more frequently functional than those occupied by a single member (Chen et al. 2016), suggesting that the mechanism by which an AP-1 hotspot is formed may be generalized to other TF families. More recently, motif-driven cooperativity has also been proposed as a driver of phase condensation and enhancer activity (Shrinivas et al. 2019).
One potential advantage of AP-1 hotspots is that they could allow for redundancy to the loss or reduced expression of any one subunit. However, several studies suggest that hotspot-like configurations of TFs are actually more sensitive to TF expression (Giniger and Ptashne 1988; Griggs and Johnston 1991). Super-enhancers are also more sensitive to reduced expression of a single TF than other enhancers (Whyte et al. 2013). Instead, it may be that synergetic interactions between many AP-1 subunits substantially increase regulatory element function (e.g., Perez-Pinera et al. 2013; Smith et al. 2013), while also making the element more sensitive to decreases in expression of any one subunit. Collectively, these results support an alternative model of AP-1 hotspot function where synergetic interactions between many AP-1 subunits substantially increase regulatory function.
More broadly, we demonstrate here that gene-editing combined with functional genomics is useful to address challenges in distinguishing TFs that contain regions of nearly identical protein sequence. In doing so, we bypass conventional difficulties in finding ChIP-grade antibodies that discriminate closely related members of a protein family. Epitope tags have been widely used to successfully map the binding patterns of TFs (Zhang et al. 2008; Mazzoni et al. 2011; Savic et al. 2015). Our approach differs from these previous efforts in several ways, including modification of endogenous genomic sequences, use of a floxed selection cassette to increase effective editing efficiency, use of multiple Cas systems, and evaluation of individual guide RNAs for their tagging efficiencies. Overall, the approach developed here could prove useful as an additional strategy for the profiling of heterodimeric transcription factor families, which are highly prevalent in the human genome.
Methods
Generation of gene-edited cell lines
A549 cells were electroporated in a 0.2-cm cuvette using Bio-Rad's GenePulser Xcell; 2 × 10⁶ cells were resuspended in 200 µL of Opti-MEM (Thermo Fisher Scientific) with 5 µg of pooled plasmid (1 µg of donor, 1 µg of guide RNA, and 3 µg of Cas expression vectors). This was done in biological triplicate for each guide RNA used, where three separate electroporations were performed for each guide RNA and these were maintained independently thereafter. Immediately after electroporation, cells were rescued with 1 mL of complete media and transferred into complete media. Media was exchanged every 2 d thereafter. Transfection efficiencies were routinely higher than 60%, as determined by fluorescence microscopy after delivery of a control eGFP expression plasmid. Five days postelectroporation, cells were selected with puromycin at a concentration of 1 µg/mL. Selection was performed for 3 d. Cells were then treated with adenoviral Cre recombinase per the manufacturer's protocol (University of Iowa Vector Core).
The efficiency of the desired editing event was assessed by restriction fragment length polymorphism analysis. Genomic DNA of the cell population was extracted using the DNeasy kit (Qiagen). The C terminus of the gene of interest was amplified using AccuPrime Taq DNA Polymerase (Thermo Fisher Scientific) with primers that bind external to the homology arm region. The PCR product was purified using a 0.5× SPRI bead purification (Beckman Coulter), and the product was digested using PsiI (New England Biolabs), which recognizes a DNA sequence embedded in the 3xFLAG coding sequence. Digests were run on an agarose gel and the efficiency of gene editing was assessed by densitometry. For those groups that demonstrated measurable editing rates at the DNA level, the desired modification was then further confirmed by western blot using the Sigma-Aldrich M2 antibody (F1804). Cells were then expanded and stored in 1 × 10⁷ cell aliquots for all subsequent experiments. For more details on plasmid and oligonucleotides, cell culture, and ChIP-seq library, see Supplemental Methods.
Analysis of regulatory potential
Different AP-1 binding modes were first identified at pre- and post-dex time points using the definition of AP-1 hotspot, heterodimer, and singleton discussed in the Results. Next, genomic loci were labeled as (1) gained AP-1 sites if a particular AP-1 binding mode was newly observed in response to dex, (2) lost AP-1 sites if a particular AP-1 binding mode was lost in response to dex, and (3) maintained AP-1 sites if no change in a particular AP-1 binding mode was observed in response to dex. Dynamic transcriptome data were downloaded from a previous study and the same data processing pipeline was used (McDowell et al. 2018). Log2 fold changes in gene expression in response to dex across 11 time points (0, 0.5, 1, 2, 3, 4, 5, 6, 8, 10, and 12 h) were computed using edgeR (Robinson et al. 2010). To map changes in different AP-1 binding modes to transcriptional changes of target genes, we utilized three mapping strategies including (1) statistically significant eQTL from GTEx (The GTEx Consortium 2013), (2) a combination of chromatin accessibility (DNase-seq), chromatin interaction (Hi-C), and active enhancer marks (H3K27ac) from previous studies (D'Ippolito et al. 2018; McDowell et al. 2018) using the ABC model (Fulco et al. 2019), and (3) the proximity to the nearest genes. Significant SNPs and target gene pairs from lung cancer data were downloaded from the GTEx portal (https://gtexportal.org/home/). Genes with any of these eQTLs that colocalize with a particular AP-1 binding mode were considered to be influenced by changes in that AP-1 binding mode. For proximity-based mapping, a gene that is closest to genomic sites with AP-1 occupancy was selected as the target gene.
AP-1 hotspots across cellular context
We downloaded all ChIP-seq data for K562 cells used in this study from the ENCODE portal (http://www.encodeproject.org) (Supplemental Table S4). ChIP-seq data for primary and immortalized mouse macrophages were downloaded from the NCBI Gene Expression Omnibus (GEO; https://www.ncbi.nlm.nih.gov/geo/) accession number GSE111856. For more details on data processing, see Supplemental Methods.
Data access
All raw and processed sequencing data generated in this study have been submitted to the NCBI Gene Expression Omnibus (GEO; https://www.ncbi.nlm.nih.gov/geo/) under accession number GSE153254. Codes and data processing pipelines are available in the Supplemental Code and at GitHub (https://github.com/Duke-GCB/GGR-cwl).
Competing interest statement
The authors declare no competing interests.
Acknowledgments
This work was funded by the following grants: National Institutes of Health (NIH) U01 HG007900 (all authors); NIH R01 HG010741 (J.S., C.A.W., A.B., C.A.G., and T.E.R.); NIH R01 DA036865 (D.D.K. and C.A.G.); and Open Philanthropy (C.A.G. and T.E.R.). We thank Anthony M. D’Ippolito, Christopher M. Vockley, and Ian C. McDowell for helpful discussions.
Author contributions: J.S., D.D.K., C.A.G., and T.E.R. conceptualized the study. D.D.K., L.C.B., and C.A.W. performed the experiments. J.S., D.D.K., and T.E.R. performed formal analysis and interpreted the results. A.B. curated the data set. C.A.G. and T.E.R. funded the study. J.S., D.D.K., C.A.G., and T.E.R. wrote the manuscript. All authors reviewed the manuscript prior to submission.
Notes
[1] Supplementary material [Supplemental material is available for this article.]
[2] Article published online before print. Article, supplemental material, and publication date are at https://www.genome.org/cgi/doi/10.1101/gr.267898.120.
[3] Freely available online through the Genome Research Open Access option.
References
- ↵Addya S, Keller MA, Delgrosso K, Ponte CM, Vadigepalli R, Gonye GE, Surrey S. 2004. Erythroid-induced commitment of K562 cells results in clusters of differentially expressed genes enriched for specific transcription regulatory elements. Physiol Genomics 19: 117–130. 10.1152/physiolgenomics.00028.2004
- ↵Angel P, Imagawa M, Chiu R, Stein B, Imbra RJ, Rahmsdorf HJ, Jonat C, Herrlich P, Karin M. 1987. Phorbol ester-inducible genes contain a common cis element recognized by a TPA-modulated trans-acting factor. Cell 49: 729–739. 10.1016/0092-8674(87)90611-8
- ↵Araya CL, Kawli T, Kundaje A, Jiang L, Wu B, Vafeados D, Terrell R, Weissdepp P, Gevirtzman L, Mace D, 2014. Regulatory analysis of the C. elegans genome with spatiotemporal resolution. Nature 512: 400–405. 10.1038/nature13497
- ↵Behrens A, Sibilia M, Wagner EF. 1999. Amino-terminal phosphorylation of c-Jun regulates stress-induced apoptosis and cellular proliferation. Nat Genet 21: 326–329. 10.1038/6854
- ↵Behrens A, Sibilia M, David JP, Möhle-Steinlein U, Tronche F, Schütz G, Wagner EF. 2002. Impaired postnatal hepatocyte proliferation and liver regeneration in mice lacking c-jun in the liver. EMBO J 21: 1782–1790. 10.1093/emboj/21.7.1782
- ↵Ben-David U, Siranosian B, Ha G, Tang H, Oren Y, Hinohara K, Strathdee CA, Dempster J, Lyons NJ, Burns R, 2018. Genetic and transcriptional evolution alters cancer cell line drug response. Nature 560: 325–330. 10.1038/s41586-018-0409-3
- ↵Biddie SC, John S, Sabo PJ, Thurman RE, Johnson TA, Schiltz RL, Miranda TB, Sung MH, Trump S, Lightman SL, 2011. Transcription factor AP1 potentiates chromatin accessibility and glucocorticoid receptor binding. Mol Cell 43: 145–155. 10.1016/j.molcel.2011.06.016
- ↵Chaudhari HG, Cohen BA. 2018. Local sequence features that influence AP-1 cis-regulatory activity. Genome Res 28: 171–181. 10.1101/gr.226530.117
- ↵Chen RA, Stempor P, Down TA, Zeiser E, Feuer SK, Ahringer J. 2014. Extreme HOT regions are CpG-dense promoters in C. elegans and humans. Genome Res 24: 1138–1146. 10.1101/gr.161992.113
- ↵Chen X, Ji Z, Webber A, Sharrocks AD. 2016. Genome-wide binding studies reveal DNA binding specificity mechanisms and functional interplay amongst Forkhead transcription factors. Nucleic Acids Res 44: 1566–1578. 10.1093/nar/gkv1120
- ↵Chinenov Y, Kerppola TK. 2001. Close encounters of many kinds: Fos-Jun interactions that mediate transcription regulatory specificity. Oncogene 20: 2438–2452. 10.1038/sj.onc.1204385
- ↵D'Ippolito AM, McDowell IC, Barrera A, Hong LK, Leichter SM, Bartelt LC, Vockley CM, Majoros WH, Safi A, Song L, 2018. Pre-established chromatin interactions mediate the genomic response to glucocorticoids. Cell Syst 7: 146–160.e7. 10.1016/j.cels.2018.06.007
- ↵Dror I, Golan T, Levy C, Rohs R, Mandel-Gutfreund Y. 2015. A widespread role of the motif environment in transcription factor binding across diverse protein families. Genome Res 25: 1268–1280. 10.1101/gr.184671.114
- ↵Eferl R, Wagner EF. 2003. AP-1: a double-edged sword in tumorigenesis. Nat Rev Cancer 3: 859–868. 10.1038/nrc1209
- ↵Eferl R, Sibilia M, Hilberg F, Fuchsbichler A, Kufferath I, Guertl B, Zenz R, Wagner EF, Zatloukal K. 1999. Functions of c-Jun in liver and heart development. J Cell Biol 145: 1049–1061. 10.1083/jcb.145.5.1049
- ↵Fonseca GJ, Tao J, Westin EM, Duttke SH, Spann NJ, Strid T, Shen Z, Stender JD, Sakai M, Link VM , 2019. Diverse motif ensembles specify non-redundant DNA binding activities of AP-1 family members in macrophages. Nat Commun 10: 414. 10.1038/s41467-018-08236-0
- ↵Fulco CP, Nasser J, Jones TR, Munson G, Bergman DT, Subramanian V, Grossman SR, Anyoha R, Doughty BR, Patwardhan TA, 2019. Activity-by-contact model of enhancer-promoter regulation from thousands of CRISPR perturbations. Nat Genet 51: 1664–1669. 10.1038/s41588-019-0538-0
- ↵The Gene Ontology Consortium, Ashburner M, Ball CA, Blake JA, Botstein D, Butler H, Cherry JM, Davis AP, Dolinski K, Dwight SS, 2000. Gene Ontology: tool for the unification of biology. Nat Genet 25: 25–29. 10.1038/75556
- ↵Gerstein MB, Lu ZJ, Van Nostrand EL, Cheng C, Arshinoff BI, Liu T, Yip KY, Robilotto R, Rechtsteiner A, Ikegami K, 2010. Integrative analysis of the Caenorhabditis elegans genome by the modENCODE project. Science 330: 1775–1787. 10.1126/science.1196914
- ↵Gertz J, Savic D, Varley KE, Partridge EC, Safi A, Jain P, Cooper GM, Reddy TE, Crawford GE, Myers RM. 2013. Distinct properties of cell-type-specific and shared transcription factor binding sites. Mol Cell 52: 25–36. 10.1016/j.molcel.2013.08.037
- ↵Giniger E, Ptashne M. 1988. Cooperative DNA binding of the yeast transcriptional activator GAL4. Proc Natl Acad Sci 85: 382–386. 10.1073/pnas.85.2.382
- ↵Glass CK, Natoli G. 2016. Molecular control of activation and priming in macrophages. Nat Immunol 17: 26–33. 10.1038/ni.3306
- ↵Griggs DW, Johnston M. 1991. Regulated expression of the GAL4 activator gene in yeast provides a sensitive genetic switch for glucose repression. Proc Natl Acad Sci 88: 8597–8601. 10.1073/pnas.88.19.8597
- ↵The GTEx Consortium. 2013. The Genotype-Tissue Expression (GTEx) project. Nat Genet 45: 580–585. 10.1038/ng.2653
- ↵The GTEx Consortium. 2015. Human genomics. The Genotype-Tissue Expression (GTEx) pilot analysis: multitissue gene regulation in humans. Science 348: 648–660. 10.1126/science.1262110
- ↵Hess J, Angel P, Schorpp-Kistner M. 2004. AP-1 subunits: quarrel and harmony among siblings. J Cell Sci 117: 5965–5973. 10.1242/jcs.01589
- ↵Hilberg F, Aguzzi A, Howells N, Wagner EF. 1993. c-Jun is essential for normal mouse development and hepatogenesis. Nature 365: 179–181. 10.1038/365179a0
- ↵Hnisz D, Abraham BJ, Lee TI, Lau A, Saint-André V, Sigova AA, Hoke HA, Young RA. 2013. Super-enhancers in the control of cell identity and disease. Cell 155: 934–947. 10.1016/j.cell.2013.09.053
- ↵Isakova A, Groux R, Imbeault M, Rainer P, Alpern D, Dainese R, Ambrosini G, Trono D, Bucher P, Deplancke B. 2017. SMiLE-seq identifies binding motifs of single and dimeric transcription factors. Nat Methods 14: 316–322. 10.1038/nmeth.4143
- ↵Jochum W, Passegué E, Wagner EF. 2001. AP-1 in mouse development and tumorigenesis. Oncogene 20: 2401–2412. 10.1038/sj.onc.1204389
- ↵John S, Sabo PJ, Johnson TA, Sung MH, Biddie SC, Lightman SL, Voss TC, Davis SR, Meltzer PS, Stamatoyannopoulos JA, 2008. Interaction of the glucocorticoid receptor with the chromatin landscape. Mol Cell 29: 611–624. 10.1016/j.molcel.2008.02.010
- ↵John S, Sabo PJ, Thurman RE, Sung MH, Biddie SC, Johnson TA, Hager GL, Stamatoyannopoulos JA. 2011. Chromatin accessibility pre-determines glucocorticoid receptor binding patterns. Nat Genet 43: 264–268. 10.1038/ng.759
- ↵Johnson GD, Barrera A, McDowell IC, D'Ippolito AM, Majoros WH, Vockley CM, Wang X, Allen AS, Reddy TE. 2018. Human genome-wide measurement of drug-responsive regulatory activity. Nat Commun 9: 5317. 10.1038/s41467-018-07607-x
- ↵Joshi R, Passner JM, Rohs R, Jain R, Sosinsky A, Crickmore MA, Jacob V, Aggarwal AK, Honig B, Mann RS. 2007. Functional specificity of a Hox protein mediated by the recognition of minor groove structure. Cell 131: 530–543. 10.1016/j.cell.2007.09.024
- ↵Kaikkonen MU, Spann NJ, Heinz S, Romanoski CE, Allison KA, Stender JD, Chun HB, Tough DF, Prinjha RK, Benner C, 2013. Remodeling of the enhancer landscape during macrophage activation is coupled to enhancer transcription. Mol Cell 51: 310–325. 10.1016/j.molcel.2013.07.010
- ↵Karin M, Liu Z, Zandi E. 1997. AP-1 function and regulation. Curr Opin Cell Biol 9: 240–246. 10.1016/S0955-0674(97)80068-3
- ↵Kouzarides T, Ziff E. 1988. The role of the leucine zipper in the fos–jun interaction. Nature 336: 646–651. 10.1038/336646a0
- ↵Lambert SA, Jolma A, Campitelli LF, Das PK, Yin Y, Albu M, Chen X, Taipale J, Hughes TR, Weirauch MT. 2018. The human transcription factors. Cell 172: 650–665. 10.1016/j.cell.2018.01.029
- ↵Liu X, Wang C, Liu W, Li J, Li C, Kou X, Chen J, Zhao Y, Gao H, Wang H, 2016. Distinct features of H3K4me3 and H3K27me3 chromatin domains in pre-implantation embryos. Nature 537: 558–562. 10.1038/nature19362
- ↵MacArthur S, Li XY, Li J, Brown JB, Chu HC, Zeng L, Grondona BP, Hechmer A, Simirenko L, Keränen SV, 2009. Developmental roles of 21 Drosophila transcription factors are determined by quantitative differences in binding to an overlapping set of thousands of genomic regions. Genome Biol 10: R80. 10.1186/gb-2009-10-7-r80
- ↵MacArthur J, Bowler E, Cerezo M, Gil L, Hall P, Hastings E, Junkins H, McMahon A, Milano A, Morales J, 2017. The new NHGRI-EBI Catalog of published genome-wide association studies (GWAS Catalog). Nucleic Acids Res 45: D896–D901. 10.1093/nar/gkw1133
- ↵Mazzoni EO, Mahony S, Iacovino M, Morrison CA, Mountoufaris G, Closser M, Whyte WA, Young RA, Kyba M, Gifford DK, 2011. Embryonic stem cell–based mapping of developmental transcriptional programs. Nat Methods 8: 1056–1058. 10.1038/nmeth.1775
- ↵McDowell IC, Barrera A, D'Ippolito AM, Vockley CM, Hong LK, Leichter SM, Bartelt LC, Majoros WH, Song L, Safi A, 2018. Glucocorticoid receptor recruits to enhancers and drives activation by motif-directed binding. Genome Res 28: 1272–1284. 10.1101/gr.233346.117
- ↵McKercher SR, Torbett BE, Anderson KL, Henkel GW, Vestal DJ, Baribault H, Klemsz M, Feeney AJ, Wu GE, Paige CJ, 1996. Targeted disruption of the PU.1 gene results in multiple hematopoietic abnormalities. EMBO J 15: 5647–5658. 10.1002/j.1460-2075.1996.tb00949.x
- ↵McLean CY, Bristor D, Hiller M, Clarke SL, Schaar BT, Lowe CB, Wenger AM, Bejerano G. 2010. GREAT improves functional interpretation of cis-regulatory regions. Nat Biotechnol 28: 495–501. 10.1038/nbt.1630
- ↵The modENCODE Consortium, Roy S, Ernst J, Kharchenko PV, Kheradpour P, Negre N, Eaton ML, Landolin JM, Bristow CA, Ma L, 2010. Identification of functional elements and regulatory circuits by Drosophila modENCODE. Science 330: 1787–1797. 10.1126/science.1198374
- ↵Moorman C, Sun LV, Wang J, de Wit E, Talhout W, Ward LD, Greil F, Lu XJ, White KP, Bussemaker HJ, 2006. Hotspots of transcription factor colocalization in the genome of Drosophila melanogaster. Proc Natl Acad Sci 103: 12027–12032. 10.1073/pnas.0605003103
- ↵Osada H, Tomida S, Yatabe Y, Tatematsu Y, Takeuchi T, Murakami H, Kondo Y, Sekido Y, Takahashi T. 2008. Roles of achaete-scute homologue 1 in DKK1 and E-cadherin repression and neuroendocrine differentiation in lung cancer. Cancer Res 68: 1647–1655. 10.1158/0008-5472.CAN-07-5039
- ↵Panne D. 2008. The enhanceosome. Curr Opin Struct Biol 18: 236–242. 10.1016/j.sbi.2007.12.002
- ↵Panne D, Maniatis T, Harrison SC. 2007. An atomic model of the interferon-β enhanceosome. Cell 129: 1111–1123. 10.1016/j.cell.2007.05.019
- ↵Parker SC, Stitzel ML, Taylor DL, Orozco JM, Erdos MR, Akiyama JA, van Bueren KL, Chines PS, Narisu N, Black BL, 2013. Chromatin stretch enhancer states drive cell-specific gene regulation and harbor human disease risk variants. Proc Natl Acad Sci 110: 17921–17926. 10.1073/pnas.1317023110
- ↵Pavone P, Patrizio G, Buoni C, Tettamanti E, Passariello R, Musu C, Tirone P, Felder E. 1990. Comparison of Gd-BOPTA with Gd-DTPA in MR imaging of rat liver. Radiology 176: 61–64. 10.1148/radiology.176.1.2353112
- ↵Perez-Pinera P, Ousterout DG, Brunger JM, Farin AM, Glass KA, Guilak F, Crawford GE, Hartemink AJ, Gersbach CA. 2013. Synergistic and tunable human gene activation by combinations of synthetic transcription factors. Nat Methods 10: 239–242. 10.1038/nmeth.2361
- ↵Phanstiel DH, Van Bortle K, Spacek D, Hess GT, Shamim MS, Machol I, Love MI, Aiden EL, Bassik MC, Snyder MP. 2017. Static and dynamic DNA loops form AP-1-bound activation hubs during macrophage development. Mol Cell 67: 1037–1048.e6. 10.1016/j.molcel.2017.08.006
- ↵Rahman I, MacNee W. 1998. Role of transcription factors in inflammatory lung diseases. Thorax 53: 601–612. 10.1136/thx.53.7.601
- ↵Robinson MD, McCarthy DJ, Smyth GK. 2010. edgeR: a Bioconductor package for differential expression analysis of digital gene expression data. Bioinformatics 26: 139–140. 10.1093/bioinformatics/btp616
- ↵Rodríguez-Martínez JA, Reinke AW, Bhimsaria D, Keating AE, Ansari AZ. 2017. Combinatorial bZIP dimers display complex DNA-binding specificity landscapes. eLife 6: e19272. 10.7554/eLife.19272
- ↵Ryseck RP, Bravo R. 1991. c-JUN, JUN B, and JUN D differ in their binding affinities to AP-1 and CRE consensus sequences: effect of FOS proteins. Oncogene 6: 533–542.
- ↵Sassone-Corsi P, Lamph WW, Kamps M, Verma IM. 1988. fos-associated cellular p39 is related to nuclear transcription factor AP-1. Cell 54: 553–560. 10.1016/0092-8674(88)90077-3
- ↵Savic D, Partridge EC, Newberry KM, Smith SB, Meadows SK, Roberts BS, Mackiewicz M, Mendenhall EM, Myers RM. 2015. CETCh-seq: CRISPR epitope tagging ChIP-seq of DNA-binding proteins. Genome Res 25: 1581–1589. 10.1101/gr.193540.115
- ↵Shaulian E, Karin M. 2002. AP-1 as a regulator of cell life and death. Nat Cell Biol 4: E131–E136. 10.1038/ncb0502-e131
- ↵Shen N, Zhao J, Schipper JL, Zhang Y, Bepler T, Leehr D, Bradley J, Horton J, Lapp H, Gordan R. 2018. Divergence in DNA specificity among paralogous transcription factors contributes to their differential in vivo binding. Cell Syst 6: 470–483.e8. 10.1016/j.cels.2018.02.009
- ↵Shrinivas K, Sabari BR, Coffey EL, Klein IA, Boija A, Zamudio AV, Schuijers J, Hannett NM, Sharp PA, Young RA, 2019. Enhancer features that drive formation of transcriptional condensates. Mol Cell 75: 549–561.e7. 10.1016/j.molcel.2019.07.009
- ↵Siersbæk R, Nielsen R, John S, Sung MH, Baek S, Loft A, Hager GL, Mandrup S. 2011. Extensive chromatin remodelling and establishment of transcription factor ‘hotspots’ during early adipogenesis. EMBO J 30: 1459–1472. 10.1038/emboj.2011.65
- ↵Siersbæk R, Rabiee A, Nielsen R, Sidoli S, Traynor S, Loft A, Poulsen LC, Rogowska-Wrzesinska A, Jensen ON, Mandrup S. 2014. Transcription factor cooperativity in early adipogenic hotspots and super-enhancers. Cell Rep 7: 1443–1455. 10.1016/j.celrep.2014.04.042
- ↵Smeal T, Angel P, Meek J, Karin M. 1989. Different requirements for formation of Jun : Jun and Jun : Fos complexes. Genes Dev 3: 2091–2100. 10.1101/gad.3.12b.2091
- ↵Smith RP, Taher L, Patwardhan RP, Kim MJ, Inoue F, Shendure J, Ovcharenko I, Ahituv N. 2013. Massively parallel decoding of mammalian regulatory sequences supports a flexible organizational model. Nat Genet 45: 1021–1028. 10.1038/ng.2713
- ↵Steger DJ, Lazar MA. 2011. Adipogenic hotspots: where the action is. EMBO J 30: 1418–1419. 10.1038/emboj.2011.80
- ↵Subramanian A, Tamayo P, Mootha VK, Mukherjee S, Ebert BL, Gillette MA, Paulovich A, Pomeroy SL, Golub TR, Lander ES, 2005. Gene set enrichment analysis: a knowledge-based approach for interpreting genome-wide expression profiles. Proc Natl Acad Sci 102: 15545–15550. 10.1073/pnas.0506580102
- ↵Van Oevelen C, Collombet S, Vicent G, Hoogenkamp M, Lepoivre C, Badeaux A, Bussmann L, Sardina JL, Thieffry D, Beato M, 2015. C/EBPα activates pre-existing and de novo macrophage enhancers during induced pre-B cell transdifferentiation and myelopoiesis. Stem Cell Reports 5: 232–247. 10.1016/j.stemcr.2015.06.007
- ↵Vierbuchen T, Ling E, Cowley CJ, Couch CH, Wang X, Harmin DA, Roberts CWM, Greenberg ME. 2017. AP-1 transcription factors and the BAF complex mediate signal-dependent enhancer selection. Mol Cell 68: 1067–1082.e12. 10.1016/j.molcel.2017.11.026
- ↵Vockley CM, D'Ippolito AM, McDowell IC, Majoros WH, Safi A, Song L, Crawford GE, Reddy TE. 2016. Direct GR binding sites potentiate clusters of TF binding across the human genome. Cell 166: 1269–1281.e19. 10.1016/j.cell.2016.07.049
- ↵Wagner EF, Eferl R. 2005. Fos/AP-1 proteins in bone and the immune system. Immunol Rev 208: 126–140. 10.1111/j.0105-2896.2005.00332.x
- ↵Wang J, Zhuang J, Iyer S, Lin X, Whitfield TW, Greven MC, Pierce BG, Dong X, Kundaje A, Cheng Y, 2012. Sequence features and chromatin structure around the genomic regions bound by 119 human transcription factors. Genome Res 22: 1798–1812. 10.1101/gr.139105.112
- ↵Whyte WA, Orlando DA, Hnisz D, Abraham BJ, Lin CY, Kagey MH, Rahl PB, Lee TI, Young RA. 2013. Master transcription factors and mediator establish super-enhancers at key cell identity genes. Cell 153: 307–319. 10.1016/j.cell.2013.03.035
- ↵Xie D, Boyle AP, Wu L, Zhai J, Kawli T, Snyder M. 2013. Dynamic trans-acting factor colocalization in human cells. Cell 155: 713–724. 10.1016/j.cell.2013.09.043
- ↵Yáñez-Cuna JO, Dinh HQ, Kvon EZ, Shlyueva D, Stark A. 2012. Uncovering cis-regulatory sequence requirements for context-specific transcription factor binding. Genome Res 22: 2018–2030. 10.1101/gr.132811.111
- ↵Yie J, Liang S, Merika M, Thanos D. 1997. Intra- and intermolecular cooperative binding of high-mobility-group protein I(Y) to the β-interferon promoter. Mol Cell Biol 17: 3649–3662. 10.1128/MCB.17.7.3649
- ↵Yin KJ, Lee JM, Chen SD, Xu J, Hsu CY. 2002. Amyloid-β induces Smac release via AP-1/Bim activation in cerebral endothelial cells. J Neurosci 22: 9764–9770. 10.1523/JNEUROSCI.22-22-09764.2002
- ↵Yip KY, Cheng C, Bhardwaj N, Brown JB, Leng J, Kundaje A, Rozowsky J, Birney E, Bickel P, Snyder M, 2012. Classification of human genomic regions based on experimentally determined binding sites of more than 100 transcription-related factors. Genome Biol 13: R48. 10.1186/gb-2012-13-9-r48
- ↵Zhang X, Guo C, Chen Y, Shulha HP, Schnetz MP, LaFramboise T, Bartels CF, Markowitz S, Weng Z, Scacheri PC, 2008. Epitope tagging of endogenous proteins for genome-wide ChIP-chip studies. Nat Methods 5: 163–165. 10.1038/nmeth1170
- ↵Ziff EB. 1990. Transcription factors: a new family gathers at the cAMP response site. Trends Genet 6: 69–72. 10.1016/0168-9525(90)90081-G