
An efficient RNA-seq-based segregation analysis identifies the sex chromosomes of Cannabis sativa
- Djivan Prentout1,
- Olga Razumova2,3,
- Bénédicte Rhoné1,4,
- Hélène Badouin1,
- Hélène Henri1,
- Cong Feng5,6,
- Jos Käfer1,
- Gennady Karlov2 and
- Gabriel A.B. Marais1
- 1Laboratoire de Biométrie et Biologie Évolutive UMR 5558, Université Lyon 1, CNRS, F-69622 Villeurbanne, France;
- 2Laboratory of Applied Genomics and Crop Breeding, All-Russia Research Institute of Agricultural Biotechnology, Moscow 127550, Russia;
- 3N.V. Tsitsin Main Botanical Garden of Russian Academy of Sciences, Moscow 127276, Russia;
- 4Institut de Recherche pour le Développement, UMR DIADE, IRD, Université de Montpellier, F-34394 Montpellier, France;
- 5Chongqing Medical University, Yuzhong District, Chongqing, 400016, China;
- 6BGI-Shenzhen, Beishan Industrial Zone, Yantian District, Shenzhen 518083, China
Abstract
Cannabis sativa–derived tetrahydrocannabinol (THC) production is increasing very fast worldwide. C. sativa is a dioecious plant with XY Chromosomes, and only females (XX) are useful for THC production. Identifying the sex chromosome sequence would improve early sexing and better management of this crop; however, the C. sativa genome projects have failed to do so. Moreover, as dioecy in the Cannabaceae family is ancestral, C. sativa sex chromosomes are potentially old and thus very interesting to study, as little is known about old plant sex chromosomes. Here, we RNA-sequenced a C. sativa family (two parents and 10 male and female offspring, 576 million reads) and performed a segregation analysis for all C. sativa genes using the probabilistic method SEX-DETector. We identified >500 sex-linked genes. Mapping of these sex-linked genes to a C. sativa genome assembly identified the largest chromosome pair being the sex chromosomes. We found that the X-specific region (not recombining between X and Y) is large compared to other plant systems. Further analysis of the sex-linked genes revealed that C. sativa has a strongly degenerated Y Chromosome and may represent the oldest plant sex chromosome system documented so far. Our study revealed that old plant sex chromosomes can have large, highly divergent nonrecombining regions, yet still be roughly homomorphic.
Cannabis sativa is an ancient crop (Schultes et al. 1974) with two main traditional uses: marijuana and hemp (Small 2015). Marijuana, which is used in folk medicine, as a recreational drug, and lately in conventional medicine (Alexander 2016), has a narcotic effect owing to tetrahydrocannabinol (THC) and other cannabinoids produced in high concentration by some C. sativa cultivars. Until recently, the use of marijuana was prohibited in almost all countries, but C. sativa–derived products with high THC concentrations are now legal, for example, in several US states, Australia, Germany, Peru, and the UK for medicinal purposes (Offord 2018) and also in Uruguay, Canada, and several US states for recreational use (Yeager 2018). In the US, marijuana legal economy amounted to ∼$17 billion in 2016 and may reach as much as $70 billion/year by 2021 (McVey 2017). However, legalization of marijuana is so recent that very few biotech tools have been developed for high THC-producing C. sativa cultivars (Yeager 2018).
THC reaches the highest concentrations in female inflorescences (bracts), so that only female C. sativa plants are of economic importance; furthermore, pollinated female plants produce smaller inflorescences and therefore less THC (Small 2015). It is thus important to avoid growing male plants as they are a waste of resources, labor, and space. Interest in hemp is also increasing as it is a crop for the sustainable production of fibers and oils (Andre et al. 2016; Salentijn et al. 2019). Hemp cultivars usually have a low level of THC and can be legally grown in many countries where marijuana is illegal. Features of male and female hemp plants differ, and early sexing is also useful (Salentijn et al. 2019).
Sexual dimorphism in C. sativa is weak as in many dioecious plants (Barrett and Hough 2013), and sex can be determined with certainty only when the plants start flowering (Small 2015). C. sativa is a dioecious plant in which sex is determined by an XY Chromosome pair (Divashuk et al. 2014). So far, a few Y-linked genetic markers have been identified and are used to sex C. sativa seedlings (e.g., Techen et al. 2010). However, it is not known whether these markers work with all cultivars. The C. sativa sex chromosomes sequences would thus be an important genomic resource that could help improve agricultural yields. Currently, the C. sativa genome projects (van Bakel et al. 2011; Grassa et al. 2018; Laverty et al. 2019) have failed to identify the sex chromosomes, despite chromosome-level assemblies in the latest projects.
C. sativa is one of 15,600 dioecious species of flowering plants (Renner 2014). Dioecy and sex chromosomes have evolved multiple times in plants (Renner 2014), but very few plant systems have been studied in detail (Ming et al. 2011; Charlesworth 2015; Muyle et al. 2017). Historically, sex chromosomes have been classified using results from light microscopy (Ming et al. 2011). The terms homomorphic and heteromorphic refer to these results, with the former being roughly of similar size and the latter clearly different (but see Palmer et al. 2019 for another definition of heteromorphy). The extent to which recombination is suppressed between the sex chromosomes largely explains whether a sex chromosome pair becomes heteromorphic or not (Charlesworth et al. 2005; Bergero and Charlesworth 2009). Homomorphic XY tend to have large recombining regions and heteromorphic XY large nonrecombining ones. There is a loose correlation between the level of heteromorphy and age, but some old homomorphic systems have been described in animals and algae (e.g., Toups and Hahn 2010; Vicoso et al. 2013; Ahmed et al. 2014; Yazdi and Ellegren 2014). In plants, a model for the evolution of sex chromosomes heteromorphy with six stages has been proposed (Ming et al. 2011). In the initial stages, the sex chromosomes have small to intermediate nonrecombining regions and are homomorphic. After some time has elapsed since recombination cessation, DNA sequence and gene content can differ substantially in the nonrecombining X and Y regions, even though the sex chromosomes might be homomorphic under light microscopy (Ming et al. 2011; Wang et al. 2012; Veltsos et al. 2019). The well-studied heteromorphic systems in plants are characterized by a Y Chromosome larger than the X due to fast accumulation of repeats on the former, as in Silene latifolia or Coccinia grandis (Matsunaga et al. 1994; Sousa et al. 2013, 2016; Hobza et al. 2017), or multiple Y Chromosomes due to chromosomal fission–fusion events, as in Rumex species (Ming et al. 2011; Hough et al. 2014; Crowson et al. 2017). However, these sex chromosomes systems are still relatively young (less than 15 million years), and the late stages in the current model for the evolution of sex chromosomes heteromorphy in plants have not yet received attention from genomic studies. In particular, it is not clear whether the plant Y Chromosomes can shrink, as found in the ancient heteromorphic animal systems such as those of humans and some Drosophila species (Bachtrog 2013).
The Cannabaceae and related families (Urticaceae, Moraceae) derive from a dioecious common ancestor (Zhang et al. 2019). Despite being of similar size (Divashuk et al. 2014), the sex chromosomes of C. sativa could thus be much older than those of the species studied so far. Here, we used a recently developed statistical tool to identify X- and Y-linked genes, SEX-DETector (Muyle et al. 2016). We applied SEX-DETector to C. sativa, inferred sex-linked genes, and used those genes to (1) identify the sex chromosomes of C. sativa in an available reference genome assembly, and (2) characterize the C. sativa XY system and compare it to other plant systems.
Results
Identifying sex-linked genes in C. sativa
SEX-DETector requires genotyping data from a cross (two parents and a few offspring individuals) (see Fig. 1). As explained in Muyle et al. (2016), patterns of allele transmission from parents to progeny differ for an autosomal or a sex-linked gene. For example, an allele only transmitted from father to sons is clearly indicative of a Y-linked allele. SEX-DETector relies on a probabilistic model that accounts for typical errors in genotyping data and is used to compute, for each gene, the probability of autosomal and sex-linked segregation types. This key feature of SEX-DETector makes it better at making inferences about segregation type than an empirical approach relying on data filtering to remove genotyping errors would do (better sensitivity, similar specificity).
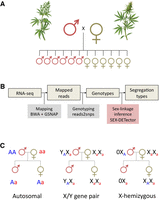
Experimental design and bioinformatic pipeline to identify sex-linked genes. (A,B) The SEX-DETector analysis relies on obtaining genotyping data from a cross (parents + F1 progeny). (C) SEX-DETector infers the segregation type based on how alleles are transmitted from parents to offspring. Three segregation types are included: autosomal (alleles of the parents are transmitted to the progeny the same way in both sexes, in a Mendelian way), XY (one allele of the father—the Y allele—is transmitted exclusively to sons), X-hemizygous (the single allele of the father is transmitted exclusively to daughters; the sons get one allele from the mother only). See Methods for more information. C. sativa male and female plants pencil illustration by annarepp/Shutterstock.com.
More than 576 million 50-bp single-end reads of the parents and five male and five female offspring were mapped to the reference transcriptome of van Bakel et al. (2011), and all individuals were genotyped (see Methods). From these data, 11,515 genes were inferred as autosomal and 565 as sex-linked (i.e., 4.6% of the genes for which SEX-DETector produced an assignment). The latter included 347 XY gene pairs and 218 X-hemizygous genes (i.e., genes lacking Y copies) (see Methods and Table 1).
Summary of the results of the SEX-DETector analysis
Identifying the sex chromosome pair in C. sativa
A total of 363 sex-linked genes (out of the 555 that we could map) mapped to Chromosome 1 in the reference genome of Grassa et al. (2018): 166 out of 340 XY gene pairs (48.8%) and 197 out of 215 X-hemizygous genes (91.6%) (Fig. 2). This indicates that Chromosome pair 1 is the sex chromosome pair. The remaining 192 sex-linked genes that could be mapped (i.e., 35% of all sex-linked genes) mapped to other chromosomes. Whether these genes are likely to be false positives or not is discussed below and in Supplemental Text S1. Note that, for the remaining analyses, we calculate statistics on all sex-linked genes as well as on the sex-linked genes from Chromosome 1 only.
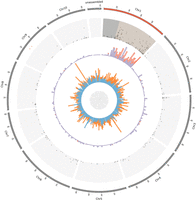
Distribution of the sex-linked and sex-biased genes onto the C. sativa reference genome. From outer to inner rings: (1) Chromosomes from 1 to 10 and unassembled scaffolds of the reference genome (Grassa et al. 2018); (2) X-Y dS values (from 0 to 0.4); (3) proportion of XY-linked genes (in blue) and X-hemizygous genes (in red) in 2-Mb windows; (4) proportion of genes with sex-biased expression in 2-Mb windows: male-biased (light blue), female-biased (orange). THCAS and CBDAS genes found in Grassa et al. (2018) are indicated by two red dots near the outer ring.
Sex chromosomes typically have nonrecombining regions in which the synonymous divergence between the X and Y copies of a sex-linked gene (also called gametologs) can be substantial (Charlesworth 2015; Muyle et al. 2017). Using the sex-linked SNPs inferred by SEX-DETector, we are able to quantify the synonymous divergence (dS) between X and Y copies. The dS reaches 0.4 in the two most divergent XY gene pairs (Fig. 3A); furthermore, most XY gene pairs with high X-Y dS values mapped to a part of Chromosome 1. Two regions can be distinguished on this chromosome (Fig. 2): region 1 (from 30 to 105 Mb) where the XY gene pairs with the highest dS values are found (mean X-Y dS = 0.079, top 5% X-Y dS = 0.32, top 10% X-Y dS = 0.28) and where 58.6% of the sex-linked genes in the region are X-hemizygous, and region 2 (from 1 to 30 Mb) including mainly autosomal genes (791 genes, i.e., 96.1% of the genes in this region), in which the genes inferred as XY gene pairs show little divergence (mean X-Y dS = 0.014, top 5% X-Y dS = 0.05, top 10% X-Y dS = 0.04), and few X-hemizygous genes are present (only 9.3% of the sex-linked genes). These observations suggest region 1 is the X-specific region (not recombining in males) and region 2 the pseudo-autosomal region (= PAR, still recombining in males).
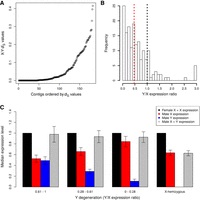
Patterns of molecular evolution of C. sativa sex chromosomes. (A) X-Y dS values for the XY gene pairs. (B) Y/X expression ratio for the XY gene pairs; the black dotted line shows the expected value for no Y degeneration, the red dotted line shows the median observed here (median = 0.47). Both are significantly different (Wilcoxon paired test P-value < 10−16). (C) Dosage compensation in C. sativa. The expression levels of the X and Y alleles in males and females are shown for gene categories (from left to right, categories 0.61-1 and 0.28-0.61: N = 44, category 0-0.28: N = 43, X-hemizygous: N = 184) with different levels of Y degeneration (measured by the Y/X expression ratio). Sex-biased genes (with strong and significant differences in male and female expression) have been removed, as they are not expected to exhibit dosage compensation (see Muyle et al. 2012, 2018). Only sex-linked genes mapping to Chromosome 1 have been included here. Supplemental Figure S1 shows the same analyses with all sex-linked genes.
Age of the C. sativa sex chromosome system
We then used the 565 sex-linked genes to study the evolution of sex chromosomes in C. sativa. First, we used the dS values of the XY gametologs and different molecular clock estimates for plants to infer the age of the sex chromosomes on C. sativa. Using the maximum observed dS value (0.4), we estimated that recombination suppression between X and Y Chromosomes was initiated 26.7–28.6 million years (myr) ago in C. sativa. If we use the dS values of the 5% or 10% most divergent gene pairs to be more conservative when estimating the maximum X-Y divergence, we obtain more recent ages for the initial recombination suppression (17.3–20 myr old using the top 5% X-Y dS values; 12–18.6 myr old using the top 10% X-Y dS values) (see Table 2).
Estimates of the age of the C. sativa sex chromosome system
Degeneration of the Y Chromosome and dosage compensation in C. sativa
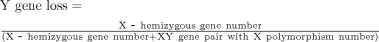
Second, we studied the extent of Y degeneration in C. sativa and estimated gene loss using the X-hemizygous genes. This measure of Y gene loss is, of course, a rough estimate as it reflects both true loss and simply the absence of expression of the Y copy in flower buds (Bergero and Charlesworth 2011; Bergero et al. 2015). SNP-based methods, such as ours, underestimate the number of X-hemizygous genes with respect to XY gene pairs, as X-hemizygous genes can only be detected when there is polymorphism in the X. To correct for this, we compared the number of X-hemizygous genes (218) and the XY gene pairs with polymorphism in the X copy (89), and we found that ∼70% of the Y-linked genes may have been lost in C. sativa. The results were similar when focusing on sex-linked genes found on Chromosome 1 only (72.5%).
To further study Y degeneration, we focused on the expression of the sex-linked genes. Allele-specific expression analysis at the XY gene pairs revealed a median Y/X expression ratio of 0.50 overall (347 genes) and 0.47 for Chromosome 1 genes only (166 genes) (see Fig. 3B), much lower than the expected 1.0 value in the case of equal Y/X expression (i.e., no Y degeneration). We found some evidence for dosage compensation, as in males expression of X was increased when expression of Y was reduced (Fig. 3C). The results were unchanged when using all inferred sex-linked genes or only those found on Chromosome 1 (Fig. 3; Supplemental Fig. S1).
Genomic distribution of the sex-biased genes in C. sativa
Of the genes expressed in flower buds, 15.7% are differentially expressed between male and female individuals (sex-biased genes) (see Table 3; Supplemental Fig. S2). The male-biased genes are significantly more numerous than the female-biased genes (9.06% vs. 6.64%, Fisher's exact test P-value < 10−16) (see Table 3), a pattern that is common in dioecious plants (Harkess et al. 2015; Zemp et al. 2016; Muyle et al. 2017; Cossard et al. 2019, but see Darolti et al. 2018; Sanderson et al. 2019). Sex-biased genes are distributed all over the C. sativa genome (see Fig. 2). The sex-linked genes were significantly enriched among the sex-biased genes (25.8%) compared with the autosomal genes (13.9%; Fisher's exact test P-value = 3.7 × 10⁻¹³), again a very common pattern in dioecious plants (for review, see Muyle et al. 2017; see also Darolti et al. 2018; Sanderson et al. 2019).
List of sex-biased genes
Discussion
Chromosome pair 1 is the sex chromosome pair in C. sativa
Using SEX-DETector, we have been able to identify a large number of sex-linked genes with a moderate sequencing effort (576 millions of single-end 50-bp reads). While most of these sex-linked genes were found to be located on Chromosome 1 of the assembly of Grassa et al. (2018), some mapped elsewhere on the reference genome. These probably include some false positives, but many are likely to result from assembly errors (see Supplemental Text S1). Nevertheless, we were able to clearly identify a chromosome pair (Chromosome 1 in the assembly of Grassa et al. 2018) as the sex chromosomes of C. sativa. We propose that the PAR is ∼30 Mb large based on gene content and also taking into account the fact that SEX-DETector tends to overestimate the size of the PAR (discussed in Muyle et al. 2016). Indeed, in a family setting, partially sex-linked pseudo-autosomal genes close to the pseudo-autosomal boundary can be inferred as fully sex-linked by SEX-DETector. However, as these pseudo-autosomal genes still recombine normally, the dS values between the X and Y alleles identified by SEX-DETector should not exceed the genome-wide nucleotide polymorphism, which is around 1% in our data. Only from 30 Mb onward, the dS values are above this value, leading us to consider the 0–30 Mb region as pseudo-autosomal. However, more data will be needed (e.g., sex-specific genetic maps) to define precisely the limit of the PAR.
The sex chromosomes are the largest in the C. sativa genome
This pair is the largest pair of the C. sativa genome, in agreement with cytogenetic data (Divashuk et al. 2014). This is frequent in plants with heteromorphic sex chromosomes (e.g., S. latifolia, C. grandis) (for review, see Muyle et al., 2017) but also in species with homomorphic chromosomes, such as papaya, where both the X and Y increased in size due to the accumulation of repeats (Gschwend et al. 2012; Wang et al. 2012). We did not observe signs of such a process in C. sativa, as the gene density on the X Chromosome is similar to the gene density on the autosomes (32 genes/Mb vs. 33 genes/Mb). It is thus possible that the sex chromosomes are the largest in C. sativa simply because the sex-determining genes happened to evolve on the largest pair of chromosomes.
C. sativa sex chromosomes are relatively old
Age estimates of the C. sativa sex chromosomes range from ∼12 myr to ∼29 myr old (Table 2). This is plausible, as dioecy probably is ancestral for the whole Cannabaceae family that diversified ∼80 myr ago (Zhang et al. 2019). They may be the oldest sex chromosomes in plants for which the age was inferred from sequence data (Ming et al. 2011; Charlesworth 2015; Muyle et al. 2017). For instance, sex chromosomes are ∼11 myr old in S. latifolia (Krasovec et al. 2018) and 8–16 myr old in two dioecious Rumex species (Crowson et al. 2017). However, only more precise molecular clocks for these plants and age estimates in more plant systems will give a precise picture on where the C. sativa sex chromosomes stand in the age distribution of plant sex chromosomes.
Further evidence that the C. sativa sex chromosomes are older than those of S. latifolia and Rumex hastatulus is the fact that the median Y/X expression ratio is ∼0.5, much lower than what has been reported for the other species [∼0.8 for S. latifolia (Bergero and Charlesworth 2011; Muyle et al. 2012) and ∼0.8 for the old sex-linked genes R. hastatulus (Hough et al. 2014)]. Moreover, Y gene loss is about 70% in C. sativa, which is much higher than other species where Y gene loss has been estimated using the same methodology: ∼40% for S. latifolia (Muyle et al. 2018; see also Papadopulos et al. 2015) and 30% in R. hastatulus (Hough et al. 2014). In R. rothschildianus, gene loss amounts to ∼90%, but the degeneration speed, not the age of the system, is believed to explain this observation (Crowson et al. 2017). Thus, the Y Chromosome of C. sativa seems more strongly degenerated than the Y Chromosomes of species with strong sex chromosome heteromorphy.
Implications for the sex chromosome evolution model in plants
Most of the plant sex chromosome systems that have been studied so far with genomic approaches either have small nonrecombining regions and homomorphic sex chromosomes (e.g., Carica papaya, Asparagus officinalis, Diospyros lotus) or have large nonrecombining regions and heteromorphic sex chromosomes, with the Y being larger than the X (e.g., Silene latifolia, Coccinia grandis). We here found that in a species with homomorphic sex chromosomes, the nonrecombining region is large, as it represents ∼70% (75/105 Mb) of the C. sativa sex chromosomes (as suggested in Divashuk et al. 2014, based on cytogenetic data).
In the current scenario for the evolution of the sex chromosomes heteromorphy in plants (Ming et al. 2011; Charlesworth 2015; Muyle et al. 2017), it is unclear where these XY Chromosomes fit. Indeed, sex chromosome evolution in plants is thought to start with a small nonrecombining region on the Y Chromosome, which accumulates DNA repeats and tends to grow (Fig. 4). In papaya, the Y nonrecombining region is ∼8 Mb large while the X homologous region is ∼4 Mb (Wang et al. 2012). In some dioecious plants, DNA repeat accumulation in the Y nonrecombining region has been fast, and Y Chromosomes that are much larger than the X have evolved in Silene latifolia (Matsunaga et al. 1994) and Coccinia grandis (Sousa et al. 2013).
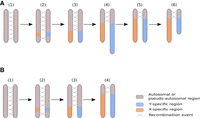
Revisiting the model for the evolution of plant sex chromosomes heteromorphy with C. sativa. (A) The current model for the evolution of plant sex chromosomes heteromorphy is as follows: (1) Sex chromosomes originate from autosomes on which sex-determining genes evolve; (2) the region encompassing the sex-determining genes stops recombining; (3) the non-recombining region grows larger due to additional events of recombination suppression; (4) the nonrecombining region of the Y Chromosome accumulates repeats and can become larger than the corresponding region on the X Chromosome; (5–6) the Y Chromosome undergoes large deletions and ultimately becomes smaller than the X Chromosome. Steps 1–4 have been previously documented in plants (e.g., Charlesworth et al. 2005; Ming et al. 2011; Muyle et al. 2017 for review), while steps 5–6 are speculative. Our study is supportive of this scenario if we assume that the C. sativa Y Chromosome has been larger in the past. (B) It is possible, however, that the accumulation of repeats has been slow in the Y Chromosome of the C. sativa lineage and that X and Y Chromosomes have always been of similar size. Here, step 4 does not imply the elongation of the Y Chromosome.
Either DNA repeat accumulation on the Y has been slow in the C. sativa lineage, or the Y used to be larger than it is today and has undergone genomic shrinking, a process that is reminiscent of the evolution of the sex chromosomes heteromorphy in animals (Ming et al. 2011; Bachtrog 2013), where old Y Chromosomes can be tiny compared to their X counterpart (Fig. 4). Distinct assemblies for the X and Y Chromosomes in C. sativa and also sequencing of other dioecious Cannabaceae species will help in testing this idea in the future.
Methods
Plant material, RNA extraction, and sequencing
One male and one female C. sativa plant (“Zenitsa” cultivar) were grown in controlled conditions in a greenhouse. A female was crossed with a male plant (controlled pollination). Seeds from this cross were sown to produce the F1. Flower buds (chosen because they are RNA-rich) of 3–5 d before expected flowering time (∼1–3 mm) were sampled (5–7 buds per individual) from the parents and five offspring of each sex, as in Muyle et al. (2012). Total RNA was isolated from young flower buds using the RNeasy Plant Mini (Qiagen) plant isolation kit as recommended by the manufacturer. Isolated RNA was placed in RNAstable tubes (Sigma-Aldrich). One library per individual was prepared. RNA-sequencing was conducted using the Complete Genomic (CG) technology, which provides 20 million ∼50-bp single-end reads per sample (Liu et al. 2012). Two CG runs were done, and we obtained a mean of 48 million reads per individual (see Supplemental Table S1). Read quality was good (Phred score >35 for all reads), and no trimming was performed.
Mapping, genotyping, and SEX-DETector analysis
The SEX-DETector analysis requires mapping the reads of the individuals to a reference transcriptome and performing SNP-calling to genotype all individuals for all expressed genes. Ideally, the reference transcriptome is from a female individual so that the X and Y reads map to the same transcript and XY SNPs can be identified by SEX-DETector (Muyle et al. 2016). We extracted the 30,074 transcripts from the annotation of the 2011 complete genome from a Purple Kush female individual (van Bakel et al. 2011). The initial mapping analyses were done using BWA, allowing for five mismatches per read (version 0.7.15-r1140, bwa aln -n 5 and bwa samse) (see Li and Durbin 2010). For comparison, an alternative mapping was performed with Bowtie 2 (version 2.1.0, bowtie2-build and bowtie2 –x) (see Langmead and Salzberg 2012), which yielded similar results. We used SAMtools (version 1.3.1, samtools view -t output.fa -F 4 -h and samtools sort -m 2G) (see Li et al. 2009) to remove unmapped reads and to prepare the files for the genotyping.
The genotyping was performed using reads2snp (version 2.0.64, reads2snp -aeb -min 3 -par 0) (see Gayral et al. 2013), as recommended by Muyle et al. (2016) (i.e., by accounting for allelic expression biases and without filtering for paralogous SNPs). Only SNPs supported by at least three reads were conserved for subsequent analysis (except in Supplemental Table S2).
We ran SEX-DETector (-system xy/zw/no_sex_chr -seq -detail -detail-sex-linked -L -SEM -thr 0.8) (see Muyle et al. 2016) on genotyping data of the 12 individuals. SEX-DETector uses a maximum likelihood approach to estimate the parameters of its model, which include several genotyping error parameters. The posterior probability of being autosomal (P_A), XY (P_XY), or X-hemizygous (P_Xh) is computed for each SNP and for each transcript (combining the posterior probabilities of all SNPs) (see Muyle et al. 2016). A transcript was inferred as sex-linked when its posterior probability of being either XY or X-hemizygous was ≥ 0.8 (i.e., P_XY + P_Xh ≥ 0.8) and if at least one sex-linked SNP had no genotyping error; autosomal segregation was inferred similarly (P_A ≥ 0.8 and at least one autosomal SNP without genotyping error) (see Muyle et al. 2016). The remaining transcripts were considered undetermined and were not used for further analysis unless explicitly mentioned. To identify X-hemizygous genes among the sex-linked genes, we selected (1) the genes that have only X-hemizygous SNPs, of which at least one is without genotyping error, and (2) the genes that have no Y expression and at least one SNP without genotyping error. The second set of genes typically has mainly X-hemizygous SNPs and only a few X/Y SNPs with many Y genotyping errors. After averaging Y expression across all SNPs and individuals of these genes, Y expression is null. Only a few genes were added with step 2.
SEX-DETector runs on the first mapping with BWA (and also Bowtie 2) yielded high Y genotyping error (YGE) parameter values, which could be the result of mapping errors of Y-linked reads (Muyle et al. 2016). The reference transcriptome used for mapping was derived from the genome of a female plant (van Bakel et al. 2011), which may result in a mapping bias against the Y-linked reads. To solve this problem, we used GSNAP (version 2017-11-15, gsnap -m 5) (see Wu and Nacu 2010), which can be used to map RNA-seq reads onto a divergent reference. GSNAP was thus used in a SNP-informed mode that adjusts read alignment onto a reference taking into account a user-provided list of SNPs that are not considered mismatches. For this procedure, we first mapped reads with BWA and collected all the SNPs present in SEX-DETector's output, which were provided to GSNAP. We ran four iterations of GSNAP. For each iteration, SEX-DETector detected new sex-linked SNPs, which were added to the list of SNPs provided to GSNAP. As expected, the Y genotyping error parameter value decreased from 0.84 with BWA to 0.07 with the fourth GSNAP iteration (Supplemental Table S2) and the mapping rate from 82.57% to 87% (Supplemental Table S1). All inferred sex-linked genes are available in Supplemental Table S3.
Circular representations of location of sex-linked genes in the C. sativa genome
To map the sex-linked genes to the C. sativa genome, we used BLAST (Altschul et al. 1990) to find the best hit of each C. sativa transcript in the van Bakel et al. (2011) transcriptome on one of the recent reference genomes (blastn -max_target_seqs 1 -max_hsps 1). For this mapping, we used the C. sativa reference genome with the best assembly statistics (size = 875 Mb, 10 pseudomolecules, 220 scaffolds, N50 = 91 Mb) (see https://www.ncbi.nlm.nih.gov/genome/genomes/11681 and Grassa et al. 2018), which was, however, unannotated. We then used Circos (version 0.69-6) (Krzywinski et al. 2009) for visualizing the location of sex-linked genes. We split each chromosome in windows of 2 Mb using BEDTools makewindows (version v2.26.0) (Quinlan & Hall 2010). BEDTools intersect (version v2.26.0, -c option) (Quinlan & Hall 2010) was used for computing proportions of sex-linked genes per window. Proportions of sex-linked genes were computed by dividing the number of XY gene pairs (or X-hemizygous genes) by the number of all genes (sex-linked, autosomal, and undetermined) that blasted in the same window. A similar analysis was done for sex-biased genes. A comparison of the genomes of Grassa et al. (2018) and Laverty et al. (2019) is also shown in the supplemental material (Supplemental Fig. S4). Chromosome 1 in the assembly of Grassa et al. (2018) apparently corresponds to Chromosome 10 in the assembly of Laverty et al. (2019). Note, however, that the assembly of Chromosome 10 in Laverty et al. (2019) seems to be much less complete than that of Chromosome 1 in Grassa et al. (2018): Chromosome 10 is enriched in sex-linked genes, but many sex-linked genes fall in the unassembled scaffolds.
Analysis of the sex-linked genes
Y gene loss
To estimate the rate of gene loss in the Y Chromosome, we compared the number of XY gene pairs and the number of X-hemizygous
genes, as in Bergero and Charlesworth (2011). Identifying XY gene pairs relies on fixed XY differences, while identifying X-hemizygous genes relies on X-polymorphism
only, which makes detection of X-hemizygous genes less likely (see Bergero and Charlesworth 2011; Muyle et al. 2016). The Y gene loss proportion estimate was thus corrected for this bias as follows:
Values of synonymous divergence (dS) and age of the XY system
The X and Y open reading frame sequences were aligned using the translated reference transcripts to get reading-frame informed
alignments. X-Y dS values were obtained using codeml (PAML version 4.9) (see Yang 2007) in pairwise mode. To estimate the age of the C. sativa XY system, we considered maximum X-Y dS values and used two different molecular clocks for plants: 1.5 × 10⁻⁸ substitutions/site/year (Koch et al. 2000) and 7 × 10⁻⁹ mutations/site/generation (Ossowski et al. 2010). We obtained the age of the XY system as follows:
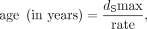 using the molecular clock of Koch et al. (2000), and
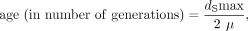 using the molecular clock of Ossowski et al. (2010).
The age in million years from the Ossowski et al. (2010) molecular clock was obtained assuming one generation per year in natural populations of C. sativa (which is a tall annual plant).
Allele-specific expression analyses
We used allele-specific expression estimates at XY gene pairs provided by SEX-DETector (Muyle et al. 2016) for the estimation of the Y/X expression ratio and patterns of dosage compensation (see Fig. 3B–C). These estimates relied on counting reads spanning XY SNPs only and were normalized using the total read number in a library for each individual. These estimates were further normalized by the median autosomal expression for each individual.
Identifying sex-biased genes
As the differential gene expression analysis methods currently available vary in performance (Schurch et al. 2016; Costa-Silva et al. 2017), we chose to combine several methods. Analyses contrasting the gene expression level between our 12 male and female individuals were thus performed using three R packages: (1) DESeq2 version 1.10.1 (Love et al. 2014); (2) edgeR version 3.26.9 (Robinson et al. 2010), both relying on negative binomial distribution of read count modeling; and (3) limma-voom version 3.26.9 (Ritchie et al. 2015), based on log-normal distribution modeling to take into account the sampling variance of small read counts. Very lowly expressed genes were discarded from the analysis, keeping only genes covered by at least 10 reads in a minimum of two replicates. Using a FDR-adjusted P-value cut-off of 0.0001, we retained as sex-biased the genes that had significant differences in expression between males and females in at least two of the three methods (Supplemental Fig. S3).
Statistics
All statistical tests and figures were done using R version 3.2.3 (R Core Team 2016).
Data access
All RNA-seq data for the C. sativa samples generated in this study have been submitted to the NCBI BioProject database (https://www.ncbi.nlm.nih.gov/bioproject/) under accession number PRJNA549804.
Competing interest statement
The authors declare no competing interests.
Acknowledgments
We thank the BGI for free sequencing, thanks to their call for RNA-seq for medicinal plants. We thank Aline Muyle for advice with SEX-DETector and discussions. We thank Dr. Tatyana Sukhorada, P. P. Lukyanenko Krasnodar Research and Development Institute of Agriculture for providing seeds of the C. sativa cultivar “Zenitsa.” We thank three anonymous referees and the editor for their useful comments that helped improve this manuscript. This work was performed using the computing facilities of the CC LBBE/PRABI; we thank Bruno Spataro and Stéphane Delmotte for cluster maintenance. This project was supported through Agence Nationale de la Recherche (ANR) grant ANR-14-CE19-0021-01 to G.A.B.M.
Author contributions: Conceptualization of the study: G.A.B.M. and G.K.; methodology: G.A.B.M. and G.K.; software: D.P., B.R., and H.B.; formal analysis: D.P.; investigation: D.P., O.R., B.R., H.B., H.H., J.K., G.K., and G.A.B.M.; resources: O.R., C.F., and G.K.; data curation: C.F.; writing—original draft: G.A.B.M., D.P., and J.K.; writing—review and editing: all authors; visualization: D.P.; supervision: G.A.B.M., J.K., and G.K.; project administration: G.A.B.M.; funding acquisition: G.A.B.M. and G.K.
Footnotes
-
[Supplemental material is available for this article.]
-
Article published online before print. Article, supplemental material, and publication date are at http://www.genome.org/cgi/doi/10.1101/gr.251207.119.
- Received July 31, 2019.
- Accepted January 24, 2020.
This article is distributed exclusively by Cold Spring Harbor Laboratory Press for the first six months after the full-issue publication date (see http://genome.cshlp.org/site/misc/terms.xhtml). After six months, it is available under a Creative Commons License (Attribution-NonCommercial 4.0 International), as described at http://creativecommons.org/licenses/by-nc/4.0/.


