
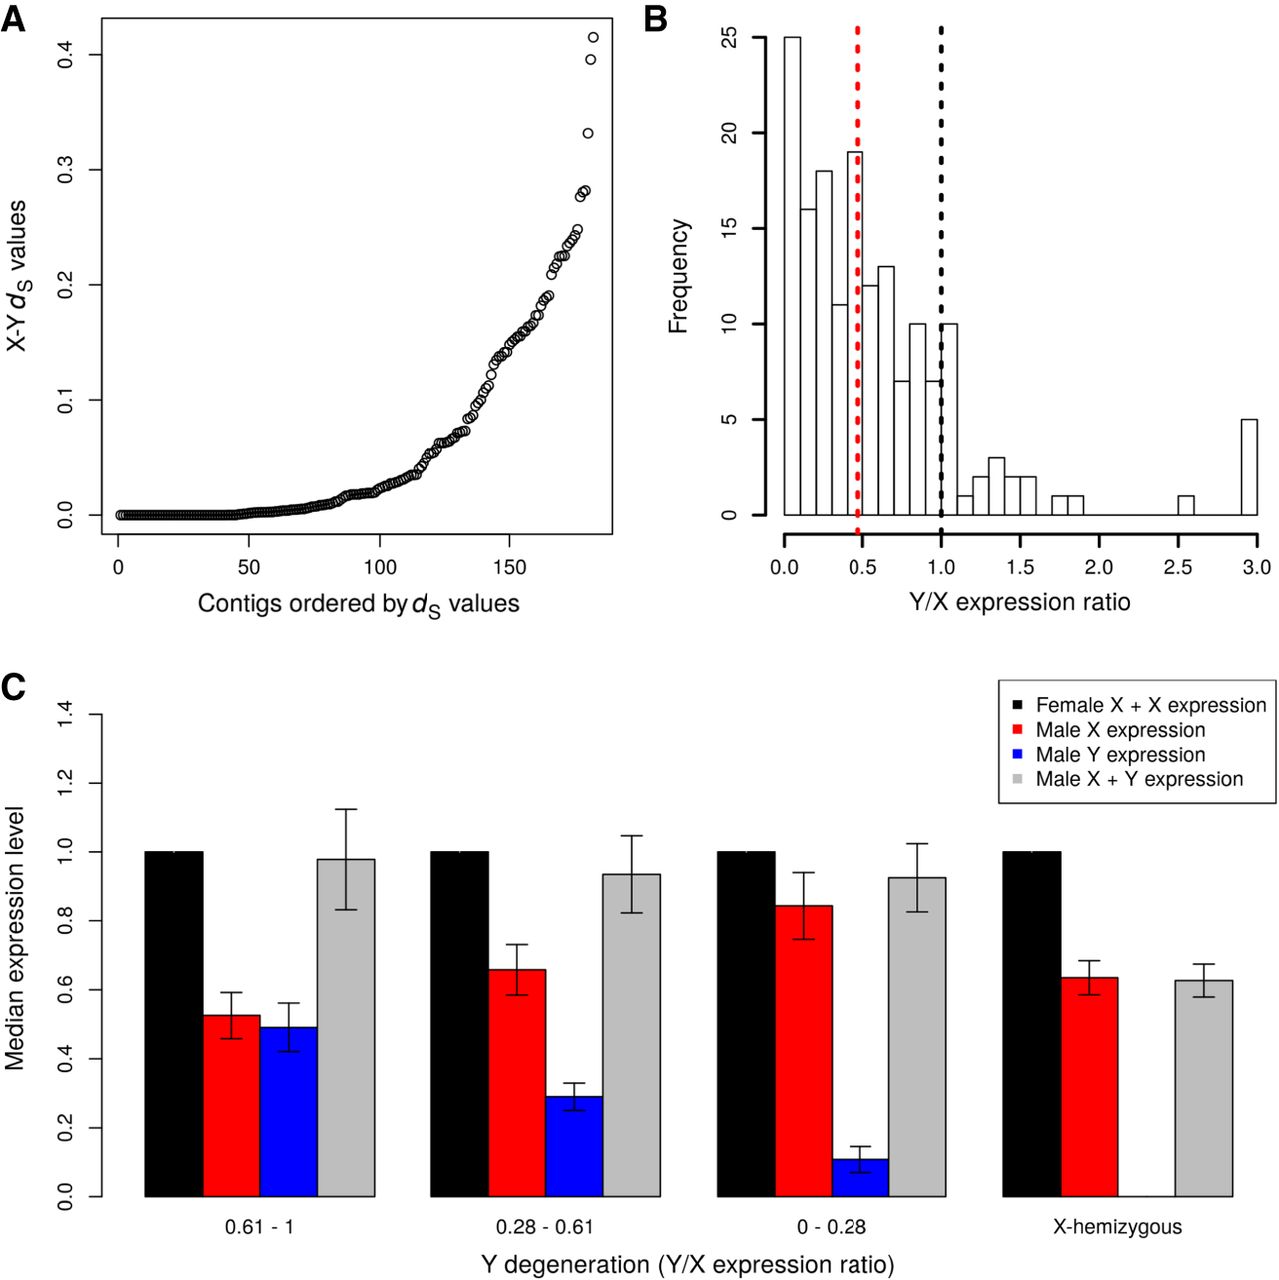
Patterns of molecular evolution of C. sativa sex chromosomes. (A) X-Y dS values for the XY gene pairs. (B) Y/X expression ratio for the XY gene pairs; the black dotted line shows the expected value for no Y degeneration, the red dotted line shows the median observed here (median = 0.47). Both are significantly different (Wilcoxon paired test P-value < 10−16). (C) Dosage compensation in C. sativa. The expression levels of the X and Y alleles in males and females are shown for gene categories (from left to right, categories 0.61-1 and 0.28-0.61: N = 44, category 0-0.28: N = 43, X-hemizygous: N = 184) with different levels of Y degeneration (measured by the Y/X expression ratio). Sex-biased genes (with strong and significant differences in male and female expression) have been removed, as they are not expected to exhibit dosage compensation (see Muyle et al. 2012, 2018). Only sex-linked genes mapping to Chromosome 1 have been included here. Supplemental Figure S1 shows the same analyses with all sex-linked genes.


