
Abstract
Genetic screens in mammalian cells commonly focus on loss-of-function approaches. To evaluate the phenotypic consequences of extra gene copies, we used bulk segregant analysis (BSA) of radiation hybrid (RH) cells. We constructed six pools of RH cells, each consisting of ∼2500 independent clones, and placed the pools under selection in media with or without paclitaxel. Low pass sequencing identified 859 growth loci, 38 paclitaxel loci, 62 interaction loci, and three loci for mitochondrial abundance at genome-wide significance. Resolution was measured as ∼30 kb, close to single-gene. Divergent properties were displayed by the RH-BSA growth genes compared to those from loss-of-function screens, refuting the balance hypothesis. In addition, enhanced retention of human centromeres in the RH pools suggests a new approach to functional dissection of these chromosomal elements. Pooled analysis of RH cells showed high power and resolution and should be a useful addition to the mammalian genetic toolkit.
A variety of experimental strategies have been developed over the last two decades to explore genotype–phenotype correlations in mammalian cells. Gene “knockdowns” use either interfering RNA (RNAi) or small interfering RNAs (siRNAs) to specifically degrade transcripts. These reagents have given insights into multiple phenotypes (Root et al. 2006; Blakely et al. 2011; Mohr et al. 2014; Boettcher and McManus 2015). More recently, CRISPR-Cas9 gene editing approaches that introduce targeted mutations into DNA have emerged as a powerful strategy to enable genome-wide screens for growth and pharmacological mechanisms (Koike-Yusa et al. 2014; Shalem et al. 2014; Hart et al. 2015; Wang et al. 2015; Liu et al. 2017; Pawluk 2018).
These technologies have been fruitful but have some drawbacks. Potential off-target effects exist for both RNAi (Alagia and Eritja 2016; Bofill-De Ros and Gu 2016) and CRISPR-Cas9 (Mohr et al. 2016; Tycko et al. 2016). Furthermore, cell delivery requires the use of lentiviral libraries of unknown stability and high complexity. Assuming 20,000 protein coding genes, each knockout is represented by ∼500 cells in a 75-cm2 flask. Decreased power, or even missing data, are therefore risks. The addition of noncoding transcripts trebles the number of genes (Derrien et al. 2012; Kozomara and Griffiths-Jones 2014; Frankish et al. 2015; Liu et al. 2017), augmenting the problem.
Overexpression provides complementary information to loss-of-function screens (Prelich 2012). For example, screens for viability in Saccharomyces cerevisiae revealed no overlap of overexpressed and knockout genes, suggesting that overexpression alters cell physiology in a distinct manner to loss-of-function (Sopko et al. 2006).
Gain-of-function screens can be particularly revealing in cancer, where overexpression is a key disease driver (Vogelstein et al. 2013). Overexpression is also valuable when genes are haploinsufficient, ruling out the use of knockouts. While cDNA overexpression can be achieved with lentiviral libraries, genome-wide screens have yet to be performed in mammalian cells (Yang et al. 2011; Arnoldo et al. 2014). In addition, cDNA screens typically omit novel isoforms, whose number exceeds that of known transcripts (Škalamera et al. 2011; Eksi et al. 2013; Li et al. 2014), as well as noncoding genes (Derrien et al. 2012; Kozomara and Griffiths-Jones 2014; Frankish et al. 2015; Liu et al. 2017).
Gene expression can be manipulated in a targeted fashion using CRISPR interference (CRISPRi) or CRISPR activation (CRISPRa), in which a catalytically dead Cas9 (dCas9) protein is fused with a transcriptional repressor or activator domain, respectively (Gilbert et al. 2014; Kampmann 2018). The approach has been used in a number of cellular screens, but the overexpression is strongly constitutive with no tissue specific regulation.
As a new strategy to dissecting genotype/phenotype relationships in mammalian cells, we have been retooling radiation hybrid (RH) technology (Park et al. 2008; Ahn et al. 2009; Lin et al. 2010; Ranola et al. 2010; Wang et al. 2011; Khan et al. 2016). This venerable approach to genetic mapping employs lethal doses of radiation to break the genome of a human cell line into small fragments, which are then transferred to living hamster cells by cell fusion (Goss and Harris 1975; Cox et al. 1990; Walter et al. 1994). Human markers that are close together tend to be found in the same set of RH clones, while markers far apart tend to be inherited independently.
A typical RH panel consists of ∼100 clones, each containing ∼4%–10% of the human genome as extra copies. The number of breakpoints in RH mapping is far larger than in meiosis, giving the approach close to single gene resolution and facilitating high resolution maps of mammalian genomes (McCarthy et al. 2000; Avner et al. 2001; Hudson et al. 2001; Olivier et al. 2001; Kwitek et al. 2004).
Although RH panels were widely used in the genome projects, their potential for dissecting biological traits was not fully realized. Recently, we measured the growth of clones from a human RH panel in the presence of the antitubulin drugs paclitaxel (Taxol) and colchicine (Khan et al. 2016). We identified a single gene, ZNRF3, as important to the action of both agents. However, statistical power was limited by the modest size of the RH panel (79 clones).
Bulk segregant analysis (BSA) is an efficient approach to enhancing statistical power in genetic mapping (Michelmore et al. 1991). A pool of diverse cells is placed under selection and loci that contribute to survival are revealed by enrichment of nearby genetic variants (Ehrenreich et al. 2010). The approach surveys a large population of cells using a small number of assays.
Here, we describe experiments that combine RH mapping with BSA. We reasoned that this combination would provide three benefits: (1) a genome-wide approach to gene identification that uses extra dosage rather than loss-of-function; in this study, we sought genes for cell growth in the presence or absence of paclitaxel; (2) the ability to assess coding and noncoding genes on an equal footing; and (3) gains in both statistical power and the already impressive resolution of RH mapping by using multiple independent pools of RH cells, each with thousands of clones.
Results
Creating six RH pools
The strategy for RH-BSA is shown in Figure 1. We lethally irradiated human HEK293 cells (TK1+) to fragment their DNA. The cells were then fused with living hamster A23 cells (TK1−) and plated in HAT selective medium. The HEK293 cell line is an important resource for cell biology and biotechnology and its genome has been sequenced (Lin et al. 2014). In addition, a high-quality draft genome is available for hamster, with continuity approaching that of the mouse (Rupp et al. 2018).
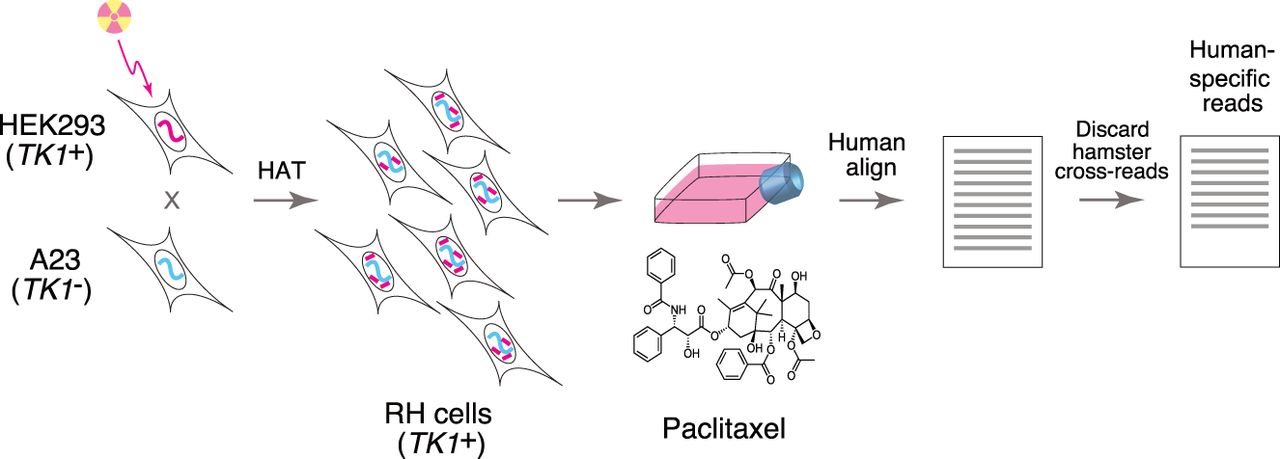
After fusion, the surviving RH cells receive the selectable marker thymidine kinase (TK1) from the donor cells in addition to a random assortment of human DNA fragments. We maintained the RH cells as heterogeneous pools, rather than picking individual clones as is usually done for genetic mapping. The pools were genotyped by low-pass sequencing before and after competition due to growth or drug exposure. Human genes that confer a proliferative advantage become more abundant, while genes that confer a disadvantage become less abundant.
We created six independent RH pools, each with a mean fragment size of 7.4 ± 0.1 Mb (Supplemental Fig. S1). Each pool had 2621 ± 441 clones, after taking into account a spontaneous revertant rate of 26% ± 2% (Supplemental Table S1).
When the cells from the fusion reactions reached confluence, an aliquot from each of the pools was reserved for genotyping. These samples represent week 0 and 0 nM paclitaxel (Supplemental Table S2) and are referred to as the “RH pools.” The cells were further propagated as separate pools and genotyped after 1, 2, 3, 4, and 6 wk in HAT medium supplemented with 0, 8, 25, or 75 nM paclitaxel. There were 115 RH samples in total.
Human DNA in the RH samples
We used low-pass sequencing to analyze the RH samples under the various conditions of growth and drug (Fig. 1; Supplemental Tables S3–S6). A mean of 40.5 ± 0.7 million (M) reads was obtained for each sample, corresponding to a sequencing depth of 0.84 ± 0.01 times the human genome. Reads were aligned to the human and hamster genomes and cross-species reads discarded, leaving only species-specific alignments for subsequent analyses.
The hamster genome in the six RH pools was not changed by the cell fusions (Fig. 2A,B; Supplemental Figs. S2, S3A). In contrast, a selection of human DNA fragments from the HEK293 cells was retained by each RH pool (Fig. 2C–F; Supplemental Figs. S3B, S4–S6).
Genome copy number in the RH pools. (A) Hamster copy number deduced from reads in the A23 cells, normalized to a mean value of 1. (B) Hamster copy number averaged across the six RH pools. (C) Human copy number in the HEK293 cells. (D) Human DNA copy number (retention) averaged across the six RH pools. TK1 assigned retention of 1. (E) Increased retention of human centromere on Chromosome 2. (F) Increased retention of human centromere and TK1 on Chromosome 17.
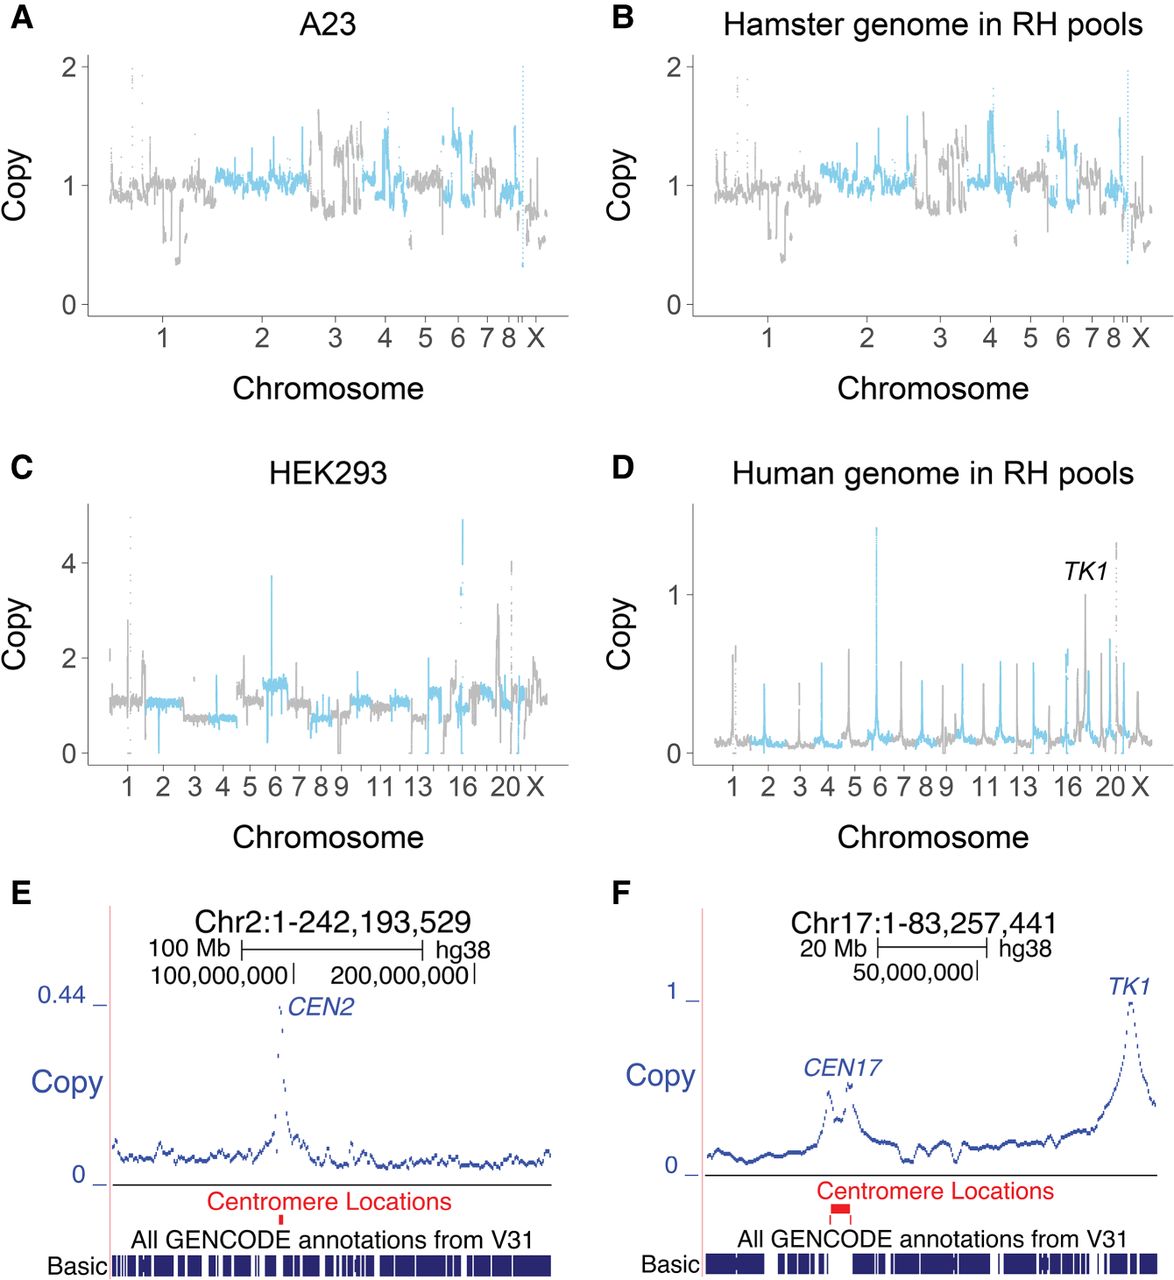
Since human TK1 was used as the selectable marker, this gene has an expected retention frequency of one in the hybrid cells. Donor centromeres also showed increased retention, as these chromosomal regions confer increased stability on the DNA fragments (Fig. 2D–F; Supplemental Figs. S5, S6; Wang et al. 2011). In contrast, noncentromeric regions showed relatively constant retention across the genome, as previously documented in RH panels (Fig. 2D–F; Supplemental Figs. S5, S6; McCarthy et al. 2000; Avner et al. 2001; Hudson et al. 2001; Olivier et al. 2001; Kwitek et al. 2004).
The mean retention frequency in the RH pools was 3.9% ± 0.3% (Supplemental Table S7), with each gene harbored by 3.9 × 10⁵ (± 3.4 × 10⁴) cells in a 75-cm2 flask of 107 RH cells. This cell number compares favorably with the 500 cells expected for a protein-coding lentiviral library. The human genome is represented with 103 ± 20-fold redundancy in each of the six individual RH pools.
The mapping resolution of RH-BSA depends on the length of the DNA fragments, their average retention frequency, and the number of clones. At the mean fragment size of 7.4 ± 0.1 Mb, the number of breakpoints in the individual RH pools is 8.7 × 10⁴ (± 1.7 × 10⁴) and is expected to yield a mapping resolution of 71 ± 14 kb for each pool and 12 ± 3 kb for all six pools together.
Retention changes in the RH samples
Human DNA is commonly lost during growth of hybrid cells, and this phenomenon has been exploited as a tool for gene mapping (Kucherlapati and Ruddle 1975; Harris 1993; Wasmuth 2001). In a pooled setting, alterations in human DNA levels can also occur as a result of changes in relative clone abundance.
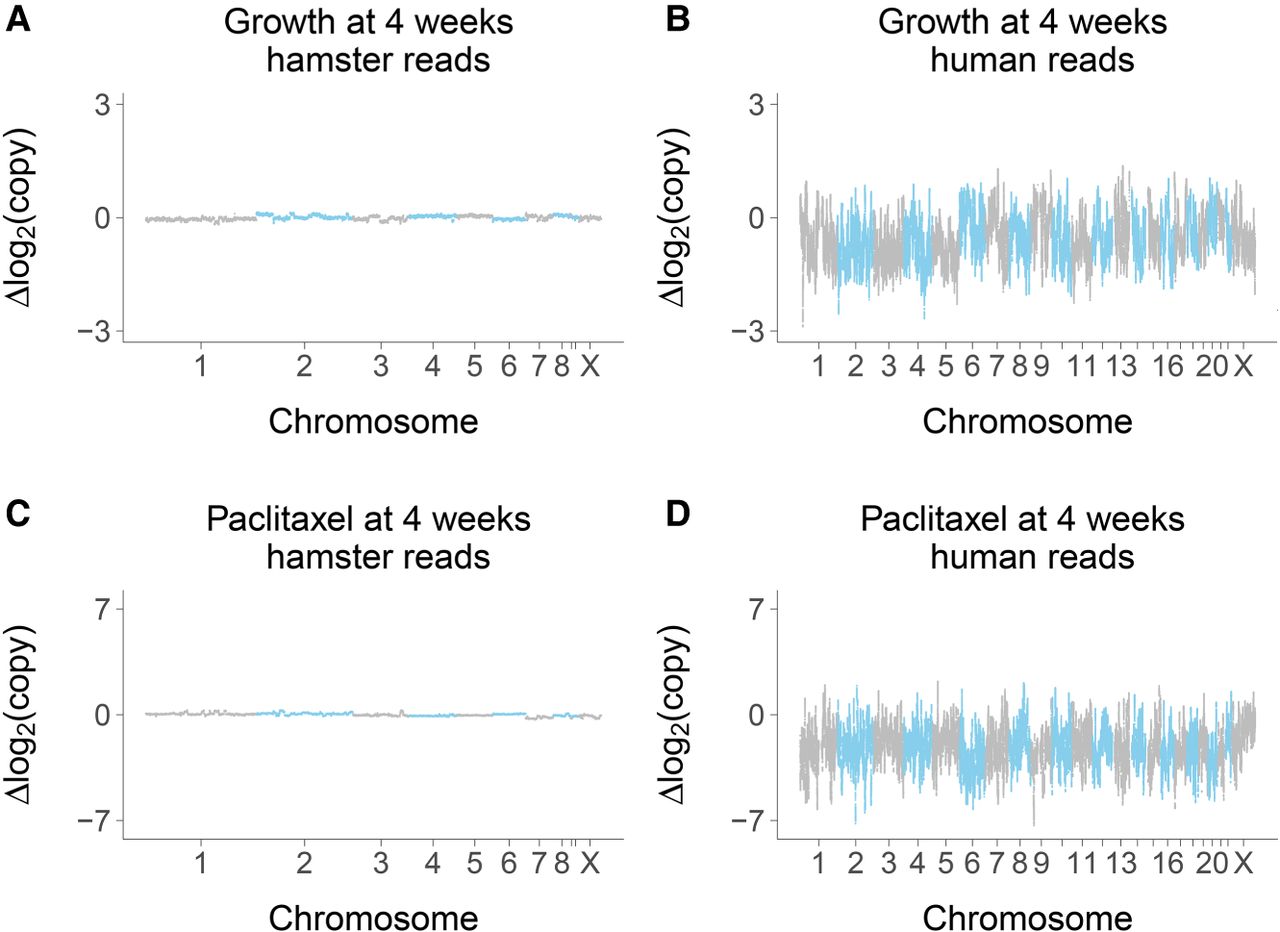
The overall mean retention of human DNA in the RH samples showed a significant decrease as a result of growth (3.9% ± 0.3%, week 0; 1.1% ± 0.2%, week 6), but not paclitaxel (Supplemental Figs. S7–S9). When profiled across the genome, the hamster genome was stable, while human DNA levels showed significant decreases together with increased variance (Fig. 3A–D; Supplemental Fig. S10).
Copy number changes at week 4. (A) Hamster genome, growth at week 4 compared to week 0; 0 nM paclitaxel. (B) Human genome, growth at week 4 compared to week 0; 0 nM paclitaxel. (C) Hamster genome, 75 nM paclitaxel compared to 0 nM paclitaxel; week 4. (D) Human genome, 75 nM paclitaxel compared to 0 nM paclitaxel; week 4. Changes on log2 scale averaged across the six RH pools.
Growth loci
Growth loci tally
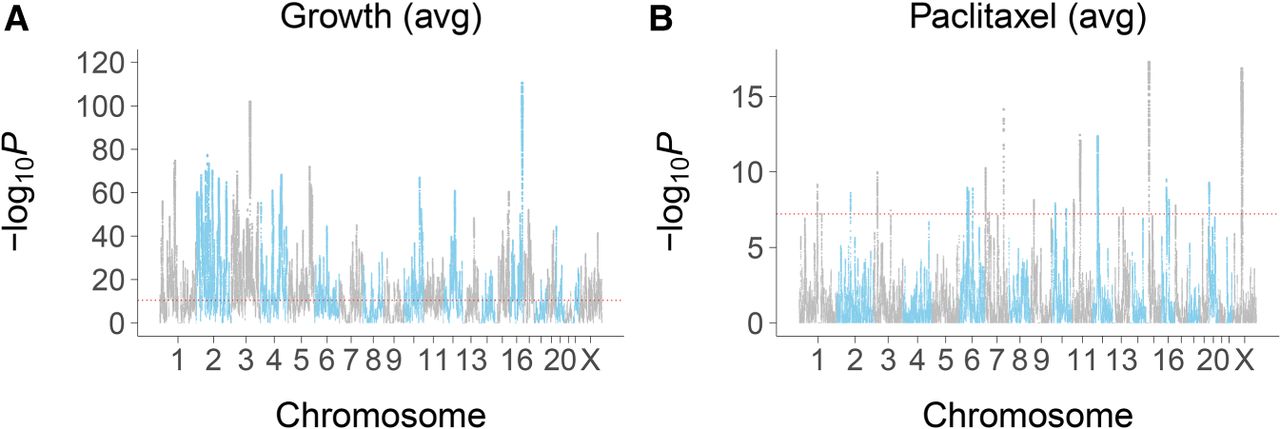
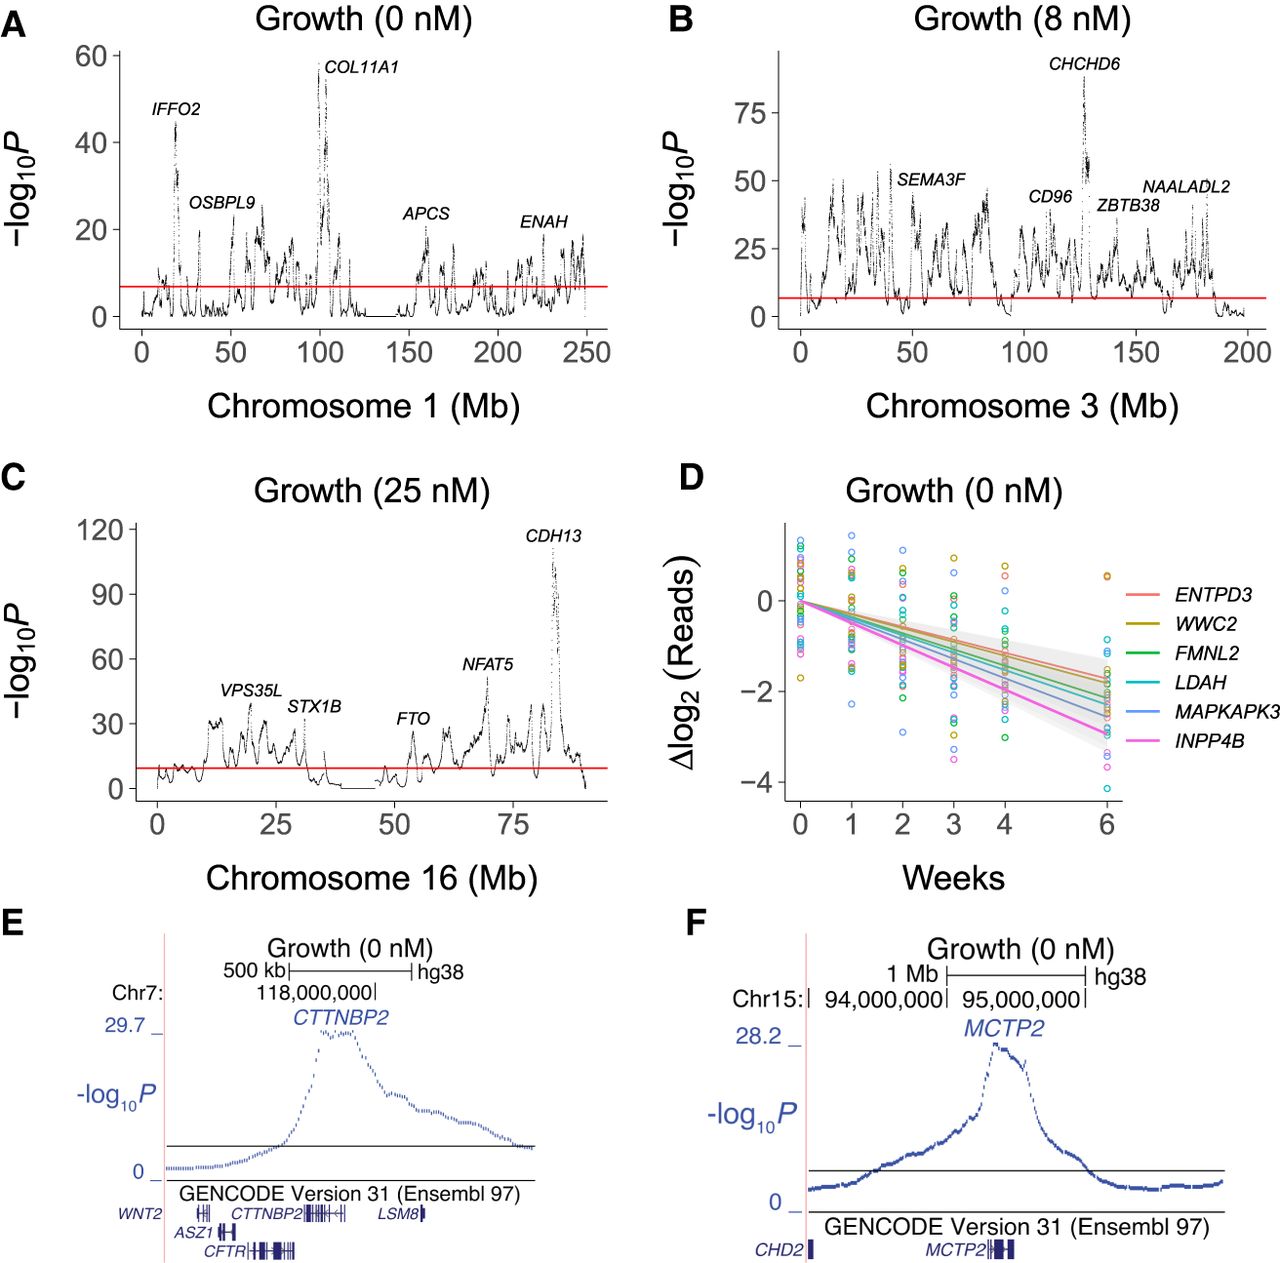
Human growth loci were identified by employing a negative binomial mixed model to detect significant changes in read counts across the genome as a result of growth time at the various paclitaxel concentrations (Supplemental Figs. S11–S17). Cross-validation procedures confirmed high levels of reproducibility (Supplemental Fig. S18). In total, there were 859 unique growth loci, ∼1.4% of all known genes (Fig. 4A; Supplemental Figs. S19–S21; Supplemental Table S8).
Loci for average conditional effects of growth and paclitaxel. (A) Significance values for growth. (B) Significance values for paclitaxel. Red dotted line, permutation significance threshold.
Coding and noncoding growth loci
Four of the growth loci mapped to centromeres. Of the remaining loci, the nearest genes were coding for 442 (52%) and noncoding for 413 (48%). Although the RH coding growth genes were significantly enriched compared to noncoding, noncoding genes clearly play a substantial role in cell proliferation. Detailed views of growth loci are shown in Figure 5A–F and Supplemental Figure S22.
Close up views of growth loci. (A) Chromosome 1. (B) Chromosome 3. (C) Chromosome 16. (D) Sequence read changes on log2 scale for six significant growth loci. Colored lines, best fit. Gray bands, 95% confidence intervals. (E) Locus for CTTNBP2 on Chromosome 7. (F) Locus for MCTP2 on Chromosome 15. Horizontal red and black lines, permutation significance thresholds.
Nearly all growth loci show DNA loss
Consistent with the decrease of human DNA in the RH samples (Fig. 3B,D; Supplemental Figs. S7–S10), only seven of the 859 growth loci, including SEMA3A and TOR1A, had positive coefficients (Supplemental Fig. S23A). Growth genes thus showed preferential loss rather than gain. Our observation echoes the finding that inactivation of tumor suppressor genes is more common in cancer than oncogene activation (Harris 1993; Vogelstein et al. 2013), although the differences between RH and tumor cells mandate caution when making this analogy.
RH growth genes and complex human disease
The RH growth genes were significantly enriched in the catalog of human genome-wide association studies (GWAS; false discovery rate [FDR] = 5.8 × 10⁻¹²) (Chen et al. 2013) and also significantly overrepresented in 16 of 203 disease-related terms in the NCBI Database of Genotypes and Phenotypes (dbGaP; https://www.ncbi.nlm.nih.gov/gap/; FDR < 0.05) (Chen et al. 2013; Tryka et al. 2014). In contrast, there was no significant enrichment for common human disease genes in loss-of-function CRISPR screens (FDR > 0.76, GWAS; FDR > 0.25, dbGaP) (Hart et al. 2015; Wang et al. 2015).
Most common human disease variants represent polymorphisms in regulatory regions, which have more subtle effects than null alleles (Gallagher and Chen-Plotkin 2018). The enrichment of RH growth genes in human disease may thus be related to the restrained effects of an extra copy compared to a knockout. The RH growth genes may be good candidates for causative genes in complex human disease.
The balance hypothesis
The “balance” hypothesis postulates that the effects of altered gene dosage occur as a result of unequal synthesis of gene products (Papp et al. 2003). For example, mismatched stoichiometry could lead to decreased efficiency of multi-subunit protein complexes, such as many enzymes. The hypothesis yields two predictions: (1) genes that show a phenotype when dosage is increased should also show a phenotype when dosage is decreased; and (2) genes with dosage effects should be more likely to participate in multi-subunit complexes. The balance hypothesis has been falsified in yeast (Sopko et al. 2006), but whether it is true in mammalian cells is unknown.
We tested the first prediction by asking whether there was increased overlap between the growth genes identified using RH-BSA and those identified in loss-of-function CRISPR (Hart et al. 2015; Wang et al. 2015) and CRISPRi screens (Gilbert et al. 2014). Contrary to expectations, the RH growth genes had significantly decreased effect scores, decreased cell line hit rates, and significant underrepresentation among the CRISPR growth genes (Fig. 6A–F; Supplemental Figs. S24, S25). These observations refute the first prediction of the balance hypothesis.
RH growth genes. (A) RH growth genes (RH+) have weaker CRISPR effects (Hart et al. 2015) than nongrowth RH genes (RH−). (BF) Bayes factor for growth effects in each cell line, P-values shown above comparisons. (B) Mean number of cell lines with a CRISPR hit is lower for RH growth genes. (C) Lack of overlap between RH and CRISPR growth genes in HCT116 cells. Abscissa shows threshold BF used to calculate overlap. (D) CRISPR scores (CS) for growth effects (Wang et al. 2015) multiplied by −1, so that higher scores mean stronger effects. (E) Lack of overlap between RH and CRISPR growth genes in KBM7 cells. (F) RH growth genes show weaker CRISPRi, but not CRISPRa, effects (−γ) in K562 cells (Gilbert et al. 2014). (G) RH growth genes have increased numbers of low-confidence protein–protein interactions and decreased numbers of high-confidence interactions. Score threshold (abscissa) is a measure of confidence. (H) Number of protein–protein interactions at most significant low-confidence score threshold (160) and most significant high-confidence threshold (995). (I) RH coding region growth genes have decreased expression compared to nongrowth genes in microarray data from a human RH panel. (J) Coding region (cr) RH growth genes have decreased expression compared to cr nongrowth genes in GTEx RNA-seq data from substantia nigra. (K) Noncoding (nc) RH growth and nongrowth genes show no significant expression differences in substantia nigra. (L) Decreased number of human paralogs (duplicates) for RH growth genes. P-values, Welch's two-sample t-test except in C and E, Fisher's exact test. (FDR) False discovery rate (Benjamini and Hochberg 1995). Transcripts per million (TPM) thresholded at ≥5.
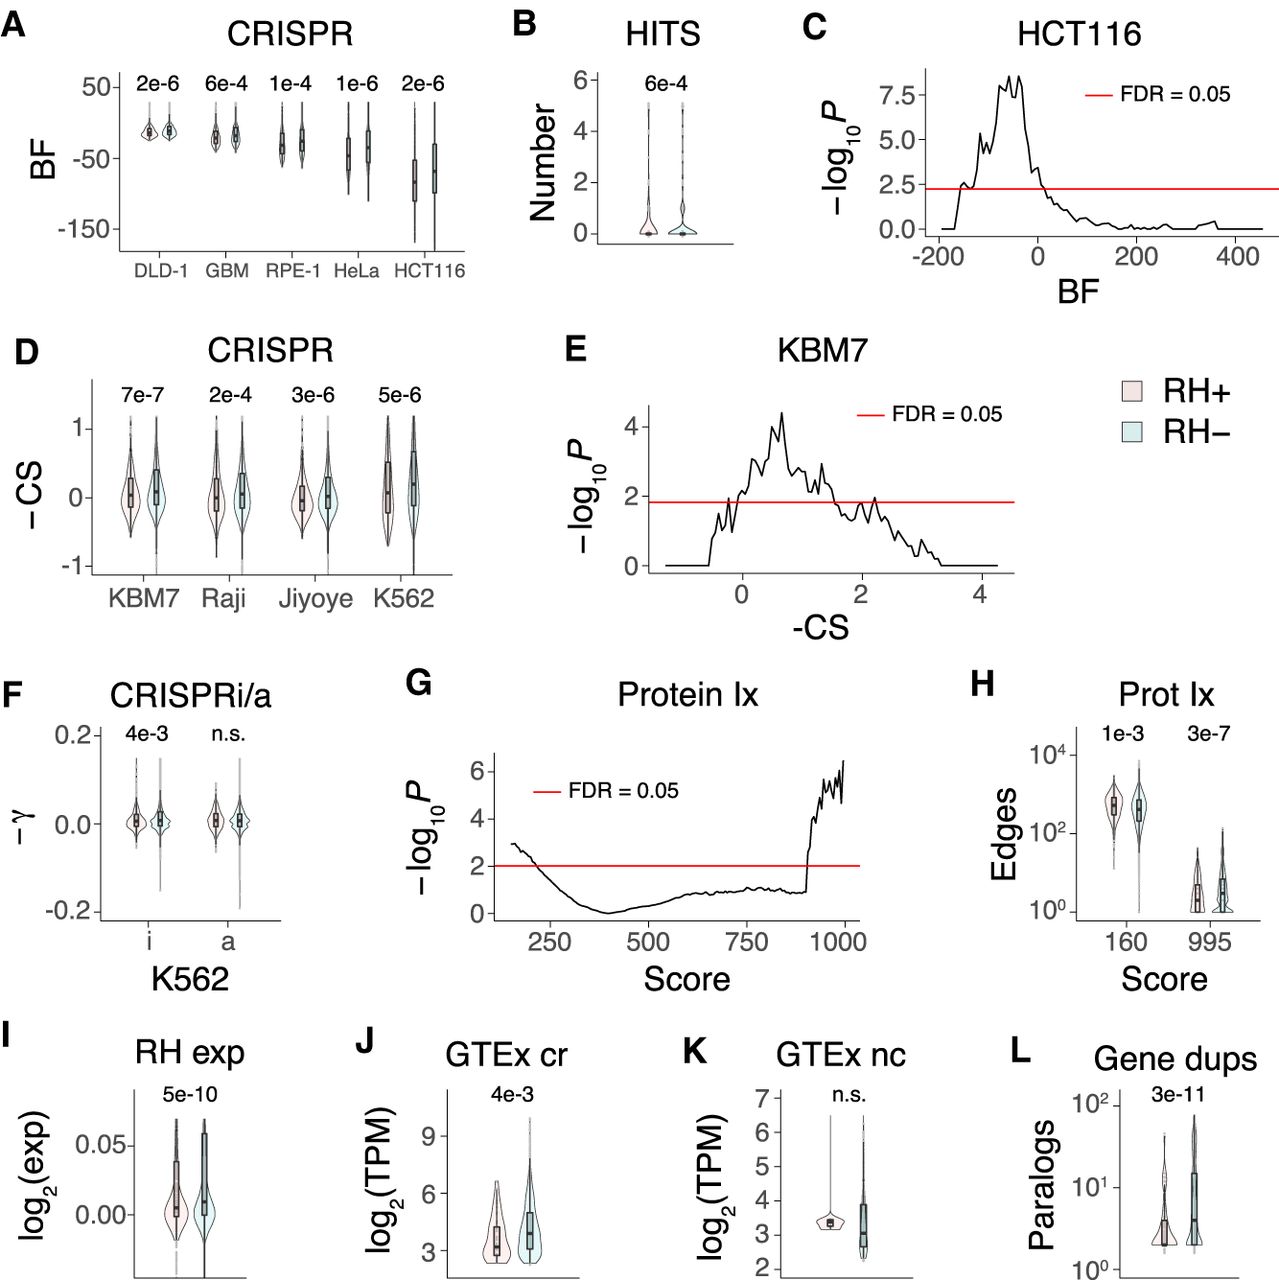
To test the second prediction, we asked whether the RH growth genes had increased likelihood of protein–protein interactions, similar to the CRISPR essential genes (Hart et al. 2015; Wang et al. 2015). Using the STRING v11 database (Szklarczyk et al. 2019), the RH growth genes showed decreased numbers of high-confidence protein–protein interactions and a corresponding increase in low-confidence interactions (Fig. 6G,H). Further, the RH growth genes showed no significant enrichment in protein interactions, molecular pathways, or multi-subunit protein complexes using Enrichr or DAVID (FDR > 0.05) (Huang et al. 2009; Chen et al. 2013). These findings contradict the second prediction of the balance hypothesis.
Based on our results and those in yeast (Sopko et al. 2006), it appears that gene dosage alterations do not exert their effects through unbalanced synthesis of gene products, even in evolutionarily distant cells. Other mechanisms are likely responsible for gene dosage effects.
Further divergent properties of RH-BSA and loss-of-function growth genes
There were further divergent properties between the RH and CRISPR growth genes, in addition to those discussed in the previous section. Essential coding region genes identified in loss-of-function CRISPR screens showed increased expression (Hart et al. 2015; Wang et al. 2015). In contrast, the RH-BSA growth genes had the opposite behavior with decreased expression of coding, but not noncoding, genes in both a microarray data set from a human RH panel (Fig. 6I; Wang et al. 2011) and in RNA-seq data from human tissues (Fig. 6J,K; Supplemental Fig. S26; The GTEx Consortium 2015). The decreased expression of the RH growth genes may be the result of evolutionary selection for this property in genes with high dosage sensitivity.
CRISPR growth genes were less likely to have human paralogs because duplicated genes offer functional redundancy (Wang et al. 2015). The RH growth genes also had fewer duplicates but perhaps for a different reason; additional copies of the RH growth genes could result in adverse phenotypes, as these genes inhibit proliferation when present in an extra dose (Fig. 6L).
Similar properties of RH-BSA and loss-of-function growth genes
In other respects, the RH and CRISPR growth genes had comparable properties. Both sets of genes were intolerant of loss-of-function mutations, suggesting similar functional importance (Supplemental Fig. S27A; Wang et al. 2015). In addition, the RH and CRISPR growth genes showed decreased human/mouse sequence divergence, indicating evolutionarily conserved roles (Supplemental Fig. S27B; Hart et al. 2015; Wang et al. 2015). The RH and CRISPR growth genes also showed increased numbers of orthologs across species (“phyletic retention”), further suggesting evolutionary conservation of these two gene classes (Supplemental Fig. S27C; Wang et al. 2015).
The CRISPR screens for essential genes were restricted to coding genes and showed longer transcripts, increased exon numbers, and longer coding sequences (Hart et al. 2015; Wang et al. 2015). The coding and noncoding RH growth genes also showed increased gene length, transcript size, and exon numbers, as well as longer open reading frames for coding genes (Supplemental Fig. S27D–J).
Receiver operating characteristic (ROC) curves showed that gene length was the best predictor of RH growth genes (area under the curve [AUC] = 0.76 and 0.70 for coding and noncoding genes, respectively), followed by CRISPR essentiality scores, protein interactions, and RH expression levels (Supplemental Fig. S27K). The ROCs were significantly better predictors than random (P < 4.9 × 10⁻⁴, Wilcoxon rank sum test).
The RH growth genes showed no significant increase in effect scores, or overlap, with growth genes from a CRISPRa screen (Fig. 6F; Supplemental Fig. S25F; Gilbert et al. 2014). The constitutive overexpression of the CRISPRa technology may be responsible for the discrepancy.
Novel RH growth genes
The coding region RH growth genes were relatively poorly studied, having fewer literature citations in the GeneRIF and Reactome databases (Supplemental Fig. S28). Of the 442 coding region RH growth genes, 148 had neither literature citations in GeneRIF nor entries in the Reactome database. Study of these little understood genes may provide insights into mammalian cell growth.
Unconventional RH growth loci included six that mapped to olfactory gene clusters (Supplemental Fig. S29A) and two that mapped to gene deserts, with the nearest gene >250 kb away (Supplemental Fig. S29B,C).
Paclitaxel loci
Paclitaxel loci were identified by detecting significant changes in human reads as a result of rising drug concentration at the various growth times. The number of loci increased significantly with longer growth periods, suggesting that the various exposure times recruit different genes (Fig. 4B; Supplemental Figs. S20, S21B, S30; Supplemental Tables S9–S11). This observation is consistent with our previous study using a panel of human RH clones (Khan et al. 2016), as well as findings in yeast (Wang and Kruglyak 2014). There were 38 unique paclitaxel loci in total.
Compared to the growth loci, a significantly greater proportion of paclitaxel loci (seven out of 38) had positive coefficients indicating increased representation as a result of drug exposure (Supplemental Fig. S23B).
Of the 34 noncentromeric paclitaxel loci, the nearest genes were coding for 19 (56%) and noncoding for 15 (44%), not significantly different from random. Coding and noncoding genes make important contributions to the action of paclitaxel as well as growth.
Close-up views of significant paclitaxel loci are shown in Supplemental Figure S31. Consistent with the activity of paclitaxel as an antitubulin drug, there were two genes among the paclitaxel loci that are known to participate in microtubule function; NEK10 (Porpora et al. 2018; Yi et al. 2018) and PDE4DIP (Bouguenina et al. 2017; Yang et al. 2017). The role of PDE4DIP may explain the clinical utility of phosphodiesterase 4 inhibitors as antiproliferative and immunosuppressive agents (Keating 2017).
There were 10 genes in common between the 38 paclitaxel loci and 859 growth loci, including LSAMP, SEMA3D, and GATAD2A (Supplemental Fig. S32). The dual role of these genes in growth and microtubule function suggests that they may be attractive targets for the development of antiproliferative drugs.
A number of the paclitaxel loci mapped to novel genes, suggesting fresh entry points for understanding the mechanisms of action of this drug.
Interaction loci
A total of 62 human interaction loci were identified based on read changes due to growth depending significantly on paclitaxel concentration and vice versa. Of the 57 noncentromeric interaction loci, the nearest genes were coding for 26 (46%) and noncoding for 31 (54%), not significantly different from random. Coding and noncoding genes make important contributions to the action of the interaction genes.
Of the interaction loci, 15 overlapped with the 859 growth loci and 14 overlapped with the 38 paclitaxel loci (Supplemental Figs. S21C, S23C, S32–S34; Supplemental Tables S9, S10). The interaction loci included genes previously demonstrated to coregulate growth and tubulin function. For example, HGF promotes microtubule assembly and shows complex cell growth effects when combined with paclitaxel (Dugina et al. 1995; Rasola et al. 2004; Tian et al. 2014; Ying et al. 2015). Similarly, FSIP1 regulates growth of triple-negative breast cancer cells and resistance to docetaxel, a drug in the same class as paclitaxel (Liu et al. 2018). SIKE1 (Sonnenschein et al. 2018) and CPT1A (Li et al. 2013) also regulated both cell growth and microtubule activity. The interaction genes may thus provide useful clues to the relationship between growth inhibition and paclitaxel action.
Empirical evaluation of mapping resolution using RH-BSA
The −2log10P width of the RH loci (Fig. 5; Supplemental Figs. S31, S34) suggested a mapping resolution of <100 kb. To obtain an empirical estimate of mapping accuracy, we used the increased retention frequency of TK1 and the centromeres as a proxy for locus identification (Fig. 2; Supplemental Figs. S5, S6, S35). The mapping accuracy estimated using both approaches was similar, together suggesting a resolution ∼30 kb. This mapping accuracy was consistent with that expected from the number of breakpoints in the RH pools.
Despite its high mapping resolution, the RH strategy could not always resolve neighboring loci, particularly in areas of high gene density (Supplemental Fig. S36). In the future, increased radiation doses and pool numbers will help resolve these complex regions.
Mitochondrial copy number
Mitochondria in HEK293 and A23 cells
The sequence data revealed a mitochondrial copy number of 2145 for the donor HEK293 cells and 843 for the recipient A23 cells (Supplemental Table S4), similar to published values for mammalian mitochondria (Phillips et al. 2014; van Gisbergen et al. 2015; Reznik et al. 2016; Wachsmuth et al. 2016).
Human loci regulating hamster mitochondrial abundance
The hamster mitochondrial copy number in the six RH pools was 757 ± 63, not significantly different from A23 cells (t[1,5] = 0.51, P = 0.63; two-sample t-test) (Supplemental Fig. S37A,B; Supplemental Table S12).
We identified three human loci that significantly regulated hamster mitochondrial reads in the RH samples, DARS2, GORAB, and GRID2 (Supplemental Fig. S38). Increased dosage of all three loci was associated with higher hamster mitochondrial copy number (Supplemental Fig. S38A–D). DARS2 encodes human mitochondrial aspartyl-tRNA synthetase (Scheper et al. 2007), while GRID2 encodes the glutamate ionotropic receptor delta type subunit 2 which has previously been shown to promote mitochondrial fission (Liu and Shio 2008).
Human loci regulating human mitochondrial abundance
Human mitochondria were only present at low copy number (1.0 ± 0.4, mean copy number all RH samples; t[1,5.3] = 2.7, P = 0.04, Kenward-Roger degrees of freedom; average conditional effects), suggesting that these organelles are either donated inefficiently or replicate poorly in hamster cells (Supplemental Fig. S37C–H; Supplemental Table S12).
Consistent with the low levels of human mitochondria, we found no permutation significant human loci that regulated the read numbers of this organelle. However, one locus on Chromosome 3 surpassed the less stringent FDR threshold of 0.05 (−log10P = 8.6, FDR = 8.1 × 10⁻⁴) (Supplemental Fig. S38E,F). This locus mapped to CAPN7 and was 14.9 kb from SH3BP5, whose product is localized to the outer mitochondrial membrane and is involved in regulation of apoptosis (Win et al. 2018). Nevertheless, the locus should be viewed with considerable caution; deeper sequencing may provide stronger evidence for loci that regulate human mitochondrial levels.
Hamster loci
Significant hamster loci due to pre-existing copy number alterations (CNAs) (Fig. 2A,B; Supplemental Fig. S2) were identified for growth, paclitaxel, and their interaction (Supplemental Figs. S39, S40).
The hamster loci had weaker −log10P values than the human, consistent with the greater stability of the hamster genome (Fig. 3A–D; Supplemental Fig. S10). In addition, hamster CNAs and their corresponding loci ranged over megabases which, combined with random fluctuations in −log10P values, precluded gene identification (Supplemental Fig. S41).
Mycoplasma contamination
The sequence data revealed appreciable levels of mycoplasma contamination in the A23 parental cells, as well as in the RH samples (Supplemental Table S13). However, including the Mycoplasma fermentans reads in our statistical model left the growth and paclitaxel loci essentially unchanged. In addition, no significant human loci were found that regulated the levels of the bacterium (all FDR = 1). Together, these results indicate that the mycoplasma contamination had little effect on our study.
Discussion
We implemented RH-BSA by creating six independent pools of RH cells, each with ∼2500 clones. The RH pools were placed under growth selection in either normal medium or medium supplemented with paclitaxel. We used low-pass sequencing to identify human genes with significant read changes as a result of growth or drug treatment.
The mean length of the human DNA fragments was ∼7 Mb, and the number of breakpoints in each pool was ∼105. The cells contained an average of ∼4% of the human genome as extra copies, with each pool carrying the human genome with ∼100-fold redundancy.
Unlike current screening technologies, where each cell carries one altered gene, each cell in RH-BSA harbors multiple genes. This extra layer of multiplexing helps assure equal and robust representation of the human genome in the pooled analysis.
Significant loci were identified using permutation, with a null expectation for each genome-scan of 0.05 false positives, or 0.7 loci from 13 genome scans. We found 859 growth loci, 38 paclitaxel loci, 62 interaction loci, and three loci regulating mitochondrial levels, far exceeding expectations and suggesting a low false positive rate. Cross-validation further demonstrated the high reliability of the approach.
We used the increased retention of TK1 and the centromeres to measure the mapping resolution of RH-BSA as ∼30 kb, close to single gene. This resolution was consistent with that expected from the breakpoint number. Unlike association mapping (Edwards et al. 2013), the resolution of RH-BSA is not limited by recombination hotspots and linkage disequilibrium. In fact, the resolution and power of RH-BSA can be further increased by using higher doses of radiation and more pools. Tenfold enhancements are readily attainable.
While the measured resolution was frequently sufficient for single gene identification, gene-rich regions could not be clearly resolved. Nevertheless, a number of conclusions could be drawn from our study.
The RH-BSA growth genes showed significant nonoverlap with genes identified from loss-of-function screens, as well as decreased participation in multi-subunit complexes. These findings repudiated the balance hypothesis, agreeing with findings from yeast. Altered gene dosage may thus exert its effects via absolute, rather than relative, expression levels.
As well as their divergent properties, the RH-BSA and loss-of-function growth genes also shared attributes. In particular, both sets of genes showed higher evolutionary conservation and increased gene lengths.
The RH growth genes were overrepresented in the GWAS catalog and dbGaP. Complex trait variants are often found in regulatory regions, exerting their effects through altered gene expression. The extra human gene copies in the RH pools may simulate these mild allelic effects and hence represent attractive candidate genes for complex traits. In addition, both coding and noncoding RH genes made substantial contributions to cell growth, paclitaxel action, and their interaction.
Three significant human loci that regulated hamster mitochondrial abundance were identified, two of which had known functions in mitochondria. Further study of these genes may provide useful therapeutic insights into mitochondrial disorders.
RH-BSA may also allow better mapping of functional centromere elements based on increased retention. The X and Y centromeres have been characterized in their entirety using long-read sequencing, with the α-satellite repeats necessary for centromere function extending over 2.8 Mb and 365 kb, respectively (Jain et al. 2018; Miga et al. 2020). The long reads were placed using landmark patterns of specific variants in the satellite arrays, with a frequency of ∼1 per 50 kb. Although the mapping resolution of RH-BSA is ∼30 kb, the average lengths of individual human fragments in the RH cells is ∼7 Mb. These fragments will encompass numerous α-satellite landmarks, if not entire arrays, allowing the reconstruction of centromeres for functional mapping by long-read sequencing.
Centromeric α-satellites bind to CENPA, a histone H3 variant essential for kinetochore formation. Further, α–satellite variants (epialleles) can affect CENPA binding (Aldrup-MacDonald et al. 2016). An alternative strategy for mapping functional centromeric elements would therefore employ a combination of chromatin immunoprecipitation (ChIP) and immunolabeling-fluorescent in situ hybridization (immunoFISH) to assay CENPA-associated DNA in the donor human cells and RH pools. Both long-read sequencing and immunoFISH will allow individual centromere homologs to be examined.
Changes in human DNA abundance in the RH pools could be due either to DNA loss or altered clone representation. Pooled analysis cannot distinguish between these possibilities. However, the majority of the growth and paclitaxel loci showed decreased read counts, which is consistent with the known tendency of RH cells to lose human DNA fragments. Thus, DNA loss may be the predominant mechanism of copy number change in the RH pools. Single cell analysis can discriminate unequivocally between the two alternatives.
RH cells are a unique tool. These cells are not entirely normal. Their genome does not exist in nature, representing hybrids of two closely related mammalian species, human and hamster. They are also aneuploid, with ∼4% of the genome in the triploid state. Nevertheless, the cells grow and divide and contain all the standard features found in mammalian cells (e.g., cytoskeleton, mitosis, etc.). For a small number of genes, the evaluated phenotypes may be due to species differences, but such occurrences will be infrequent and will still be valuable in highlighting phenotypic mechanisms.
The parental cells used to create the RH pools are immortalized and, in the case of HEK293, also tumorigenic. Pre-existing mutations in these cells may influence the effects of copy number changes across the genome, imposing limitations on the relevance of our findings to cell types such as primary cells.
Such constraints can be overcome by exploring the utility of other cells in the fusion process (Hiratsuka et al. 2015; Liskovykh et al. 2016; Suzuki et al. 2016). A variety of species, including human, can be evaluated for both donor and recipient cells. In addition, selectable markers such as neomycin resistance can be used instead of TK1, alleviating concerns about the perturbation of nucleotide synthesis pathways by HAT medium (Aoki et al. 2014).
Although the mycoplasma infection did not appear to affect the gene mapping results, follow-up investigations of gene function could be influenced by this contamination. The hamster cells can be cured of mycoplasma using well-established antibiotic regimens (Uphoff et al. 2012). Known mycoplasma-free cells can also be employed as the recipients.
We previously identified ZNRF3, a regulator of Wnt signaling, as a target for paclitaxel action using individual clones from the human G3 RH panel (Khan et al. 2016). This locus was not replicated using the RH pools. In our original study, the RH clones were weaned from HAT, unlike the RH-BSA experiments. In addition, the ability to detect growth factor signaling pathways is likely to be attenuated in a pooled setting. These differences may explain the lack of replication.
The RH-BSA approach can be harnessed to uncover genes for any phenotype where a convenient selection can be devised (Miyake et al. 2019). The approach is complementary to loss-of-function screens and provides information on both coding and noncoding genes. RH-BSA should be a valuable addition to the suite of tools for mammalian genetics.
Methods
Sequencing
Libraries were prepared using the Illumina TruSeq Nano DNA library prep kit employing 2 μg of DNA from each RH sample. We performed the sequencing using 1 × 64-bp single reads on an Illumina HiSeq 2500 machine in rapid run mode with OLB (off-line basecaller) software and on-board cluster generation.
Reads were aligned to the indexed GRCh38/hg38 human genome assembly (hg38.fa) or the Chinese hamster (Cricetulus griseus) genome assembly (RAZU01) (Rupp et al. 2018) using BWA-0.7.12 mapping software (Li and Durbin 2009). The reference genomes were downloaded from the UCSC Genome Browser prior to use (https://genome.ucsc.edu) (Kent et al. 2002), unzipped, and relevant files concatenated and indexed using BWA. Sequence reads were aligned to the human and hamster genomes at high stringency, allowing only one mismatch. Aligned reads were then cross-aligned to the other species and reads that aligned to both species discarded, effectively discriminating between human or hamster sequences.
Aligned sequences were converted to SAM format and sorted and indexed using SAMtools-1.2 software (Li et al. 2009). To read and view sequence information, SAM files were converted to BAM files employing SAMtools. Indexed sorted BAM files were converted to BED files using BEDTools-2.15.0 (Quinlan and Hall 2010).
Read quantitation
The human and hamster nuclear reference genomes were indexed into 1-Mb windows using BEDTools, with 10-kb steps for both human and for hamster. BED files were then mapped against the indexed reference genome and the number of reads per 1-Mb window ascertained. We chose the 1-Mb window size as being small enough to reflect the mapping accuracy of RH-BSA but large enough to keep the sampling variance within bounds. Similarly, the 10-kb step size was sufficiently small to accurately delineate the mapped loci, while keeping the computing load manageable. The reads per nonoverlapping 1-Mb window in the 115 RH samples were 237 ± 12 for human and 13,798 ± 234 for hamster.
Data access
The sequencing data generated in this study have been submitted to the NCBI BioProject database (https://www.ncbi.nlm.nih.gov/bioproject/) under accession number PRJNA592253. Other data, tables, and computer scripts are available as Supplemental Code and from NIH figshare (https://nih.figshare.com/; http://dx.doi.org/10.35092/yhjc.11370204).
Competing interest statement
The authors declare no competing interests.
Acknowledgments
We thank the UCLA Semel Institute Neurosciences Genomics Core for sequencing. This work used computational and storage services associated with the Hoffman2 Shared Cluster provided by the UCLA Institute for Digital Research and Education Research Technology Group. We thank Jake Lusis for helpful comments on the manuscript. This study was supported by the National Institutes of Health (R21 HG007405), the Bennet Mills Allen Trust, the Edna Jones Endowment, and the Department of Molecular and Medical Pharmacology, UCLA (to D.J.S.).
Author contributions: A.H.K.: acquisition of data, analysis and interpretation of data, drafting or revising the article. A.L.: analysis and interpretation of data. R.T.W.: analysis and interpretation of data. J.S.B.: analysis and interpretation of data. K.L.: analysis and interpretation of data. D.J.S.: conception and design, analysis and interpretation of data, drafting or revising the article.
Notes
[1] Supplementary material [Supplemental material is available for this article.]
[2] Article published online before print. Article, supplemental material, and publication date are at http://www.genome.org/cgi/doi/10.1101/gr.262204.120.
References
- ↵Ahn S, Wang RT, Park CC, Lin A, Leahy RM, Lange K, Smith DJ. 2009. Directed mammalian gene regulatory networks using expression and comparative genomic hybridization microarray data from radiation hybrids. PLoS Comput Biol 5: e1000407. 10.1371/journal.pcbi.1000407
- ↵Alagia A, Eritja R. 2016. siRNA and RNAi optimization. Wiley Interdiscip Rev RNA 7: 316–329. 10.1002/wrna.1337
- ↵Aldrup-MacDonald ME, Kuo ME, Sullivan LL, Chew K, Sullivan BA. 2016. Genomic variation within α satellite DNA influences centromere location on human chromosomes with metastable epialleles. Genome Res 26: 1301–1311. 10.1101/gr.206706.116
- ↵Aoki J, Kai W, Kawabata Y, Ozaki A, Yoshida K, Tsuzaki T, Fuji K, Koyama T, Sakamoto T, Araki K. 2014. Construction of a radiation hybrid panel and the first yellowtail (Seriola quinqueradiata) radiation hybrid map using a nanofluidic dynamic array. BMC Genomics 15: 165. 10.1186/1471-2164-15-165
- ↵Arnoldo A, Kittanakom S, Heisler LE, Mak AB, Shukalyuk AI, Torti D, Moffat J, Giaever G, Nislow C. 2014. A genome scale overexpression screen to reveal drug activity in human cells. Genome Med 6: 32. 10.1186/gm549
- ↵Avner P, Bruls T, Poras I, Eley L, Gas S, Ruiz P, Wiles MV, Sousa-Nunes R, Kettleborough R, Rana A, 2001. A radiation hybrid transcript map of the mouse genome. Nat Genet 29: 194–200. 10.1038/ng1001-194
- ↵Benjamini Y, Hochberg Y. 1995. Controlling the false discovery rate: a practical and powerful approach to multiple testing. J R Stat Soc Ser B Methodol 57: 289–300. 10.1111/j.2517-6161.1995.tb02031.x
- ↵Blakely K, Ketela T, Moffat J. 2011. Pooled lentiviral shRNA screening for functional genomics in mammalian cells. Methods Mol Biol 781: 161–182. 10.1007/978-1-61779-276-2_9
- ↵Boettcher M, McManus MT. 2015. Choosing the right tool for the job: RNAi, TALEN, or CRISPR. Mol Cell 58: 575–585. 10.1016/j.molcel.2015.04.028
- ↵Bofill-De Ros X, Gu S. 2016. Guidelines for the optimal design of miRNA-based shRNAs. Methods 103: 157–166. 10.1016/j.ymeth.2016.04.003
- ↵Bouguenina H, Salaun D, Mangon A, Muller L, Baudelet E, Camoin L, Tachibana T, Cianférani S, Audebert S, Verdier-Pinard P, 2017. EB1-binding-myomegalin protein complex promotes centrosomal microtubules functions. Proc Natl Acad Sci 114: E10687–E10696. 10.1073/pnas.1705682114
- ↵Chen EY, Tan CM, Kou Y, Duan Q, Wang Z, Meirelles GV, Clark NR, Ma'ayan A. 2013. Enrichr: interactive and collaborative HTML5 gene list enrichment analysis tool. BMC Bioinformatics 14: 128. 10.1186/1471-2105-14-128
- ↵Cox DR, Burmeister M, Price ER, Kim S, Myers RM. 1990. Radiation hybrid mapping: a somatic cell genetic method for constructing high-resolution maps of mammalian chromosomes. Science 250: 245–250. 10.1126/science.2218528
- ↵Derrien T, Johnson R, Bussotti G, Tanzer A, Djebali S, Tilgner H, Guernec G, Martin D, Merkel A, Knowles DG, 2012. The GENCODE v7 catalog of human long noncoding RNAs: analysis of their gene structure, evolution, and expression. Genome Res 22: 1775–1789. 10.1101/gr.132159.111
- ↵Dugina VB, Alexandrova AY, Lane K, Bulanova E, Vasiliev JM. 1995. The role of the microtubular system in the cell response to HGF/SF. J Cell Sci 108(Pt 4): 1659–1667
- ↵Edwards SL, Beesley J, French JD, Dunning AM. 2013. Beyond GWASs: illuminating the dark road from association to function. Am J Hum Genet 93: 779–797. 10.1016/j.ajhg.2013.10.012
- ↵Ehrenreich IM, Torabi N, Jia Y, Kent J, Martis S, Shapiro JA, Gresham D, Caudy AA, Kruglyak L. 2010. Dissection of genetically complex traits with extremely large pools of yeast segregants. Nature 464: 1039–1042. 10.1038/nature08923.
- ↵Eksi R, Li HD, Menon R, Wen Y, Omenn GS, Kretzler M, Guan Y. 2013. Systematically differentiating functions for alternatively spliced isoforms through integrating RNA-seq data. PLoS Comput Biol 9: e1003314. 10.1371/journal.pcbi.1003314
- ↵Frankish A, Uszczynska B, Ritchie GRS, Gonzalez JM, Pervouchine D, Petryszak R, Mudge JM, Fonseca N, Brazma A, Guigo R, 2015. Comparison of GENCODE and RefSeq gene annotation and the impact of reference geneset on variant effect prediction. BMC Genomics 16(Suppl 8): S2. 10.1186/1471-2164-16-s8-s2
- ↵Gallagher MD, Chen-Plotkin AS. 2018. The post-GWAS era: from association to function. Am J Hum Genet 102: 717–730. 10.1016/j.ajhg.2018.04.002
- ↵Gilbert LA, Horlbeck MA, Adamson B, Villalta JE, Chen Y, Whitehead EH, Guimaraes C, Panning B, Ploegh HL, Bassik MC, 2014. Genome-scale CRISPR-mediated control of gene repression and activation. Cell 159: 647–661. 10.1016/j.cell.2014.09.029
- ↵Goss SJ, Harris H. 1975. New method for mapping genes in human chromosomes. Nature 255: 680–684. 10.1038/255680a0
- ↵The GTEx Consortium. 2015. Human genomics. The Genotype-Tissue Expression (GTEx) pilot analysis: multitissue gene regulation in humans. Science 348: 648–660. 10.1126/science.1262110
- ↵Harris H. 1993. How tumour suppressor genes were discovered. FASEB J 7: 978–979. 10.1096/fasebj.7.10.8344496
- ↵Hart T, Chandrashekhar M, Aregger M, Steinhart Z, Brown KR, MacLeod G, Mis M, Zimmermann M, Fradet-Turcotte A, Sun S, 2015. High-resolution CRISPR screens reveal fitness genes and genotype-specific cancer liabilities. Cell 163: 1515–1526. 10.1016/j.cell.2015.11.015
- ↵Hiratsuka M, Ueda K, Uno N, Uno K, Fukuhara S, Kurosaki H, Takehara S, Osaki M, Kazuki Y, Kurosawa Y, 2015. Retargeting of microcell fusion towards recipient cell-oriented transfer of human artificial chromosome. BMC Biotechnol 15: 58. 10.1186/s12896-015-0142-z
- ↵Huang DW, Sherman BT, Lempicki RA. 2009. Systematic and integrative analysis of large gene lists using DAVID bioinformatics resources. Nat Protoc 4: 44–57. 10.1038/nprot.2008.211
- ↵Hudson TJ, Church DM, Greenaway S, Nguyen H, Cook A, Steen RG, Van Etten WJ, Castle AB, Strivens MA, Trickett P, 2001. A radiation hybrid map of mouse genes. Nat Genet 29: 201–205. 10.1038/ng1001-201
- ↵Jain M, Olsen HE, Turner DJ, Stoddart D, Bulazel KV, Paten B, Haussler D, Willard HF, Akeson M, Miga KH. 2018. Linear assembly of a human centromere on the Y chromosome. Nat Biotechnol 36: 321–323. 10.1038/nbt.4109
- ↵Kampmann M. 2018. CRISPRi and CRISPRa screens in mammalian cells for precision biology and medicine. ACS Chem Biol 13: 406–416. 10.1021/acschembio.7b00657
- ↵Keating GM. 2017. Apremilast: a review in psoriasis and psoriatic arthritis. Drugs 77: 459–472. 10.1007/s40265-017-0709-1
- ↵Kent WJ, Sugnet CW, Furey TS, Roskin KM, Pringle TH, Zahler AM, Haussler D. 2002. The human genome browser at UCSC. Genome Res 12: 996–1006. 10.1101/gr.229102
- ↵Khan AH, Bloom JS, Faridmoayer E, Smith DJ. 2016. Genetic screening reveals a link between Wnt signaling and antitubulin drugs. Pharmacogenomics J 16: 164–172. 10.1038/tpj.2015.50
- ↵Koike-Yusa H, Li Y, Tan EP, Velasco-Herrera MDC, Yusa K. 2014. Genome-wide recessive genetic screening in mammalian cells with a lentiviral CRISPR-guide RNA library. Nat Biotechnol 32: 267–273. 10.1038/nbt.2800
- ↵Kozomara A, Griffiths-Jones S. 2014. miRBase: annotating high confidence microRNAs using deep sequencing data. Nucleic Acids Res 42: D68–D73. 10.1093/nar/gkt1181
- ↵Kucherlapati RS, Ruddle FH. 1975. Mammalian somatic hybrids and human gene mapping. Ann Intern Med 83: 553–560. 10.7326/0003-4819-83-4-553
- ↵Kwitek AE, Gullings-Handley J, Yu J, Carlos DC, Orlebeke K, Nie J, Eckert J, Lemke A, Andrae JW, Bromberg S, 2004. High-density rat radiation hybrid maps containing over 24,000 SSLPs, genes, and ESTs provide a direct link to the rat genome sequence. Genome Res 14: 750–757. 10.1101/gr.1968704
- ↵Li H, Durbin R. 2009. Fast and accurate short read alignment with Burrows-Wheeler transform. Bioinformatics 25: 1754–1760. 10.1093/bioinformatics/btp324
- ↵Li H, Handsaker B, Wysoker A, Fennell T, Ruan J, Homer N, Marth G, Abecasis G, Durbin R, 1000 Genome Project Data Processing Subgroup. 2009. The Sequence Alignment/Map format and SAMtools. Bioinformatics 25: 2078–2079. 10.1093/bioinformatics/btp352
- ↵Li J, Zhao S, Zhou X, Zhang T, Zhao L, Miao P, Song S, Sun X, Liu J, Zhao X, 2013. Inhibition of lipolysis by mercaptoacetate and etomoxir specifically sensitize drug-resistant lung adenocarcinoma cell to paclitaxel. PLoS One 8: e74623. 10.1371/journal.pone.0074623.
- ↵Li HD, Menon R, Omenn GS, Guan Y. 2014. The emerging era of genomic data integration for analyzing splice isoform function. Trends Genet 30: 340–347. 10.1016/j.tig.2014.05.005
- ↵Lin A, Wang RT, Ahn S, Park CC, Smith DJ. 2010. A genome-wide map of human genetic interactions inferred from radiation hybrid genotypes. Genome Res 20: 1122–1132. 10.1101/gr.104216.109
- ↵Lin YC, Boone M, Meuris L, Lemmens I, Van Roy N, Soete A, Reumers J, Moisse M, Plaisance S, Drmanac R, 2014. Genome dynamics of the human embryonic kidney 293 lineage in response to cell biology manipulations. Nat Commun 5: 4767. 10.1038/ncomms5767
- ↵Liskovykh M, Lee NC, Larionov V, Kouprina N. 2016. Moving toward a higher efficiency of microcell- mediated chromosome transfer. Mol Ther Methods Clin Dev 3: 16043. 10.1038/mtm.2016.43
- ↵Liu QA, Shio H. 2008. Mitochondrial morphogenesis, dendrite development, and synapse formation in cerebellum require both Bcl-w and the glutamate receptor δ2. PLoS Genet 4: e1000097. 10.1371/journal.pgen.1000097
- ↵Liu SJ, Horlbeck MA, Cho SW, Birk HS, Malatesta M, He D, Attenello FJ, Villalta JE, Cho MY, Chen Y, 2017. CRISPRi-based genome-scale identification of functional long noncoding RNA loci in human cells. Science 355: eaah7111. 10.1126/science.aah7111
- ↵Liu C, Sun L, Yang J, Liu T, Yang Y, Kim SM, Ou X, Wang Y, Sun L, Zaidi M, 2018. FSIP1 regulates autophagy in breast cancer. Proc Natl Acad Sci 115: 13075–13080. 10.1073/pnas.1809681115
- ↵McCarthy LC, Bihoreau MT, Kiguwa SL, Browne J, Watanabe TK, Hishigaki H, Tsuji A, Kiel S, Webber C, Davis ME, 2000. A whole-genome radiation hybrid panel and framework map of the rat genome. Mamm Genome 11: 791–795. 10.1007/s003350010132
- ↵Michelmore RW, Paran I, Kesseli RV. 1991. Identification of markers linked to disease-resistance genes by bulked segregant analysis: a rapid method to detect markers in specific genomic regions by using segregating populations. Proc Natl Acad Sci 88: 9828–9832. 10.1073/pnas.88.21.9828
- ↵Miga KH, Koren S, Rhie A, Vollger MR, Gershman A, Bzikadze A, Brooks S, Howe E, Porubsky D, Logsdon GA, 2020. Telomere-to-telomere assembly of a complete human X chromosome. Nature 585: 79–84. 10.1038/s41586-020-2547-7
- ↵Miyake A, Kawasaki J, Ngo H, Makundi I, Muto Y, Khan AH, Smith DJ, Nishigaki K. 2019. Reduced folate carrier: an entry receptor for a novel feline leukemia virus variant. J Virol 93: e00269-19. 10.1128/jvi.00269-19
- ↵Mohr SE, Smith JA, Shamu CE, Neumüller RA, Perrimon N. 2014. RNAi screening comes of age: improved techniques and complementary approaches. Nat Rev Mol Cell Biol 15: 591–600. 10.1038/nrm3860
- ↵Mohr SE, Hu Y, Ewen-Campen B, Housden BE, Viswanatha R, Perrimon N. 2016. CRISPR guide RNA design for research applications. FEBS J 283: 3232–3238. 10.1111/febs.13777
- ↵Olivier M, Aggarwal A, Allen J, Almendras AA, Bajorek ES, Beasley EM, Brady SD, Bushard JM, Bustos VI, Chu A, 2001. A high-resolution radiation hybrid map of the human genome draft sequence. Science 291: 1298–1302. 10.1126/science.1057437
- ↵Papp B, Pál C, Hurst LD. 2003. Dosage sensitivity and the evolution of gene families in yeast. Nature 424: 194–197. 10.1038/nature01771
- ↵Park CC, Ahn S, Bloom JS, Lin A, Wang RT, Wu T, Sekar A, Khan AH, Farr CJ, Lusis AJ, 2008. Fine mapping of regulatory loci for mammalian gene expression using radiation hybrids. Nat Genet 40: 421–429. 10.1038/ng.113
- ↵Pawluk A. 2018. CRISPR: no sign of slowing down. Cell 174: 1039–1041. 10.1016/j.cell.2018.08.010
- ↵Phillips NR, Sprouse ML, Roby RK. 2014. Simultaneous quantification of mitochondrial DNA copy number and deletion ratio: a multiplex real-time PCR assay. Sci Rep 4: 3887. 10.1038/srep03887
- ↵Porpora M, Sauchella S, Rinaldi L, Delle Donne R, Sepe M, Torres-Quesada O, Intartaglia D, Garbi C, Insabato L, Santoriello M, 2018. Counterregulation of cAMP-directed kinase activities controls ciliogenesis. Nat Commun 9: 1224. 10.1038/s41467-018-03643-9
- ↵Prelich G. 2012. Gene overexpression: uses, mechanisms, and interpretation. Genetics 190: 841–854. 10.1534/genetics.111.136911
- ↵Quinlan AR, Hall IM. 2010. BEDTools: a flexible suite of utilities for comparing genomic features. Bioinformatics 26: 841–842. 10.1093/bioinformatics/btq033
- ↵Ranola JMO, Ahn S, Sehl M, Smith DJ, Lange K. 2010. A Poisson model for random multigraphs. Bioinformatics 26: 2004–2011. 10.1093/bioinformatics/btq309
- ↵Rasola A, Anguissola S, Ferrero N, Gramaglia D, Maffe A, Maggiora P, Comoglio PM, Di Renzo MF. 2004. Hepatocyte growth factor sensitizes human ovarian carcinoma cell lines to paclitaxel and cisplatin. Cancer Res 64: 1744–1750. 10.1158/0008-5472.CAN-03-2383
- ↵Reznik E, Miller ML, Şenbabaoğlu Y, Riaz N, Sarungbam J, Tickoo SK, Al-Ahmadie HA, Lee W, Seshan VE, Hakimi AA, 2016. Mitochondrial DNA copy number variation across human cancers. eLife 5: e10769. 10.7554/elife.10769
- ↵Root DE, Hacohen N, Hahn WC, Lander ES, Sabatini DM. 2006. Genome-scale loss-of-function screening with a lentiviral RNAi library. Nat Methods 3: 715–719. 10.1038/nmeth924
- ↵Rupp O, MacDonald ML, Li S, Dhiman H, Polson S, Griep S, Heffner K, Hernandez I, Brinkrolf K, Jadhav V, 2018. A reference genome of the Chinese hamster based on a hybrid assembly strategy. Biotechnol Bioeng 115: 2087–2100. 10.1002/bit.26722
- ↵Scheper GC, van der Klok T, van Andel RJ, van Berkel CGM, Sissler M, Smet J, Muravina TI, Serkov SV, Uziel G, Bugiani M, 2007. Mitochondrial aspartyl-tRNA synthetase deficiency causes leukoencephalopathy with brain stem and spinal cord involvement and lactate elevation. Nat Genet 39: 534–539. 10.1038/ng2013
- ↵Shalem O, Sanjana NE, Hartenian E, Shi X, Scott DA, Mikkelsen TS, Heckl D, Ebert BL, Root DE, Doench JG, 2014. Genome-scale CRISPR-Cas9 knockout screening in human cells. Science 343: 84–87. 10.1126/science.1247005
- ↵Škalamera D, Ranall MV, Wilson BM, Leo P, Purdon AS, Hyde C, Nourbakhsh E, Grimmond SM, Barry SC, Gabrielli B, 2011. A high-throughput platform for lentiviral overexpression screening of the human ORFeome. PLoS One 6: e20057. 10.1371/journal.pone.0020057
- ↵Sonnenschein HA, Lawrence KF, Wittenberg KA, Slykas FA, Dohleman EL, Knoublauch JB, Fahey SM, Marshall TMJr, Marion JD, Bell JK. 2018. Suppressor of IKKε forms direct interactions with cytoskeletal proteins, tubulin and α-actinin, linking innate immunity to the cytoskeleton. FEBS Open Bio 8: 1064–1082. 10.1002/2211-5463.12454
- ↵Sopko R, Huang D, Preston N, Chua G, Papp B, Kafadar K, Snyder M, Oliver SG, Cyert M, Hughes TR, 2006. Mapping pathways and phenotypes by systematic gene overexpression. Mol Cell 21: 319–330. 10.1016/j.molcel.2005.12.011
- ↵Suzuki T, Kazuki Y, Oshimura M, Hara T. 2016. Highly efficient transfer of chromosomes to a broad range of target cells using Chinese hamster ovary cells expressing murine leukemia virus-derived envelope proteins. PLoS One 11: e0157187. 10.1371/journal.pone.0157187
- ↵Szklarczyk D, Gable AL, Lyon D, Junge A, Wyder S, Huerta-Cepas J, Simonovic M, Doncheva NT, Morris JH, Bork P, 2019. STRING v11: protein–protein association networks with increased coverage, supporting functional discovery in genome-wide experimental datasets. Nucleic Acids Res 47: D607–D613. 10.1093/nar/gky1131
- ↵Tian X, Tian Y, Moldobaeva N, Sarich N, Birukova AA. 2014. Microtubule dynamics control HGF-induced lung endothelial barrier enhancement. PLoS One 9: e105912. 10.1371/journal.pone.0105912
- ↵Tryka KA, Hao L, Sturcke A, Jin Y, Wang ZY, Ziyabari L, Lee M, Popova N, Sharopova N, Kimura M, 2014. NCBI's Database of Genotypes and Phenotypes: dbGaP. Nucleic Acids Res 42: D975–D979. 10.1093/nar/gkt1211
- ↵Tycko J, Myer VE, Hsu PD. 2016. Methods for optimizing CRISPR-Cas9 genome editing specificity. Mol Cell 63: 355–370. 10.1016/j.molcel.2016.07.004
- ↵Uphoff CC, Denkmann SA, Drexler HG. 2012. Treatment of mycoplasma contamination in cell cultures with Plasmocin. J Biomed Biotechnol 2012: 267678. 10.1155/2012/267678
- ↵Van Gisbergen MW, Voets AM, Starmans MHW, de Coo IFM, Yadak R, Hoffmann RF, Boutros PC, Smeets HJM, Dubois L, Lambin P. 2015. How do changes in the mtDNA and mitochondrial dysfunction influence cancer and cancer therapy? Challenges, opportunities and models. Mutat Res Rev Mutat Res 764: 16–30. 10.1016/j.mrrev.2015.01.001
- ↵Vogelstein B, Papadopoulos N, Velculescu VE, Zhou S, Diaz LA Jr, Kinzler KW. 2013. Cancer genome landscapes. Science 339: 1546–1558. 10.1126/science.1235122
- ↵Wachsmuth M, Hübner A, Li M, Madea B, Stoneking M. 2016. Age-related and heteroplasmy-related variation in human mtDNA copy number. PLoS Genet 12: e1005939. 10.1371/journal.pgen.1005939
- ↵Walter MA, Spillett DJ, Thomas P, Weissenbach J, Goodfellow PN. 1994. A method for constructing radiation hybrid maps of whole genomes. Nat Genet 7: 22–28. 10.1038/ng0594-22
- ↵Wang X, Kruglyak L. 2014. Genetic basis of haloperidol resistance in Saccharomyces cerevisiae is complex and dose dependent. PLoS Genet 10: e1004894. 10.1371/journal.pgen.1004894
- ↵Wang RT, Ahn S, Park CC, Khan AH, Lange K, Smith DJ. 2011. Effects of genome-wide copy number variation on expression in mammalian cells. BMC Genomics 12: 562. 10.1186/1471-2164-12-562
- ↵Wang T, Birsoy K, Hughes NW, Krupczak KM, Post Y, Wei JJ, Lander ES, Sabatini DM. 2015. Identification and characterization of essential genes in the human genome. Science 350: 1096–1101. 10.1126/science.aac7041
- ↵Wasmuth JJ. 2001. Overview of somatic cell hybrid mapping. Curr Protoc Hum Genet 3.1: 3.1.1–3.1.4. 10.1002/0471142905.hg0301s00
- ↵Win S, Than TA, Kaplowitz N. 2018. The regulation of JNK signaling pathways in cell death through the interplay with mitochondrial SAB and upstream post-translational effects. Int J Mol Sci 19: 3657. 10.3390/ijms19113657
- ↵Yang X, Boehm JS, Yang X, Salehi-Ashtiani K, Hao T, Shen Y, Lubonja R, Thomas SR, Alkan O, Bhimdi T, 2011. A public genome-scale lentiviral expression library of human ORFs. Nat Methods 8: 659–661. 10.1038/nmeth.1638
- ↵Yang C, Wu J, de Heus C, Grigoriev I, Liv N, Yao Y, Smal I, Meijering E, Klumperman J, Qi RZ, 2017. EB1 and EB3 regulate microtubule minus end organization and Golgi morphology. J Cell Biol 216: 3179–3198. 10.1083/jcb.201701024
- ↵Yi P, Xie C, Ou G. 2018. The kinases male germ cell-associated kinase and cell cycle-related kinase regulate kinesin-2 motility in caenorhabditis elegans neuronal cilia. Traffic 19: 522–535. 10.1111/tra.12572
- ↵Ying L, Zhu Z, Xu Z, He T, Li E, Guo Z, Liu F, Jiang C, Wang Q. 2015. Cancer associated fibroblast- derived hepatocyte growth factor inhibits the paclitaxel-induced apoptosis of lung cancer A549 cells by up-regulating the PI3K/Akt and GRP78 signaling on a microfluidic platform. PLoS One 10: e0129593. 10.1371/journal.pone.0129593