
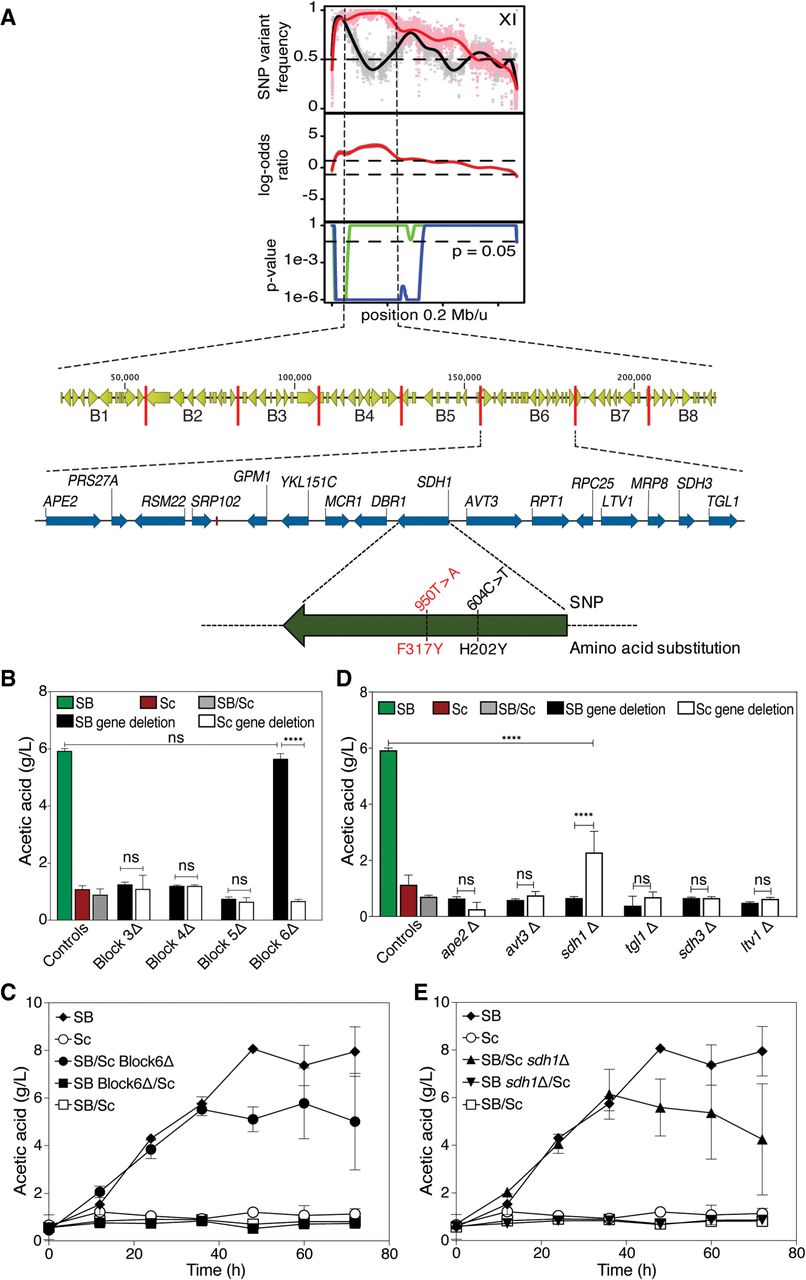
RHA for identification of the causative gene in QTL1. (A) Overview of QTL1 dissection to nucleotide level resolution. Division of QTL1 in eight gene blocks for bRHA and genes present in block 6. Scheme of the SDH1 allele of SBERH6, depicting the two nonsynonymous SNPs in the coding region of SDH1 and their resulting amino acid substitutions in Sdh1. The causative mutation is shown in red. (B) Representative example of bRHA of acetic acid secretion with pairs of SBERH6/S288c (SB/Sc) diploid strains for the blocks 3, 4, 5, and 6 (B3–B6), indicating that block 6 contains one or more causative genes. (C) Acetic acid production as a function of time by the RHA strains with deletion of block 6, SBERH6/S288c B6Δ (•) and SBERH6 B6Δ/S288c (▪) compared to the control strains SB (SBERH6) (♦), Sc (S288c) (○), and SBERH6/S288c (SB/Sc) (□). (D) RHA with the individual genes present in block 6, identifying SDH1 as causative gene. (E) Acetic acid production as a function of time by the RHA strains for the SDH1 gene, SB/Sc sdh1Δ (SBERH6/S288c sdh1Δ) (▴) and SB sdh1Δ/Sc (SBERH6 sdh1Δ/S288c) (▾), compared to the control strains Sb (SBERH6) (♦), Sc (S288c) (○), and SBERH6/ S288c (□). Results are the means of three biological replicates for each time-point. Error bars show standard deviation at each time-point. Data were analyzed by two-way ANOVA (Tukey's multiple comparisons test). Significant differences in acetic acid accumulation between strains are indicated with asterisks, (****) P < 0.0001, (ns) nonsignificant.


